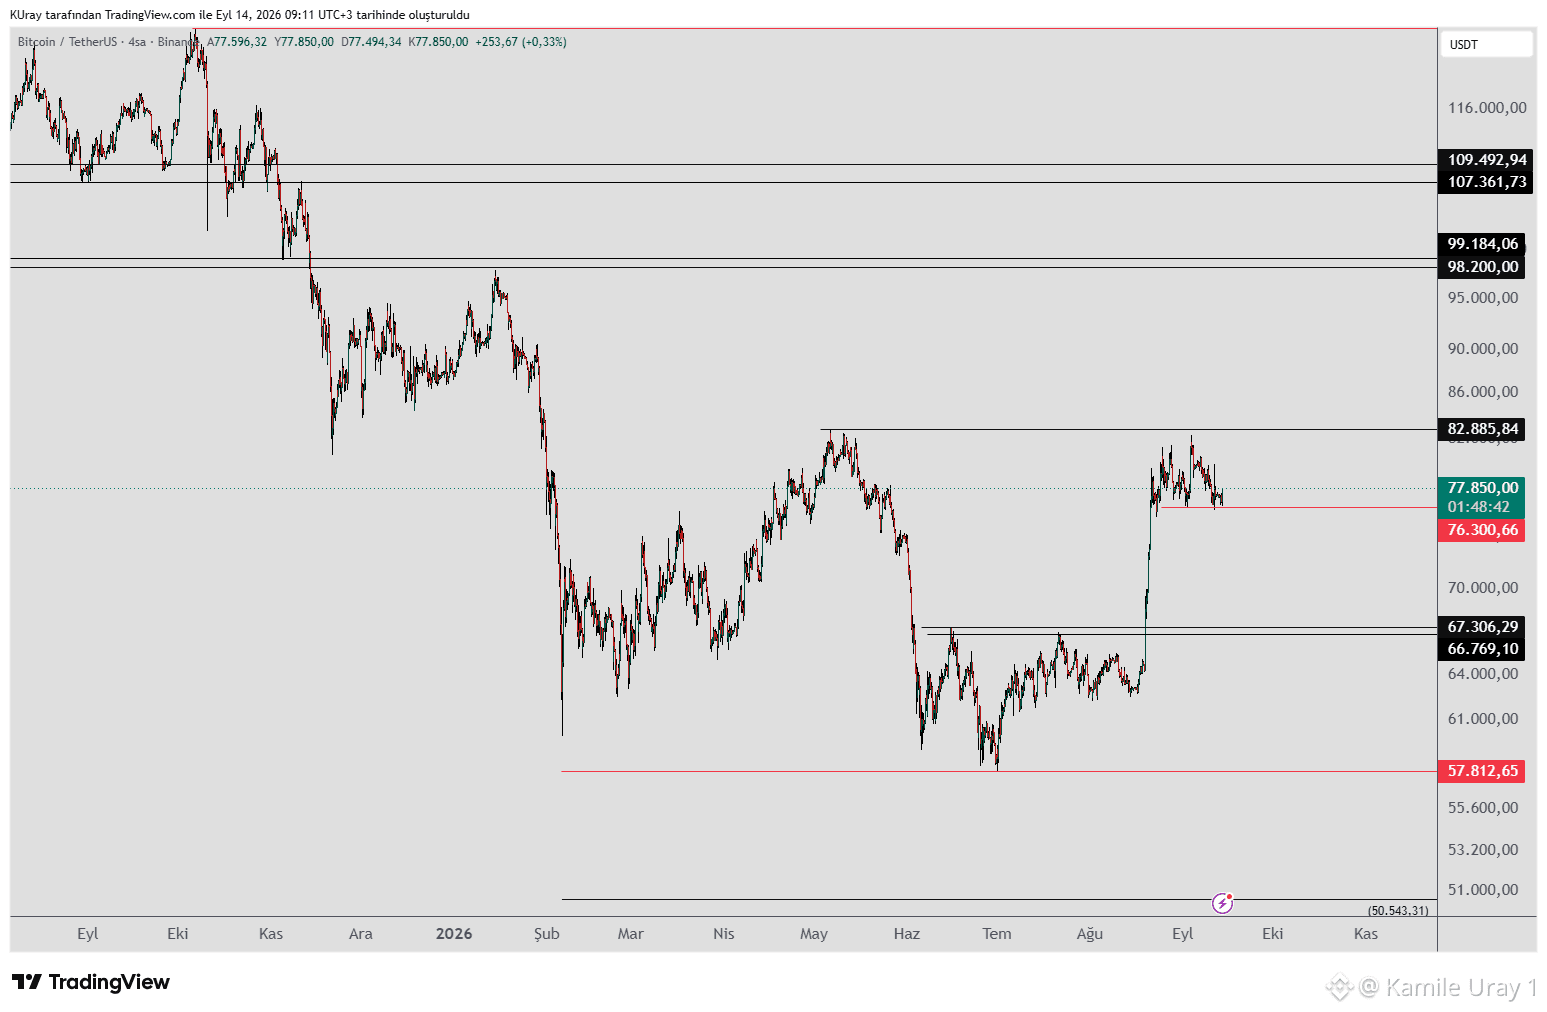
We are monitoring the #BTC level at 76,300. As long as it holds above this level, the potential for an upward move remains.
If the price closes below 76,300, there is a possibility of testing the support zone around 67,000–66,000. Declines could lead to the formation of the final shoulder of a potential inverse head-and-shoulders (H&S) pattern; if the price holds above 83,000, the pattern would activate, and a continued rise toward upper resistance levels would be expected.
If a daily or weekly close occurs above 82,885, it would mark the first higher peak relative to the most recent downward wave. This would provide another signal that the upward trend is likely to continue, after which upper resistance levels can be monitored.
If the price closes below 76,300, there is a possibility of testing the support zone around 67,000–66,000. Declines could lead to the formation of the final shoulder of a potential inverse head-and-shoulders (H&S) pattern; if the price holds above 83,000, the pattern would activate, and a continued rise toward upper resistance levels would be expected.
If a daily or weekly close occurs above 82,885, it would mark the first higher peak relative to the most recent downward wave. This would provide another signal that the upward trend is likely to continue, after which upper resistance levels can be monitored.