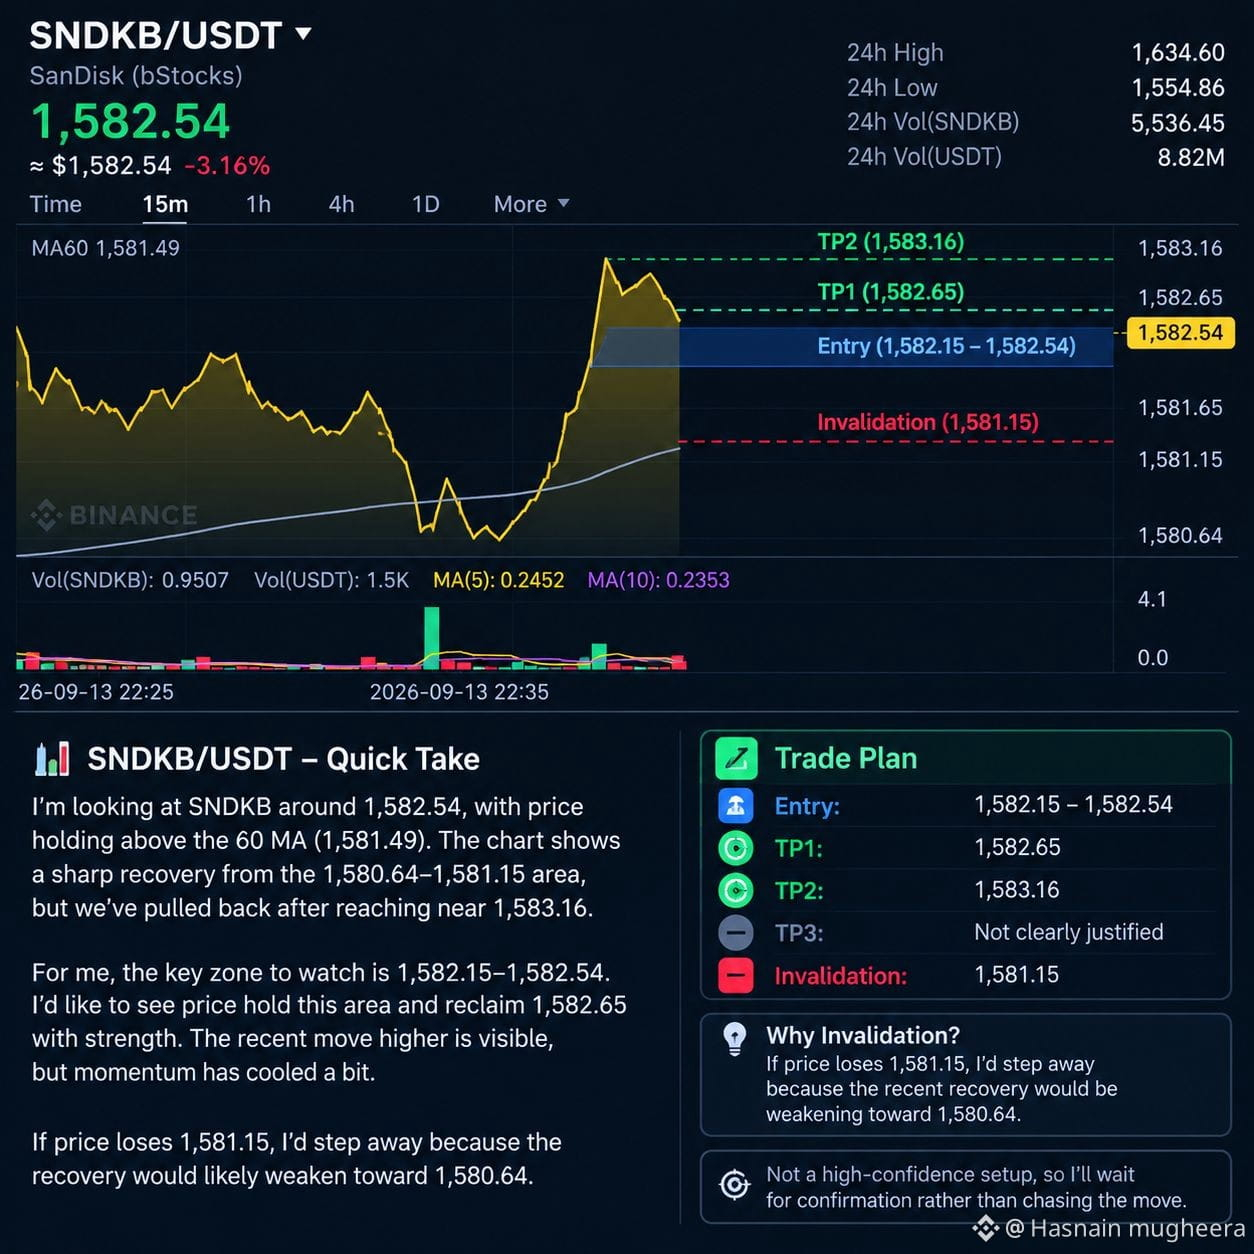
I’m looking at $SNDKB /USDT around 1,582.54, with price sitting above the visible MA60 at 1,581.49. The chart shows a sharp recovery from the 1,580.64–1,581.15 area, but price has pulled back after reaching near 1,583.16, so I’m staying cautious here.
For me, the key area is 1,582.15–1,582.54. I’d like to see price hold this zone and reclaim 1,582.65 with strength before considering the setup attractive. The recent move higher is visible, but momentum has cooled slightly at the current price.
📍 Entry: 1,582.15–1,582.54
🎯 TP1: 1,582.65
🎯 TP2: 1,583.16
🎯 TP3: Not clearly justified from the visible chart
🛑 Invalidation: 1,581.15
If price loses 1,581.15, I’d step away from this setup because the recent recovery would be weakening toward the lower visible area around 1,580.64.
I’m not seeing enough chart history here to call this a high-confidence setup, so I’d want confirmation rather than chasing the move.
For me, the key area is 1,582.15–1,582.54. I’d like to see price hold this zone and reclaim 1,582.65 with strength before considering the setup attractive. The recent move higher is visible, but momentum has cooled slightly at the current price.
📍 Entry: 1,582.15–1,582.54
🎯 TP1: 1,582.65
🎯 TP2: 1,583.16
🎯 TP3: Not clearly justified from the visible chart
🛑 Invalidation: 1,581.15
If price loses 1,581.15, I’d step away from this setup because the recent recovery would be weakening toward the lower visible area around 1,580.64.
I’m not seeing enough chart history here to call this a high-confidence setup, so I’d want confirmation rather than chasing the move.