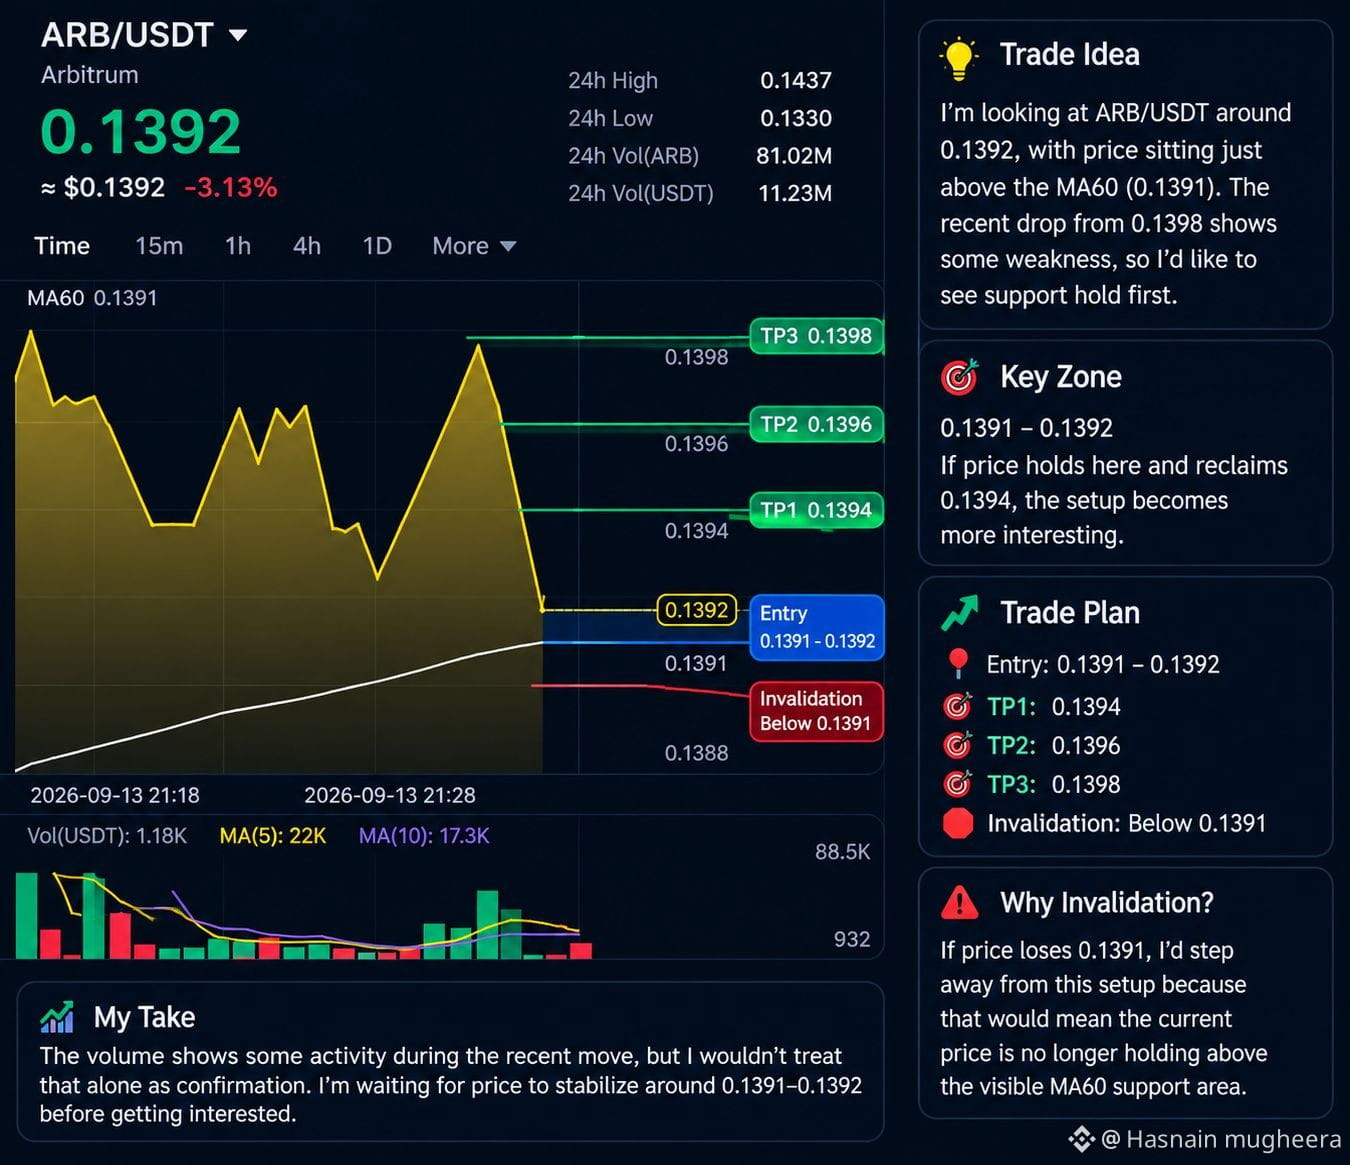
I’m looking at $ARB /USDT around 0.1392, with price sitting just above the visible MA60 at 0.1391. The short-term chart has pulled back sharply from the recent 0.1398 area, so I’d rather see support hold before considering a long.
For me, the key zone is 0.1391–0.1392. If price holds here and starts reclaiming the nearby 0.1394 area, the setup becomes more interesting. I’d want to see buyers regain momentum rather than chasing the current drop.
📍 Entry: 0.1391–0.1392
🎯 TP1: 0.1394
🎯 TP2: 0.1396
🎯 TP3: 0.1398
🛑 Invalidation: Below 0.1391
If price loses 0.1391, I’d step away from this setup because that would mean the current price is no longer holding above the visible MA60 support area.
The volume shown on the chart also suggests recent activity increased during the move, but I wouldn’t treat that alone as confirmation. I’m waiting for price to stabilize around 0.1391–0.1392 before getting interested.
For me, the key zone is 0.1391–0.1392. If price holds here and starts reclaiming the nearby 0.1394 area, the setup becomes more interesting. I’d want to see buyers regain momentum rather than chasing the current drop.
📍 Entry: 0.1391–0.1392
🎯 TP1: 0.1394
🎯 TP2: 0.1396
🎯 TP3: 0.1398
🛑 Invalidation: Below 0.1391
If price loses 0.1391, I’d step away from this setup because that would mean the current price is no longer holding above the visible MA60 support area.
The volume shown on the chart also suggests recent activity increased during the move, but I wouldn’t treat that alone as confirmation. I’m waiting for price to stabilize around 0.1391–0.1392 before getting interested.