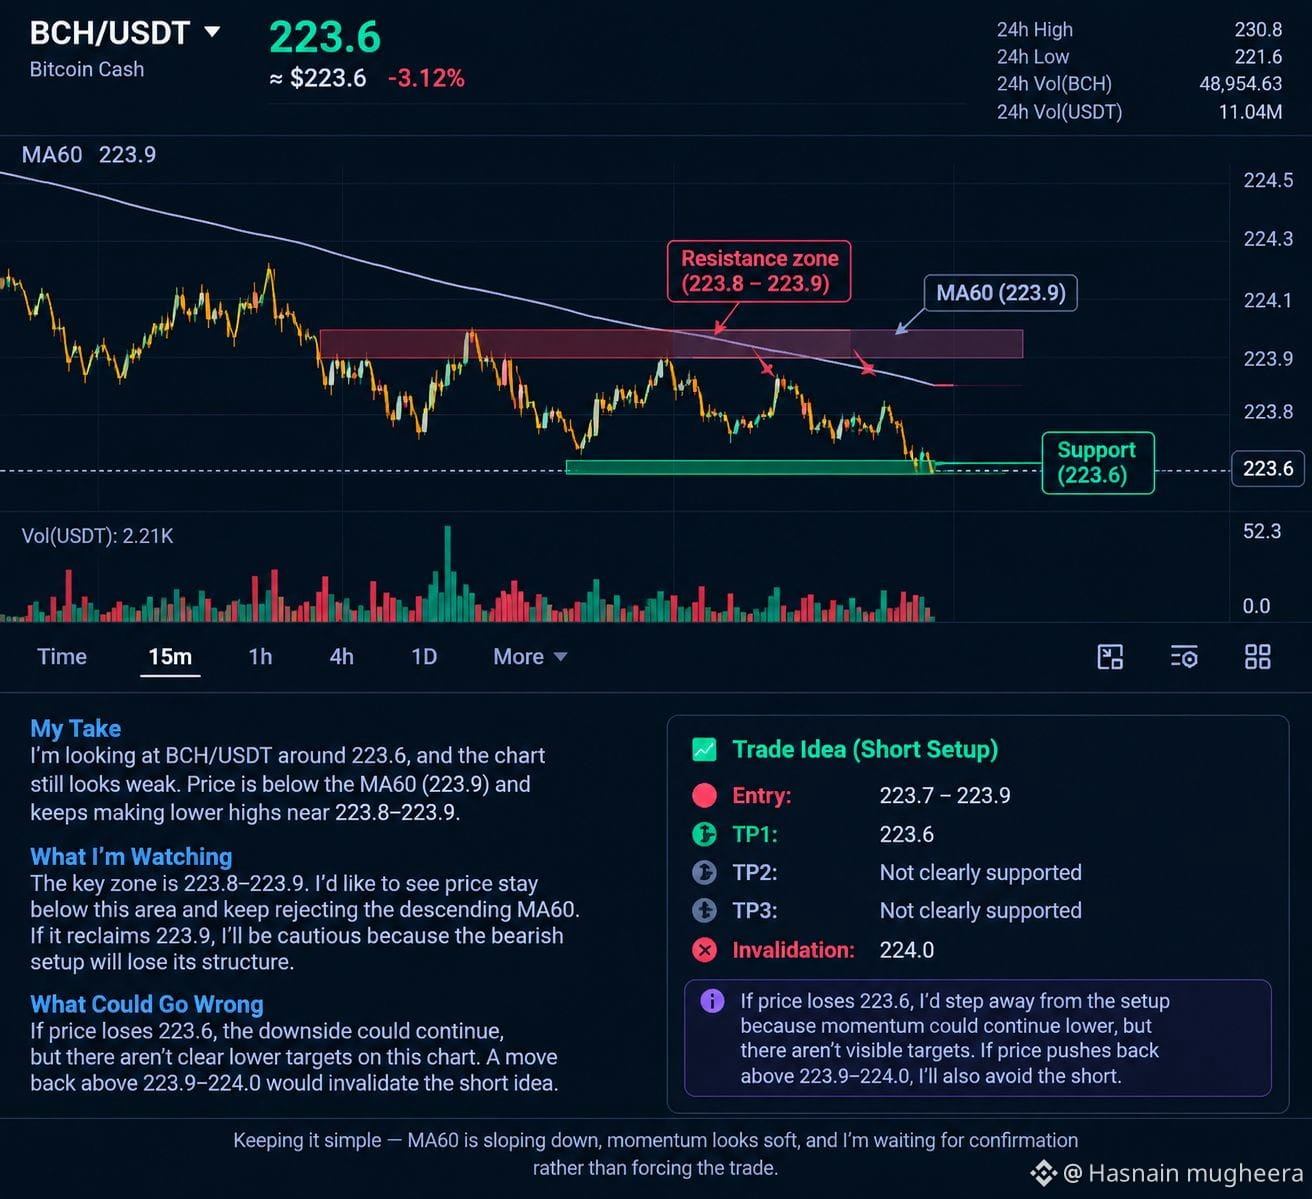
I’m looking at $BCH /USDT around 223.6, and the chart still looks weak to me. Price is sitting below the visible MA60 at 223.9, while the recent moves are making lower highs around the 223.8–223.9 area.
For me, the key zone is 223.8–223.9. I’d like to see price remain below this area and continue rejecting the descending MA60. If that happens, a short setup becomes more attractive. If BCH reclaims 223.9, I’d rather stay cautious because the bearish idea would be losing its structure.
📍 Entry: 223.7–223.9
🎯 TP1: 223.6
🎯 TP2: Not clearly supported by the visible chart
🎯 TP3: Not clearly supported by the visible chart
🛑 Invalidation: 224.0
If price loses 223.6, I’d watch for continuation, but I wouldn’t invent lower targets because they aren’t clearly visible on this screenshot. If price pushes back above 223.9–224.0, I’d step away from the short idea.
I’m keeping this one simple: the MA60 is sloping down, momentum looks soft, and I’m waiting for confirmation rather than forcing the trade.
For me, the key zone is 223.8–223.9. I’d like to see price remain below this area and continue rejecting the descending MA60. If that happens, a short setup becomes more attractive. If BCH reclaims 223.9, I’d rather stay cautious because the bearish idea would be losing its structure.
📍 Entry: 223.7–223.9
🎯 TP1: 223.6
🎯 TP2: Not clearly supported by the visible chart
🎯 TP3: Not clearly supported by the visible chart
🛑 Invalidation: 224.0
If price loses 223.6, I’d watch for continuation, but I wouldn’t invent lower targets because they aren’t clearly visible on this screenshot. If price pushes back above 223.9–224.0, I’d step away from the short idea.
I’m keeping this one simple: the MA60 is sloping down, momentum looks soft, and I’m waiting for confirmation rather than forcing the trade.