🚀 $LSK Token Analysis: A Web3 Survival Guide—or How to Spot a Classic Pump & Dump
If you are looking for the perfect example of insider market manipulation, these charts and metrics belong in trading textbooks.
Below is a breakdown of what is actually happening behind the scenes with this coin.
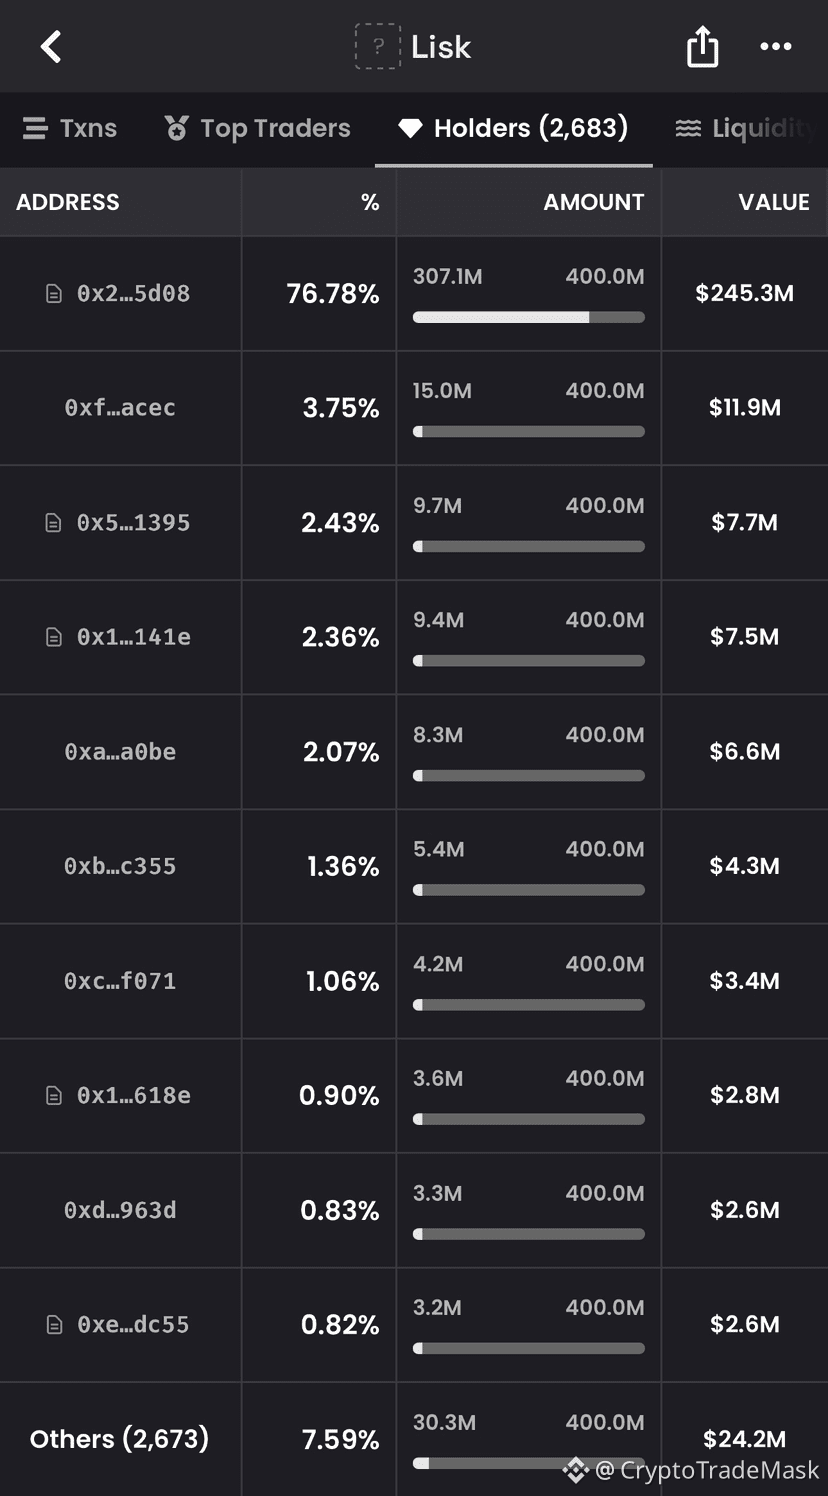
1️⃣ Token Concentration: A Monopoly in Few Hands
The Main Whale: A single wallet (0x2...5d08) holds 76.78% of the total supply (307.1M out of 400M LSK).
Top Holders: Over 90% of all tokens are controlled by fewer than 10 addresses.
What This Means: There is absolutely no decentralization here. Pricing is 100% controlled by a handful of individuals who could dump the market with the push of a button.
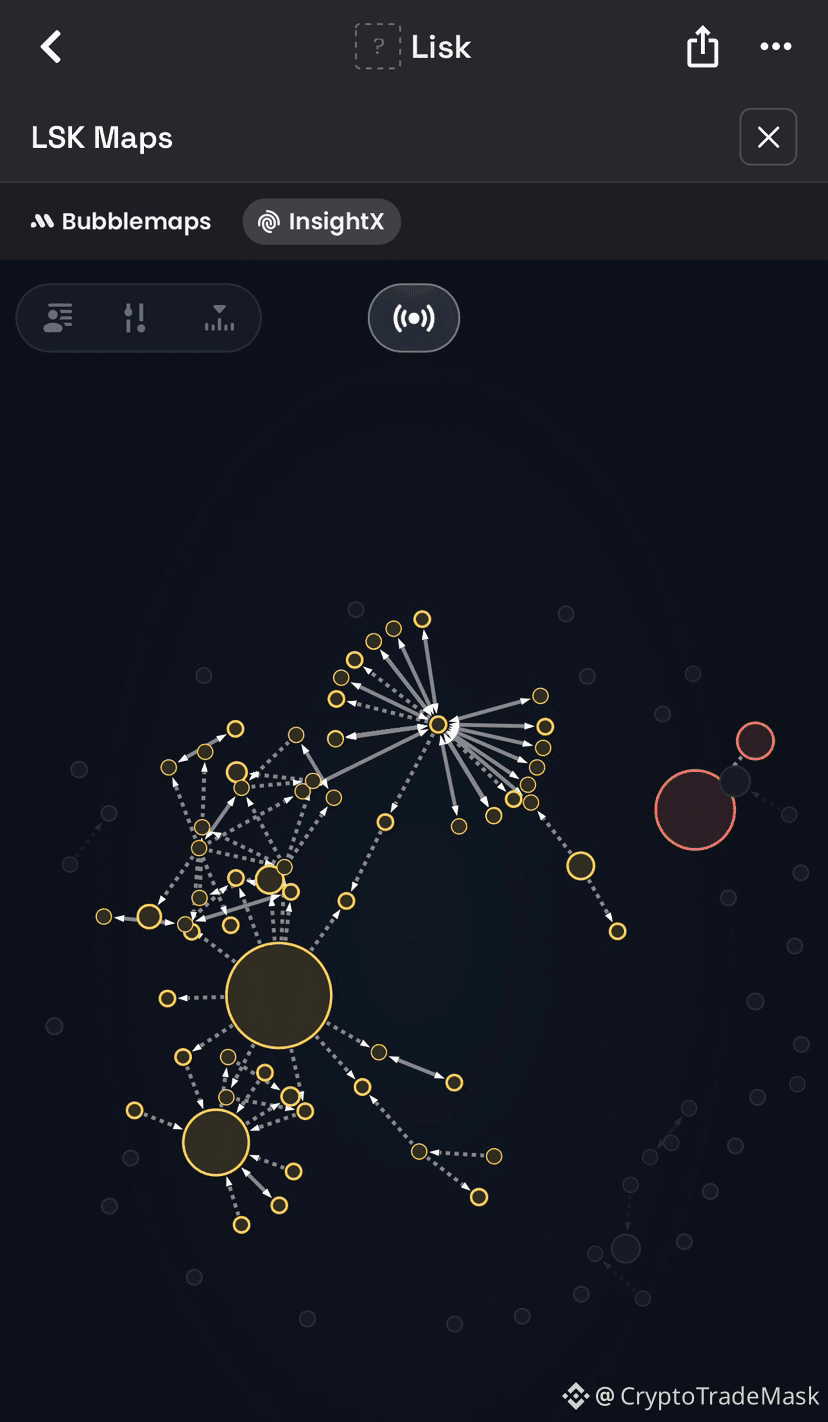
2️⃣ On-Chain Connections (Bubblemaps)
Cluster Network: The connection graph reveals a clear structure: tokens were distributed from a single central node to dozens of smaller, interconnected wallets.
The Reason: This is done artificially to create the illusion of a "distributed market" and simulate organic interest.
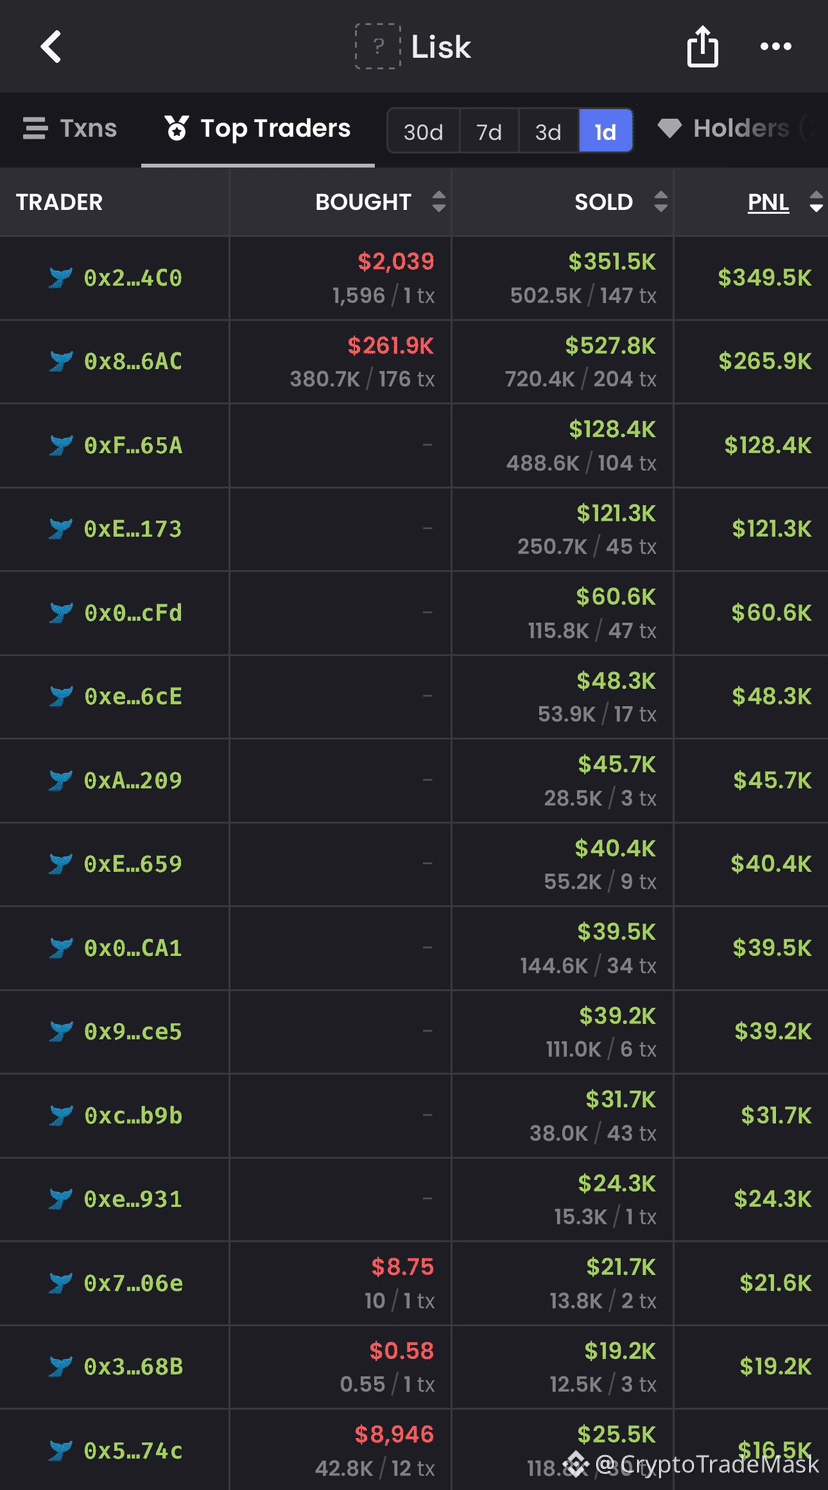
3️⃣ Insider Behavior (Top Traders' PnL)
Profits: Top traders realized hundreds of thousands of dollars in profit (ranging from $120K to over $350K each).
Entry Price: Note the "Bought" column—most of these wallets acquired tokens at $0 or for nominal amounts ($8, $2,000). The gist: These are developers or insiders who acquired tokens early and are now offloading their holdings onto retail buyers.
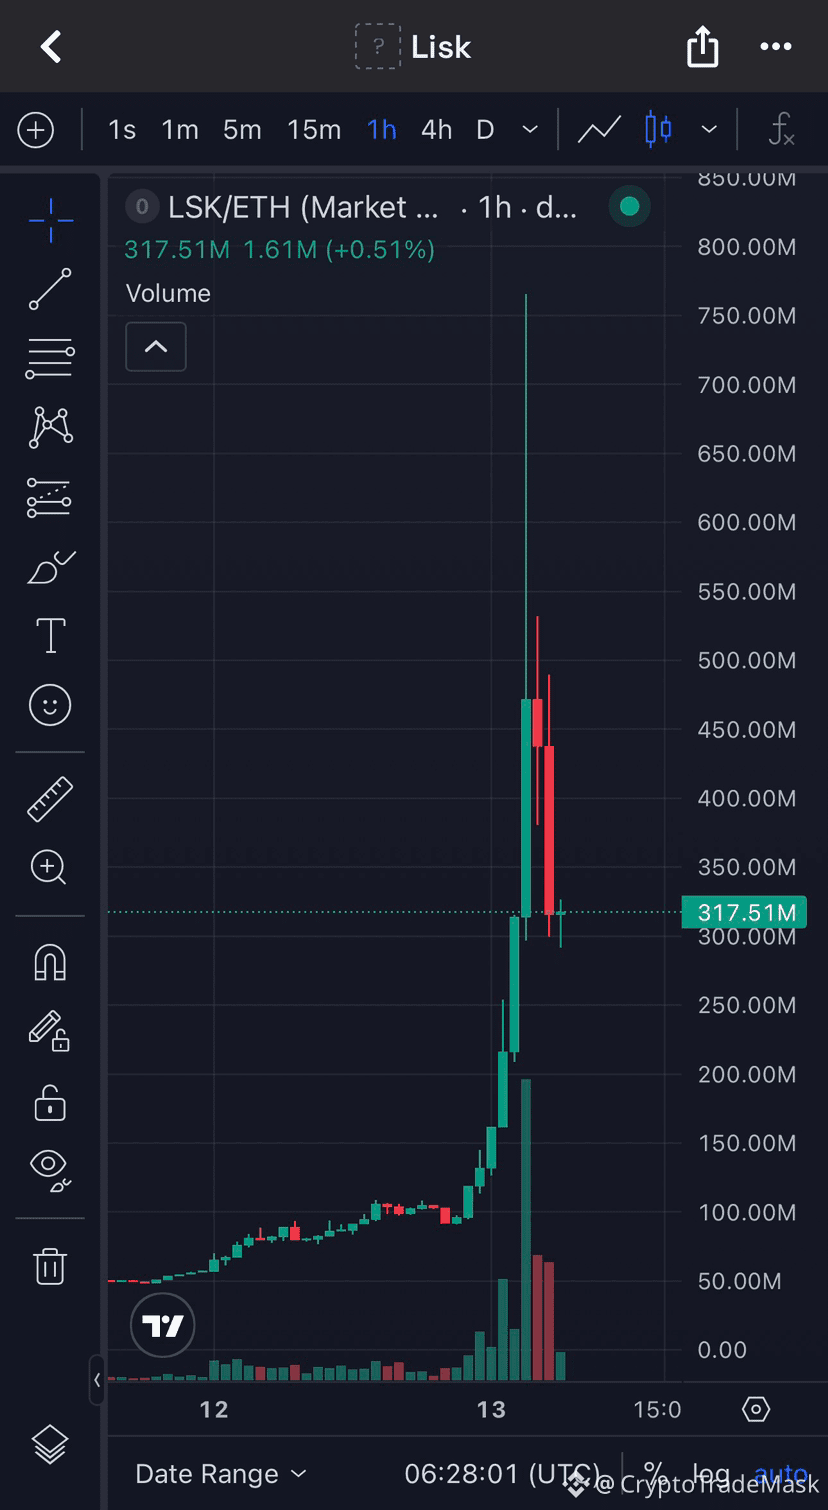
4️⃣ Technical Price Analysis (1h Chart)
Vertical spike: The price was sharply pushed up to the ~800M level on a burst of momentum, followed by an immediate reversal.
Red candles: Long upper wicks and high selling volumes indicate that buying power is completely exhausted. The price has already slumped to ~317.5M.
⚠️ Conclusion and Price Forecast
Outlook: Downtrend (Dump).
Since insiders have already secured the bulk of the profits and a single wallet controls three-quarters of the supply, the token is highly likely to continue falling toward the levels where the pump began.
If you are looking for the perfect example of insider market manipulation, these charts and metrics belong in trading textbooks.
Below is a breakdown of what is actually happening behind the scenes with this coin.
1️⃣ Token Concentration: A Monopoly in Few Hands
The Main Whale: A single wallet (0x2...5d08) holds 76.78% of the total supply (307.1M out of 400M LSK).
Top Holders: Over 90% of all tokens are controlled by fewer than 10 addresses.
What This Means: There is absolutely no decentralization here. Pricing is 100% controlled by a handful of individuals who could dump the market with the push of a button.
2️⃣ On-Chain Connections (Bubblemaps)
Cluster Network: The connection graph reveals a clear structure: tokens were distributed from a single central node to dozens of smaller, interconnected wallets.
The Reason: This is done artificially to create the illusion of a "distributed market" and simulate organic interest.
3️⃣ Insider Behavior (Top Traders' PnL)
Profits: Top traders realized hundreds of thousands of dollars in profit (ranging from $120K to over $350K each).
Entry Price: Note the "Bought" column—most of these wallets acquired tokens at $0 or for nominal amounts ($8, $2,000). The gist: These are developers or insiders who acquired tokens early and are now offloading their holdings onto retail buyers.
4️⃣ Technical Price Analysis (1h Chart)
Vertical spike: The price was sharply pushed up to the ~800M level on a burst of momentum, followed by an immediate reversal.
Red candles: Long upper wicks and high selling volumes indicate that buying power is completely exhausted. The price has already slumped to ~317.5M.
⚠️ Conclusion and Price Forecast
Outlook: Downtrend (Dump).
Since insiders have already secured the bulk of the profits and a single wallet controls three-quarters of the supply, the token is highly likely to continue falling toward the levels where the pump began.