How STON.fi DEX Volume, TVL and User Activity Should Be Compared
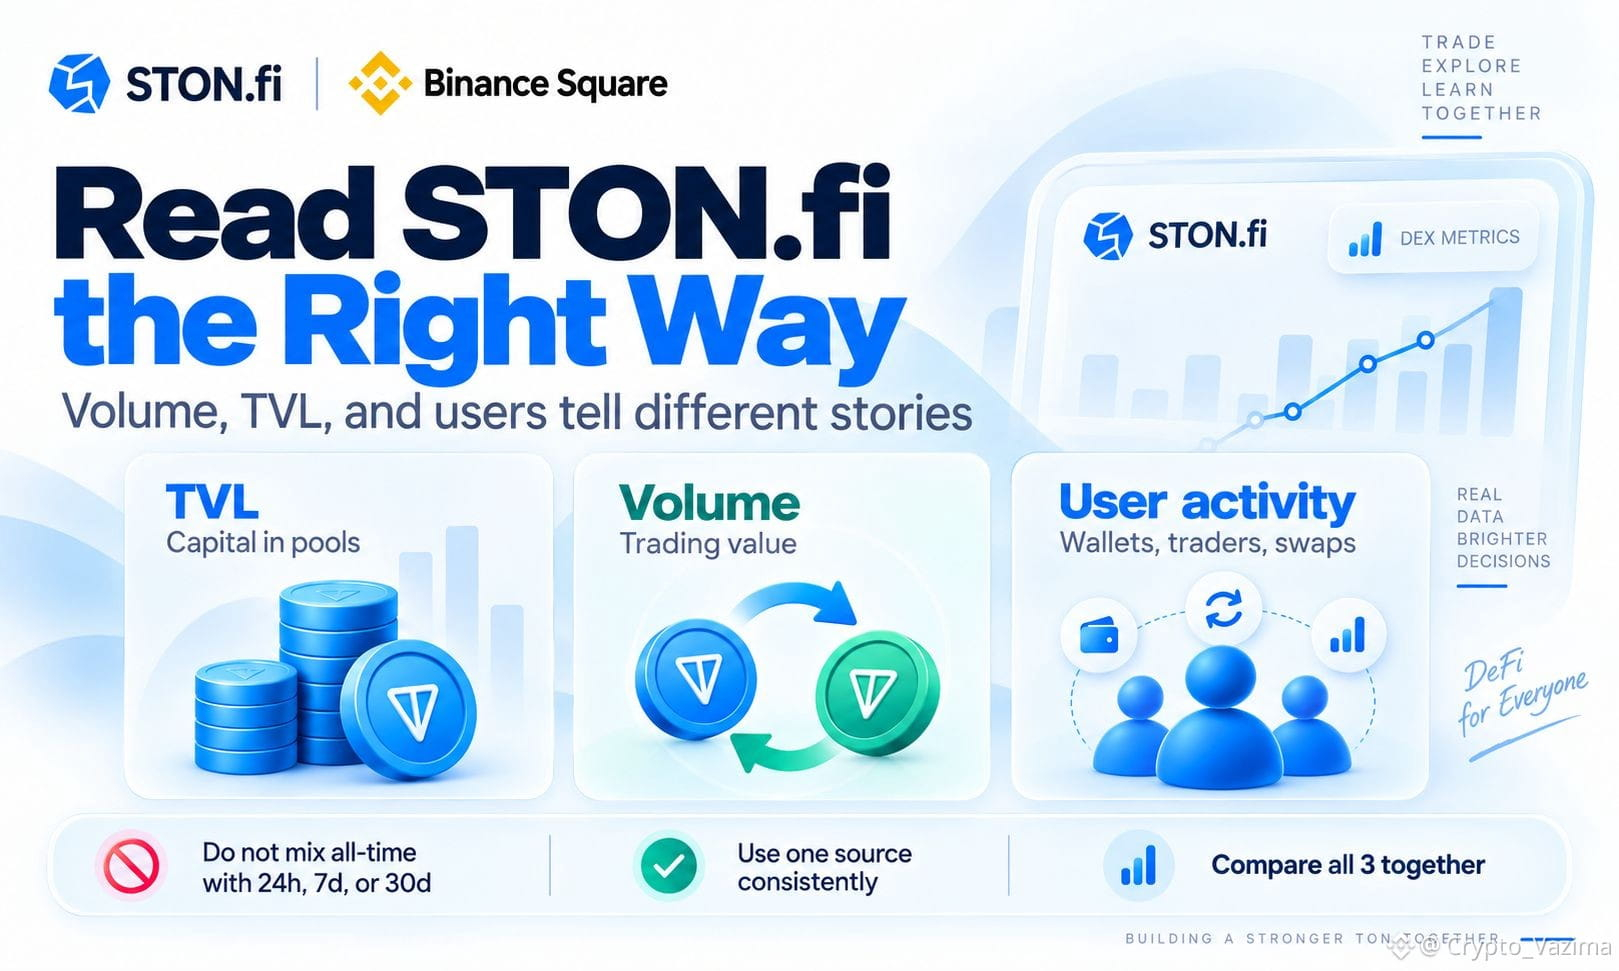
STON.fi DEX volume shows how much value is traded, TVL shows how much capital sits in the protocol, and user activity shows how broadly people interact. The useful signal is the relationship among all three, not a single leaderboard number.
🔥 What These STON.fi Numbers Actually Ask
- TVL answers how much value is deposited or available right now.
- DEX volume answers how much spot trading passed through a period.
- User activity answers how many wallets, swappers or trades showed up.
🚀 Why Matching Time Windows Matters
STON.fi headlines mix current TVL with all-time volume, swappers and swaps. DefiLlama on September 11 split the picture: about $25.13 million TVL, $1.93 million in 24-hour volume, $15.78 million in 7-day volume, $76.35 million in 30-day volume and $8.634 billion cumulative volume. Do not divide lifetime users by one day of volume.
🧠 Volume-to-TVL on STON.fi
$76.35 million of 30-day volume divided by $25.13 million TVL is about 3.0. That means STON.fi processed trading value equal to roughly three times its snapshot TVL in a month. High TVL with weak volume can mean idle capital. High volume with thinner TVL can mean liquidity is working harder.
⚡ A Clean Weekly Check
1. Pull TVL from one source and keep that source.
2. Log 24-hour, 7-day and 30-day volume together.
3. Add unique wallets or trades for the same dates.
4. If volume spikes, open the largest pools and ask whether one pair, a new token or a volatile move created the burst.
My take: STON.fi activity looks healthier when volume, users and TVL move in the same direction for more than one window. A one-day volume jump with flat users can just be larger wallets or concentrated pairs.
Would a 3.0 monthly turnover change how you judge STON.fi liquidity? 👇
Share the last STON.fi dashboard mismatch you noticed and how you handled it.
Not investment advice - research on your own! 🚀
$GRAM @STONfi DEX
STON.fi DEX volume shows how much value is traded, TVL shows how much capital sits in the protocol, and user activity shows how broadly people interact. The useful signal is the relationship among all three, not a single leaderboard number.
🔥 What These STON.fi Numbers Actually Ask
- TVL answers how much value is deposited or available right now.
- DEX volume answers how much spot trading passed through a period.
- User activity answers how many wallets, swappers or trades showed up.
🚀 Why Matching Time Windows Matters
STON.fi headlines mix current TVL with all-time volume, swappers and swaps. DefiLlama on September 11 split the picture: about $25.13 million TVL, $1.93 million in 24-hour volume, $15.78 million in 7-day volume, $76.35 million in 30-day volume and $8.634 billion cumulative volume. Do not divide lifetime users by one day of volume.
🧠 Volume-to-TVL on STON.fi
$76.35 million of 30-day volume divided by $25.13 million TVL is about 3.0. That means STON.fi processed trading value equal to roughly three times its snapshot TVL in a month. High TVL with weak volume can mean idle capital. High volume with thinner TVL can mean liquidity is working harder.
⚡ A Clean Weekly Check
1. Pull TVL from one source and keep that source.
2. Log 24-hour, 7-day and 30-day volume together.
3. Add unique wallets or trades for the same dates.
4. If volume spikes, open the largest pools and ask whether one pair, a new token or a volatile move created the burst.
My take: STON.fi activity looks healthier when volume, users and TVL move in the same direction for more than one window. A one-day volume jump with flat users can just be larger wallets or concentrated pairs.
Would a 3.0 monthly turnover change how you judge STON.fi liquidity? 👇
Share the last STON.fi dashboard mismatch you noticed and how you handled it.
Not investment advice - research on your own! 🚀
$GRAM @STONfi DEX