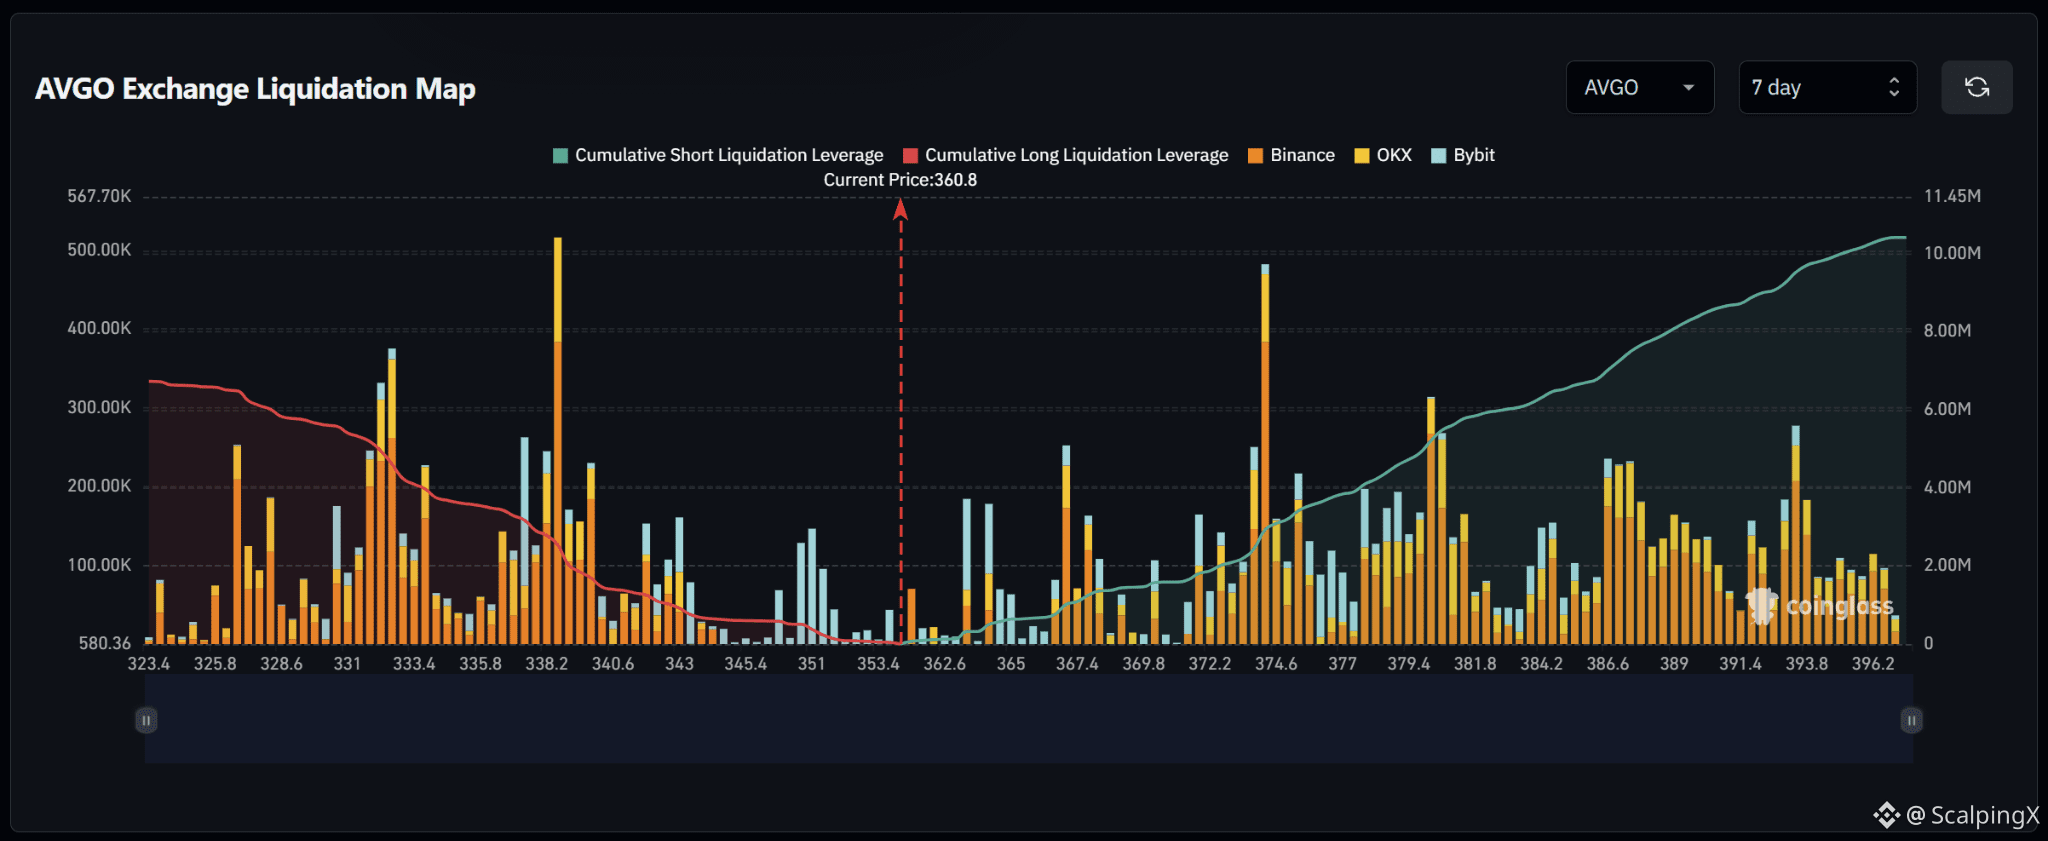
$AVGO – Liquidation Map (7 Days) – Current Price 360.8
🔎 The 7-day liquidation map shows roughly $10.2 million in short liquidations above the current price, exceeding approximately $6.5 million in long liquidations below. The liquidity structure therefore clearly favors the upside, with around 1.6 times more cumulative liquidity above the market.
📉 Below the market, nearby long-liquidation liquidity remains relatively thin around 353.4–351.0 before increasing across 343.0–338.2. The strongest downside cluster sits near 338.2 with a liquidation bar above $500,000, while the 331–333 area also contains a large cluster around $350,000–375,000. Losing 353.4 would shift attention toward 351.0–343.0.
📈 Above the market, short-liquidation liquidity begins building around 362.6–365.0 and becomes much denser across 367.4–381.8. The strongest cluster sits near 374.6 with a bar close to $480,000, while 379.4–381.8 also contains substantial liquidity. Further out, 386.6 and 393.8 hold additional clusters around $230,000–280,000.
🧭 The broader setup favors the upside because short-liquidation exposure above is roughly 1.6 times larger. Breaking 362.6 would increase the probability of a sweep toward 367.4–374.6, while losing 353.4 would shift attention toward 351.0–343.0.
🔎 The 7-day liquidation map shows roughly $10.2 million in short liquidations above the current price, exceeding approximately $6.5 million in long liquidations below. The liquidity structure therefore clearly favors the upside, with around 1.6 times more cumulative liquidity above the market.
📉 Below the market, nearby long-liquidation liquidity remains relatively thin around 353.4–351.0 before increasing across 343.0–338.2. The strongest downside cluster sits near 338.2 with a liquidation bar above $500,000, while the 331–333 area also contains a large cluster around $350,000–375,000. Losing 353.4 would shift attention toward 351.0–343.0.
📈 Above the market, short-liquidation liquidity begins building around 362.6–365.0 and becomes much denser across 367.4–381.8. The strongest cluster sits near 374.6 with a bar close to $480,000, while 379.4–381.8 also contains substantial liquidity. Further out, 386.6 and 393.8 hold additional clusters around $230,000–280,000.
🧭 The broader setup favors the upside because short-liquidation exposure above is roughly 1.6 times larger. Breaking 362.6 would increase the probability of a sweep toward 367.4–374.6, while losing 353.4 would shift attention toward 351.0–343.0.