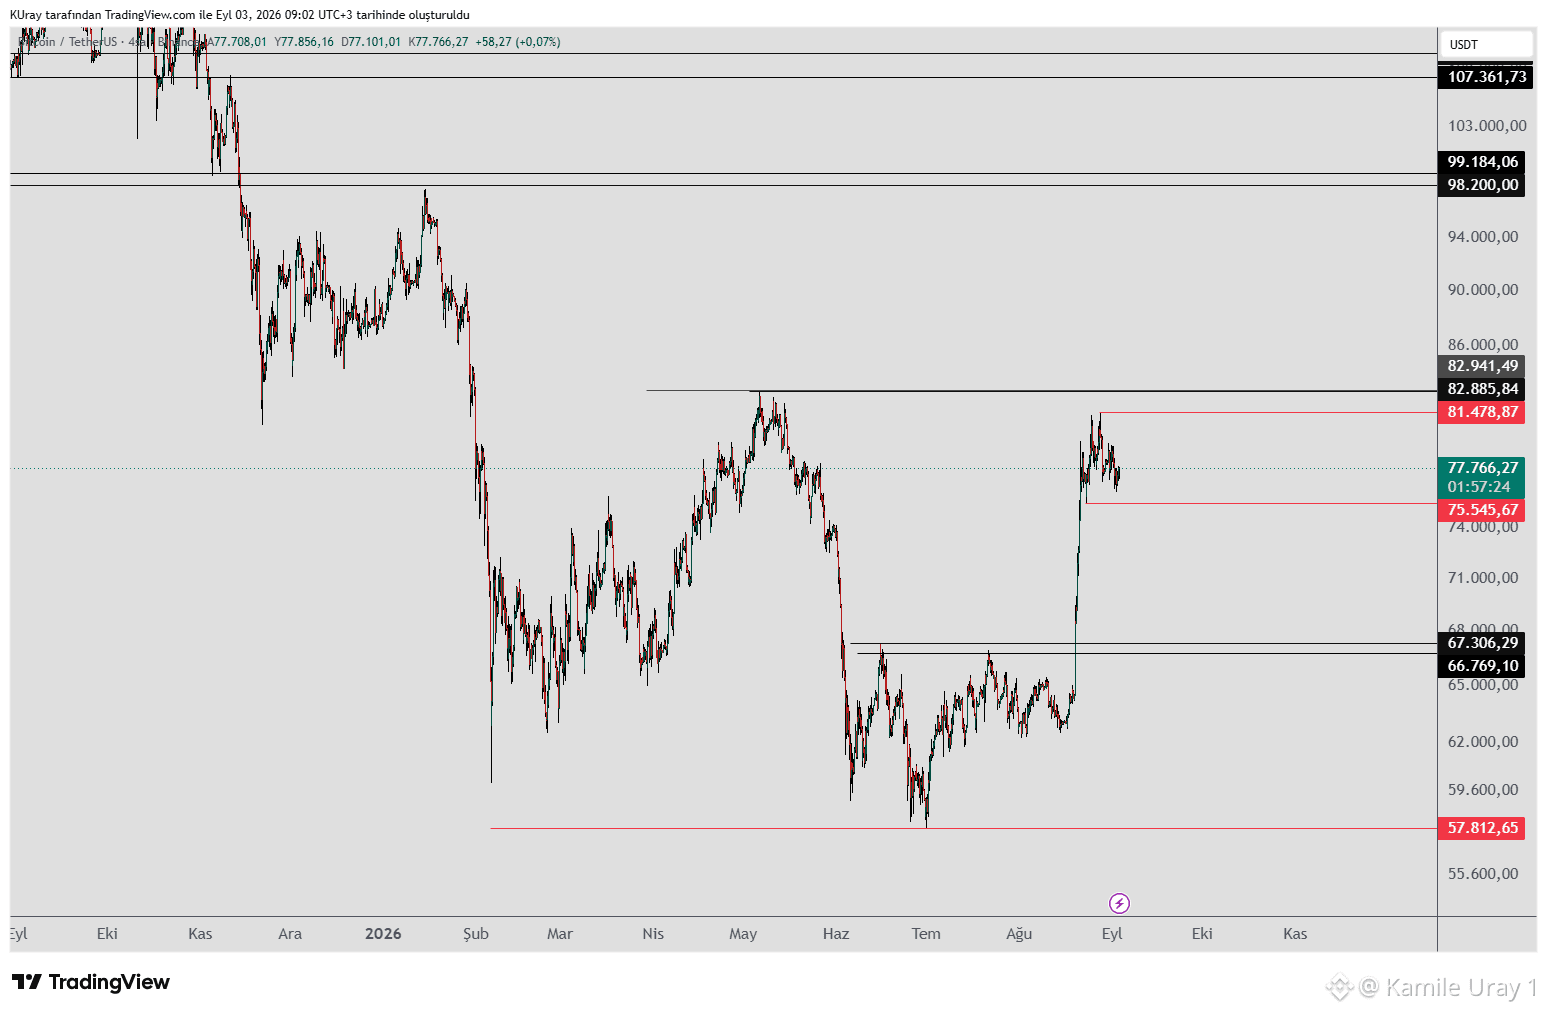
#BTC has been moving within the 81,478–75,545 range—a $6,000 spread—for the past eight days.
If the price closes below 75,545, there is a possibility of testing the support zone around 67,000–66,000. Such a decline could form the final shoulder of a potential Inverse Head and Shoulders (IH&S) pattern. Although a drop is anticipated, the potential for a larger bullish IH&S pattern is emerging; if the price holds above 83,000, the pattern would activate, and a continued rise toward upper resistance levels would be expected.
If daily and weekly closes occur above 82,885, it would mark the first higher high relative to the most recent downward wave, providing another positive signal that the upward trend is likely to continue.
If the price closes below 75,545, there is a possibility of testing the support zone around 67,000–66,000. Such a decline could form the final shoulder of a potential Inverse Head and Shoulders (IH&S) pattern. Although a drop is anticipated, the potential for a larger bullish IH&S pattern is emerging; if the price holds above 83,000, the pattern would activate, and a continued rise toward upper resistance levels would be expected.
If daily and weekly closes occur above 82,885, it would mark the first higher high relative to the most recent downward wave, providing another positive signal that the upward trend is likely to continue.