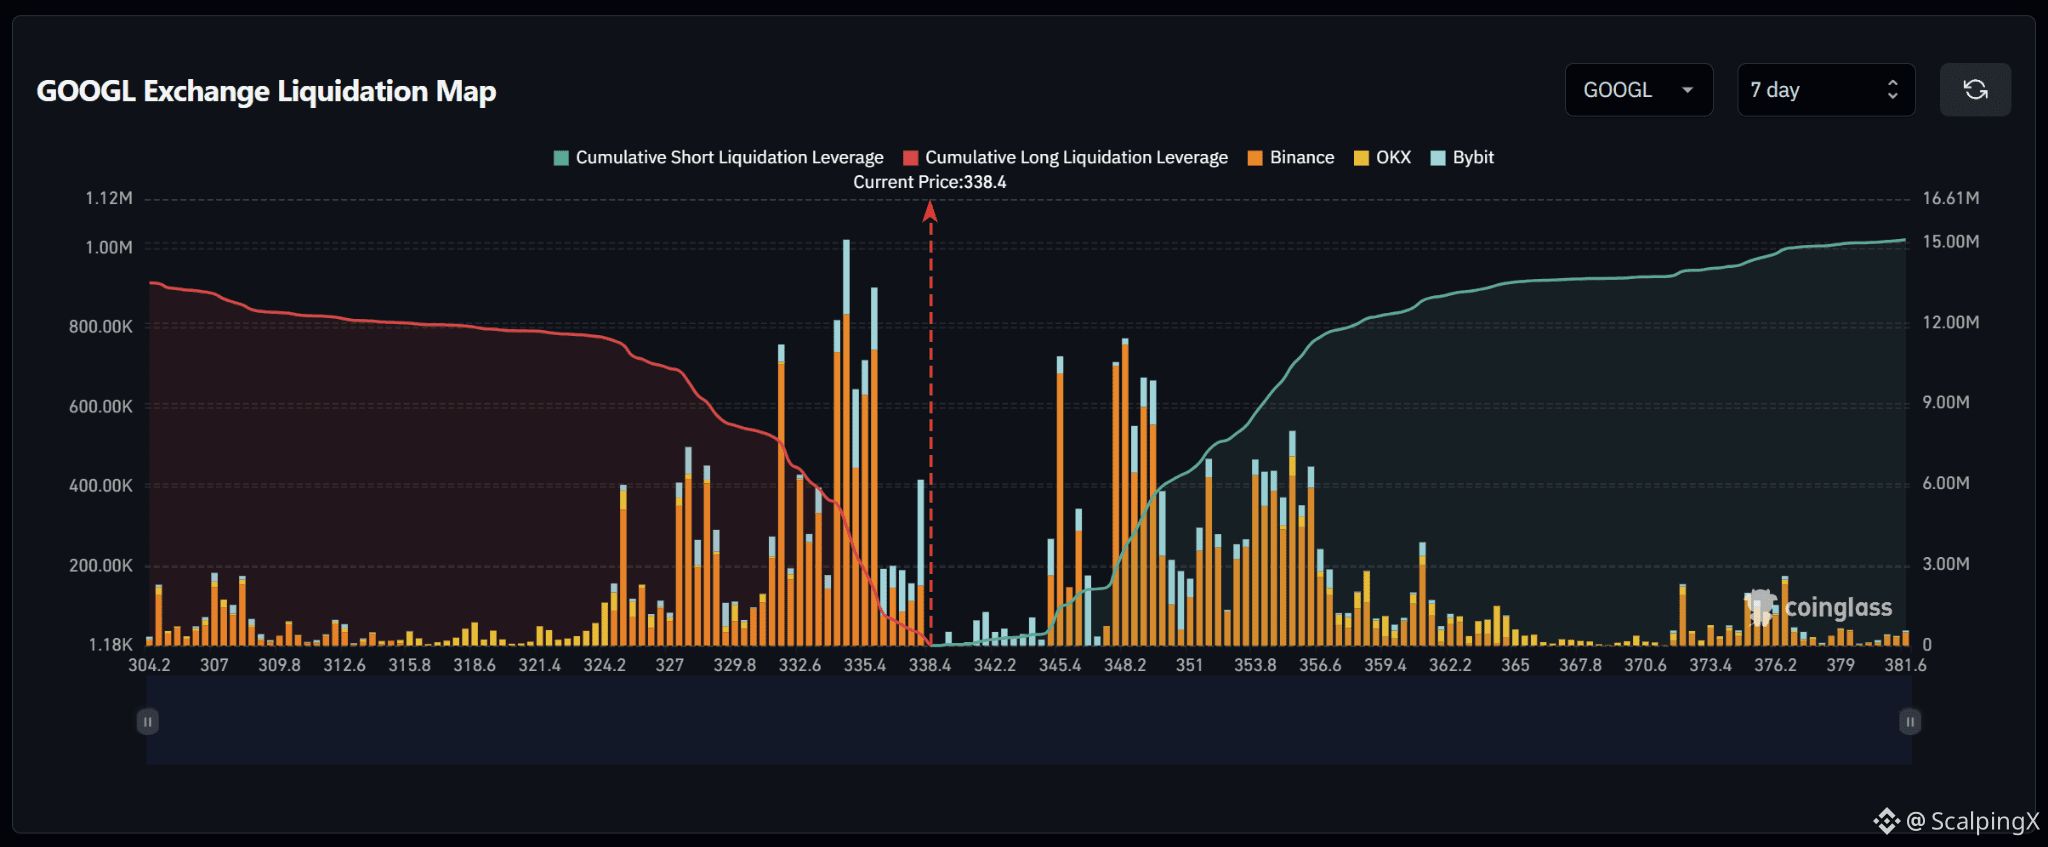
$GOOGL – Liquidation Map (7 Days) – Current Price 338.4
🔎 The 7-day liquidation map shows roughly $15 million in short liquidations above the current price, slightly exceeding approximately $13 million in long liquidations below. The overall structure is therefore fairly balanced but modestly tilted to the upside, with about 1.15 times more cumulative liquidity above the market.
📉 Below the market, long-liquidation liquidity is concentrated heavily around 335.4–332.6. The strongest clusters sit near 335.4 and 334.0, where liquidation bars approach $900,000–1 million, while 332.6 also contains notable liquidity. Losing 335.4 would increase the probability of a sweep toward 334.0–332.6.
📈 Above the market, liquidity remains relatively thin between 338.4 and 342.2 before short-liquidation exposure increases sharply from 345.4. Strong clusters appear around 345.4 and 348.2–351.0, with several bars reaching roughly $600,000–800,000. A break above 342.2 would bring 345.4–348.2 into focus next.
🧭 The broader setup modestly favors the upside because short-liquidation exposure above is larger. Breaking 342.2 would increase the probability of a sweep toward 345.4–348.2, while losing 335.4 would shift attention toward 334.0–332.6.
#LiquidationMap
🔎 The 7-day liquidation map shows roughly $15 million in short liquidations above the current price, slightly exceeding approximately $13 million in long liquidations below. The overall structure is therefore fairly balanced but modestly tilted to the upside, with about 1.15 times more cumulative liquidity above the market.
📉 Below the market, long-liquidation liquidity is concentrated heavily around 335.4–332.6. The strongest clusters sit near 335.4 and 334.0, where liquidation bars approach $900,000–1 million, while 332.6 also contains notable liquidity. Losing 335.4 would increase the probability of a sweep toward 334.0–332.6.
📈 Above the market, liquidity remains relatively thin between 338.4 and 342.2 before short-liquidation exposure increases sharply from 345.4. Strong clusters appear around 345.4 and 348.2–351.0, with several bars reaching roughly $600,000–800,000. A break above 342.2 would bring 345.4–348.2 into focus next.
🧭 The broader setup modestly favors the upside because short-liquidation exposure above is larger. Breaking 342.2 would increase the probability of a sweep toward 345.4–348.2, while losing 335.4 would shift attention toward 334.0–332.6.
#LiquidationMap