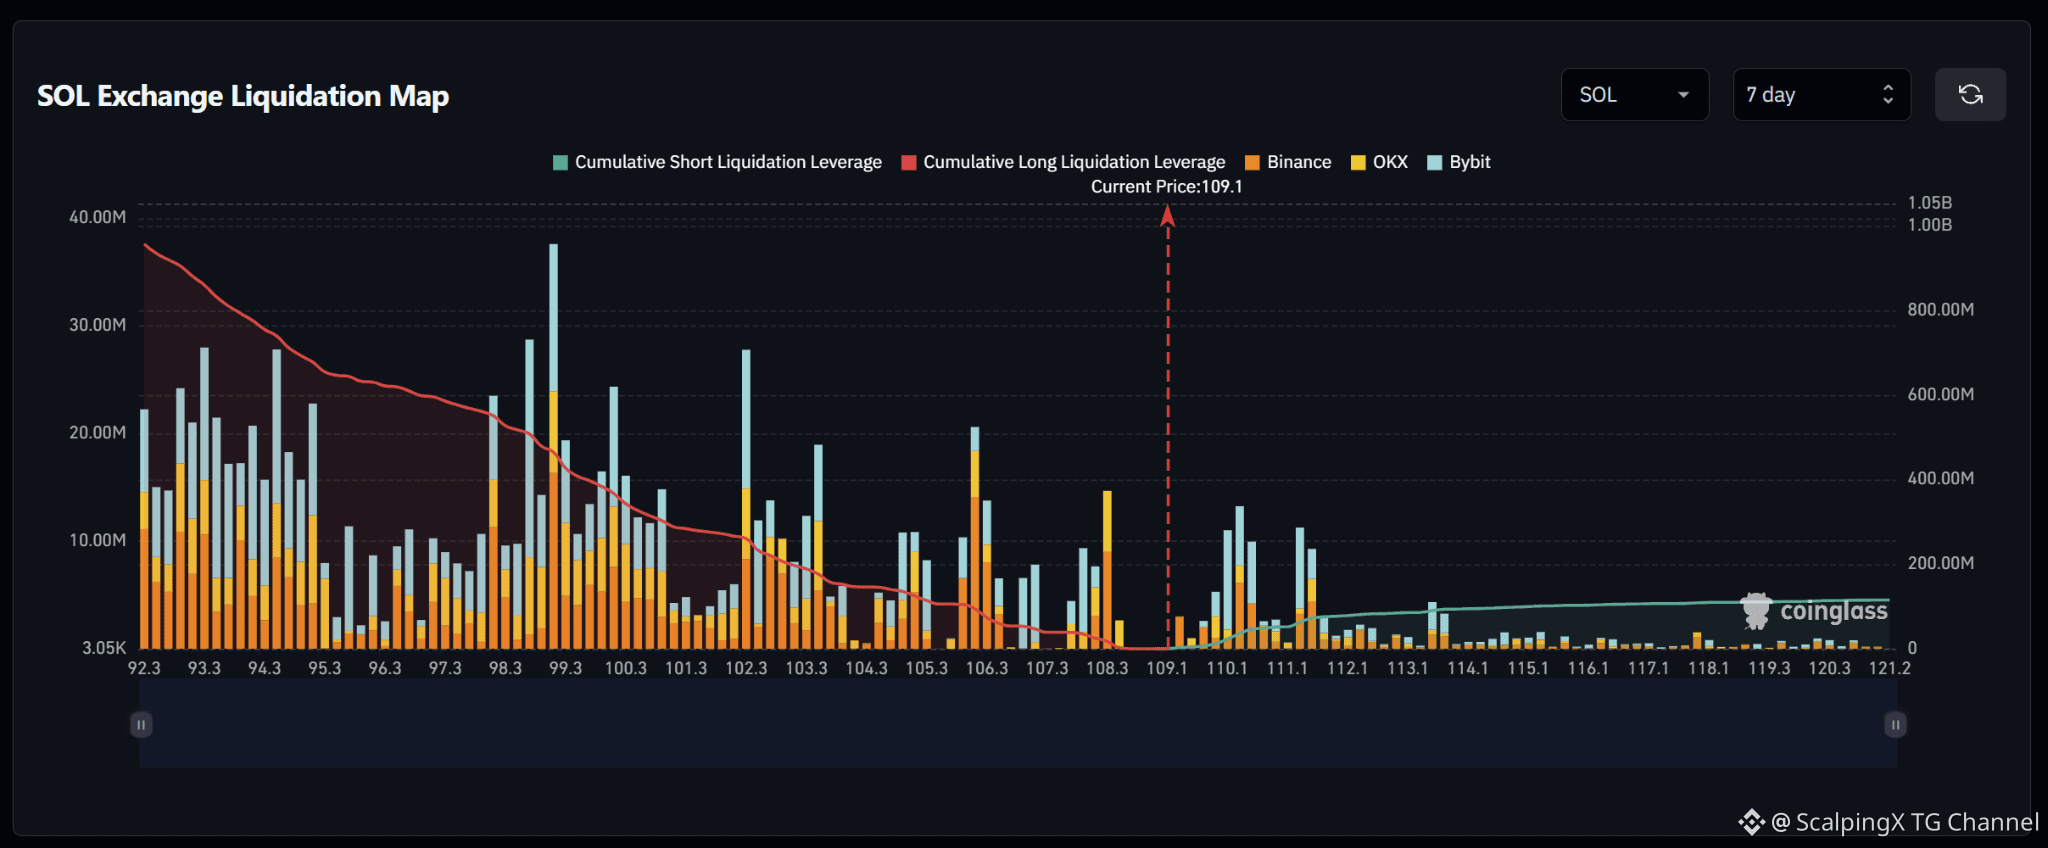
$SOL – Liquidation Map (7 Days) – Current Price 109.1 🔎 The 7-day liquidation map shows roughly $950 million in long liquidations below the current price, far exceeding approximately $110 million in short liquidations above. The liquidity structure therefore leans very heavily to the downside, with roughly 8–9 times more cumulative liquidity sitting below the market. 📉 Below the market, nearby long-liquidation liquidity is concentrated around 108.3–106.3 before increasing across 103.3–102.3. Larger clusters sit deeper around 100.3–98.3, with the 99.3 area standing out as one of the largest liquidation concentrations on the map. Losing 108.3 would increase the probability of a sweep toward 107.3–106.3. 📈 Above the market, short-liquidation liquidity begins building around 110.1 and is concentrated mainly across 110.1–111.1. Further out, liquidity remains around 112.1–113.1 but thins considerably, while levels above 114 are relatively sparse. A break above 110.1 would bring 111.1–112.1 into focus. 🧭 The broader setup strongly favors the downside because long-liquidation exposure below is roughly 8–9 times larger. Losing 108.3 would strengthen the probability of a sweep toward 107.3–106.3, while breaking above 110.1 would shift attention toward a short-liquidation sweep across 111.1–112.1. #LiquidationMap

投稿