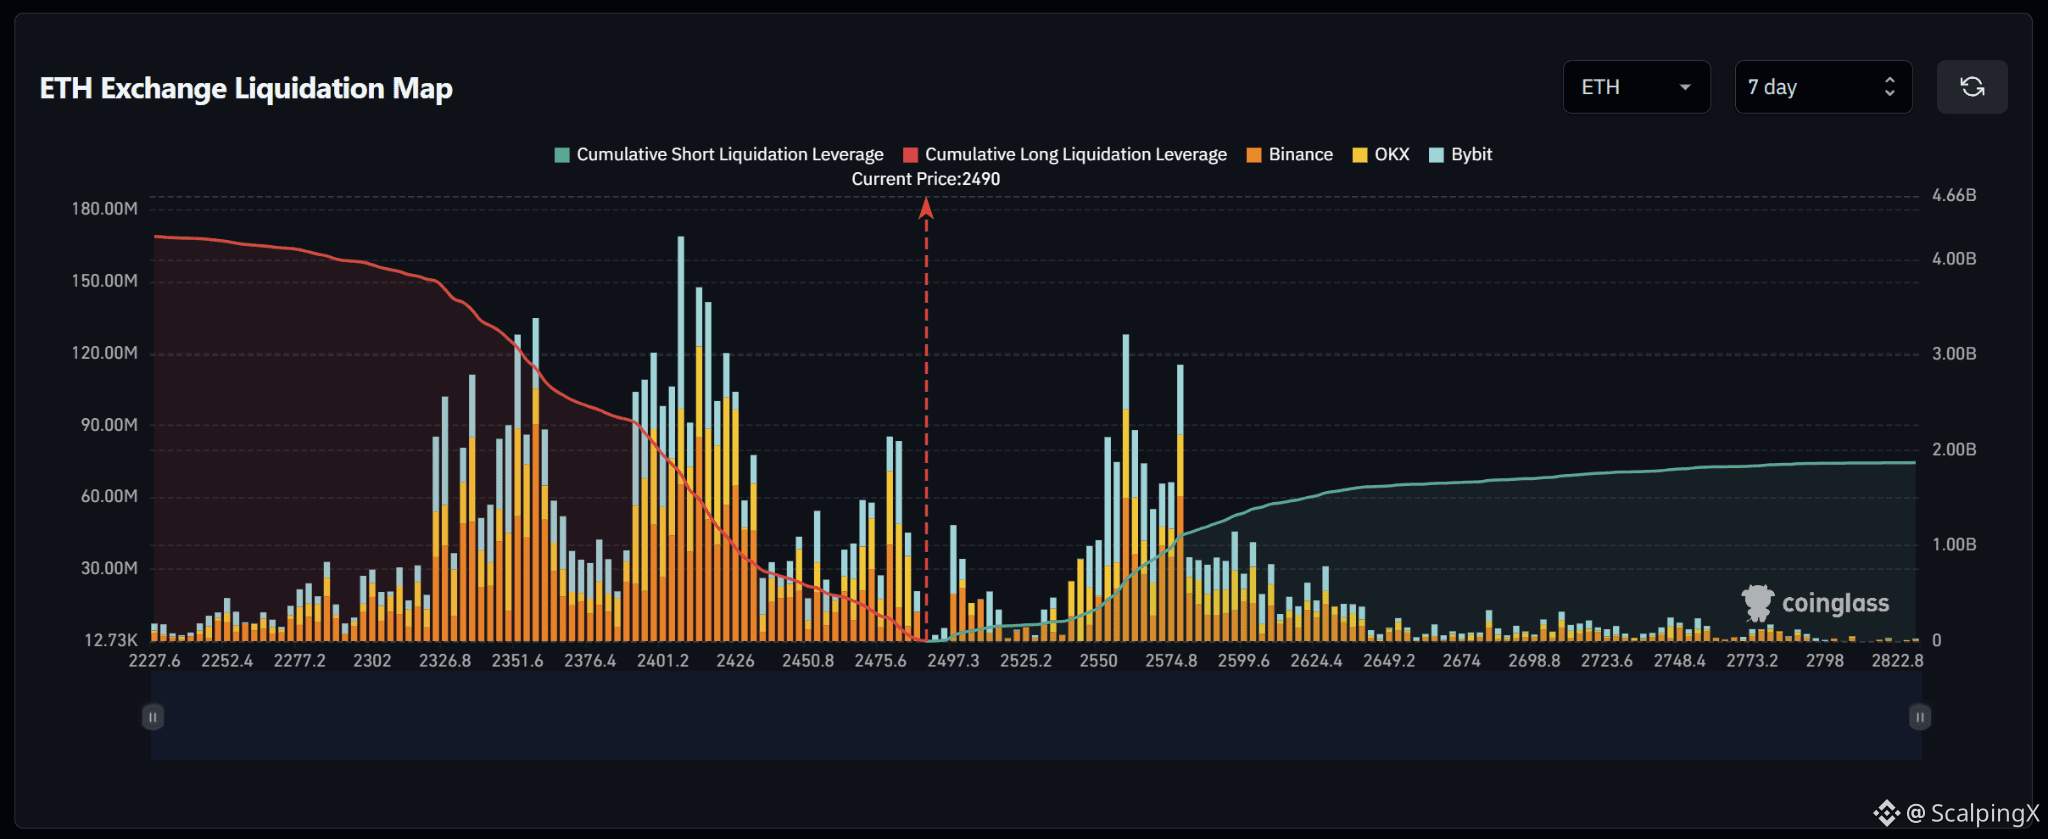
$ETH – Liquidation Map (7 Days) – Current Price 2,490
🔎 The 7-day liquidation map shows roughly $4.1–4.2 billion in long liquidations below the current price, significantly exceeding approximately $1.9 billion in short liquidations above. The liquidity structure therefore clearly favors the downside, with roughly 2.2 times more cumulative liquidity sitting below the market.
📉 Below the market, nearby long-liquidation liquidity is concentrated around 2,475–2,451 before increasing sharply across 2,426–2,401. The strongest nearby concentration sits around 2,401–2,426, while deeper liquidity also remains substantial across 2,352–2,327. Losing 2,475 would increase the probability of a sweep toward 2,451–2,426.
📈 Above the market, short-liquidation liquidity begins building around 2,497–2,525 and becomes much denser across 2,550–2,575. This is the strongest nearby upside cluster, with major liquidation bars around 2,550 and 2,575. A break above 2,497 would bring 2,525–2,550 into focus first.
🧭 The broader setup favors the downside because long-liquidation exposure below is roughly 2.2 times larger. Losing 2,475 would strengthen the probability of a sweep toward 2,451–2,426, while breaking above 2,497 would shift attention toward a short-liquidation sweep across 2,525–2,575.
#LiquidationMap
🔎 The 7-day liquidation map shows roughly $4.1–4.2 billion in long liquidations below the current price, significantly exceeding approximately $1.9 billion in short liquidations above. The liquidity structure therefore clearly favors the downside, with roughly 2.2 times more cumulative liquidity sitting below the market.
📉 Below the market, nearby long-liquidation liquidity is concentrated around 2,475–2,451 before increasing sharply across 2,426–2,401. The strongest nearby concentration sits around 2,401–2,426, while deeper liquidity also remains substantial across 2,352–2,327. Losing 2,475 would increase the probability of a sweep toward 2,451–2,426.
📈 Above the market, short-liquidation liquidity begins building around 2,497–2,525 and becomes much denser across 2,550–2,575. This is the strongest nearby upside cluster, with major liquidation bars around 2,550 and 2,575. A break above 2,497 would bring 2,525–2,550 into focus first.
🧭 The broader setup favors the downside because long-liquidation exposure below is roughly 2.2 times larger. Losing 2,475 would strengthen the probability of a sweep toward 2,451–2,426, while breaking above 2,497 would shift attention toward a short-liquidation sweep across 2,525–2,575.
#LiquidationMap