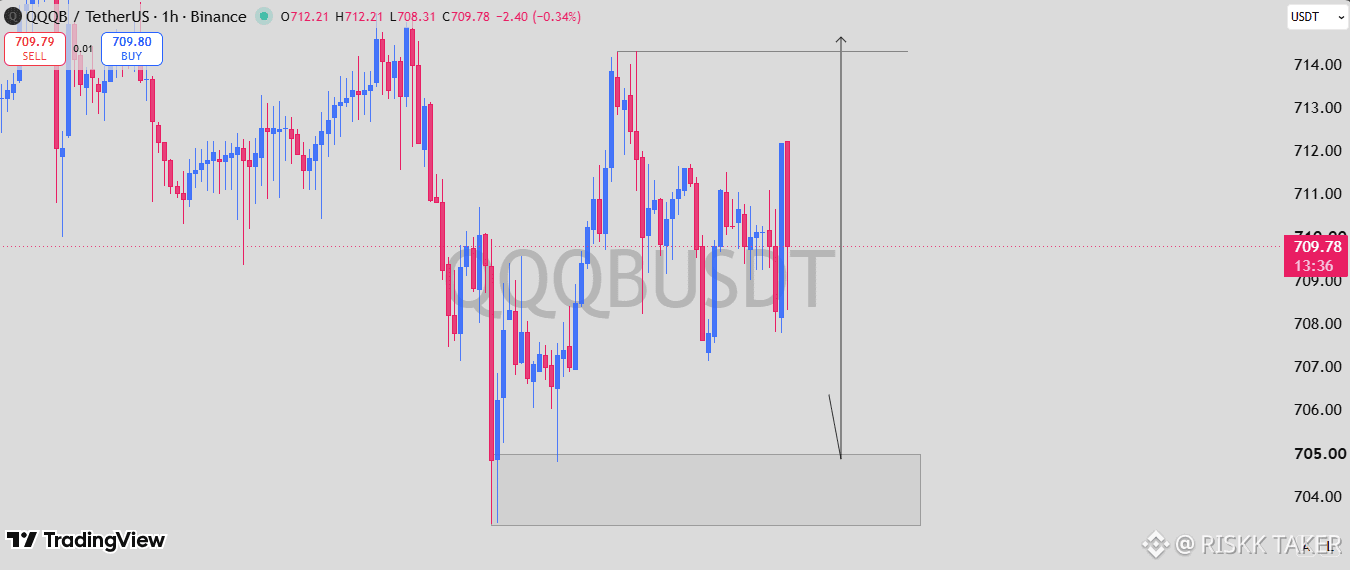
The latest $QQQB /USDT 1H structure is setting up an interesting bearish scenario, with price currently around $709.78. After recovering from the $705 region, QQQB has entered a period of choppy consolidation, but the recovery has not been strong enough to establish a clear bullish continuation. Price continues to encounter resistance around $711–$712, while the major resistance zone on the chart is positioned around $714–$714.5.
This area is important because a previous attempt toward the upper region was rejected, sending price sharply lower. The current structure suggests sellers could once again defend the higher levels if #QQQB fails to break through with convincing momentum. The projected path on the chart points toward a retest of the $705 demand zone, making this the primary downside objective.
A sustained move below $708–$709 would provide stronger confirmation of the bearish scenario and could accelerate the move toward $705. However, traders should remain aware that a decisive 1H breakout above $714 would invalidate the immediate bearish projection and could signal a broader recovery. Until that breakout occurs, the chart remains tilted toward a potential downside retest of the $705 zone. #bullish
This area is important because a previous attempt toward the upper region was rejected, sending price sharply lower. The current structure suggests sellers could once again defend the higher levels if #QQQB fails to break through with convincing momentum. The projected path on the chart points toward a retest of the $705 demand zone, making this the primary downside objective.
A sustained move below $708–$709 would provide stronger confirmation of the bearish scenario and could accelerate the move toward $705. However, traders should remain aware that a decisive 1H breakout above $714 would invalidate the immediate bearish projection and could signal a broader recovery. Until that breakout occurs, the chart remains tilted toward a potential downside retest of the $705 zone. #bullish