


At first I thought this was going to be a pretty simple question.
Was Bitcoin’s move mostly spot demand, or was it just another huge short squeeze?
Turns out it was both.
Just not at the same time.
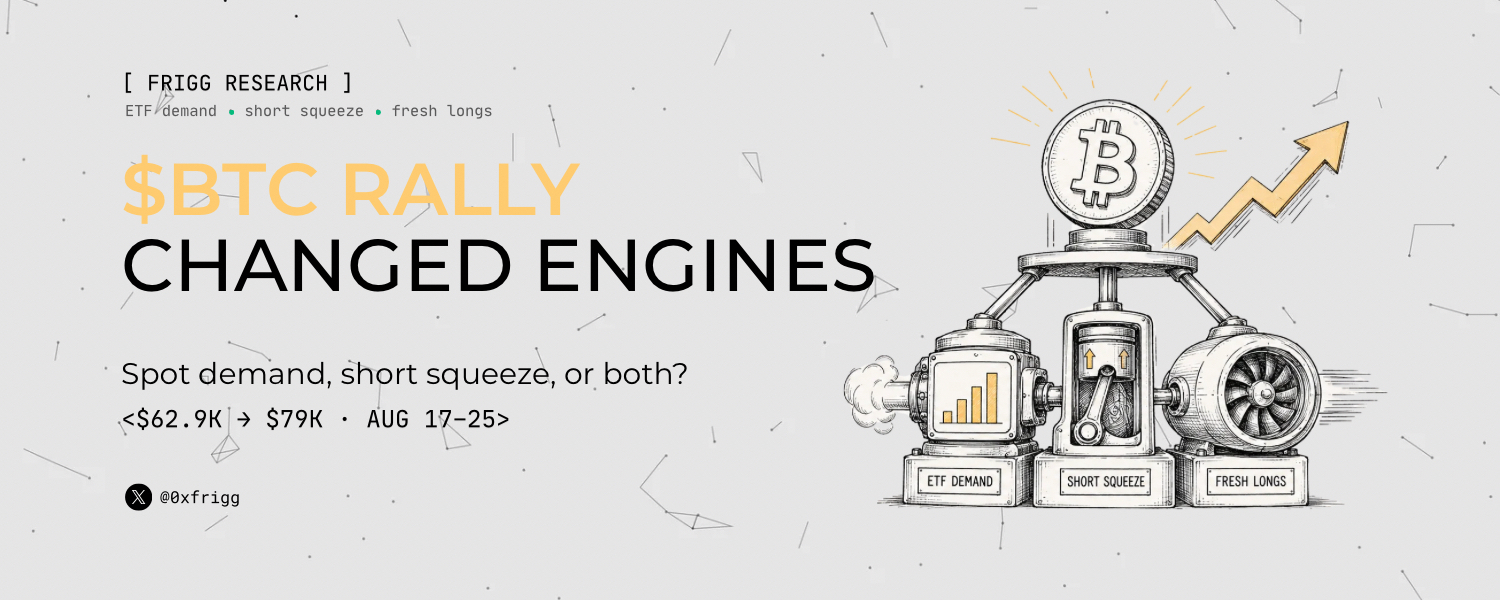
$BTC went from roughly $63K on August 17 to almost $79K by August 25, a move of around 25%. But looking at the rally as one continuous trade misses what actually happened underneath.
The buyer changed.
The positioning changed.
And eventually, even the side carrying the liquidation risk changed.
That’s the part I found interesting.
The rally had already started before the headline
August 19 gets most of the attention because that was when the Treasury buyback announcement hit and BTC really accelerated.
But there was already demand underneath the market before that.
U.S. spot BTC ETFs recorded around $297.5M of net inflows on August 17 and another $189.3M on August 18.
So roughly $487M came in across the two sessions before the big breakout.
Funding was also relatively calm compared with what came later. On August 18, standard funding closed around 0.0016.
That doesn’t look like a market where everyone was already aggressively chasing the move with leverage.
I read that as a decent spot-demand base forming before the catalyst arrived. Not proof that ETFs caused the breakout, but enough to say Bitcoin wasn’t starting from zero when the headlines hit.
Then August 19 happened.
August 19 changed the speed
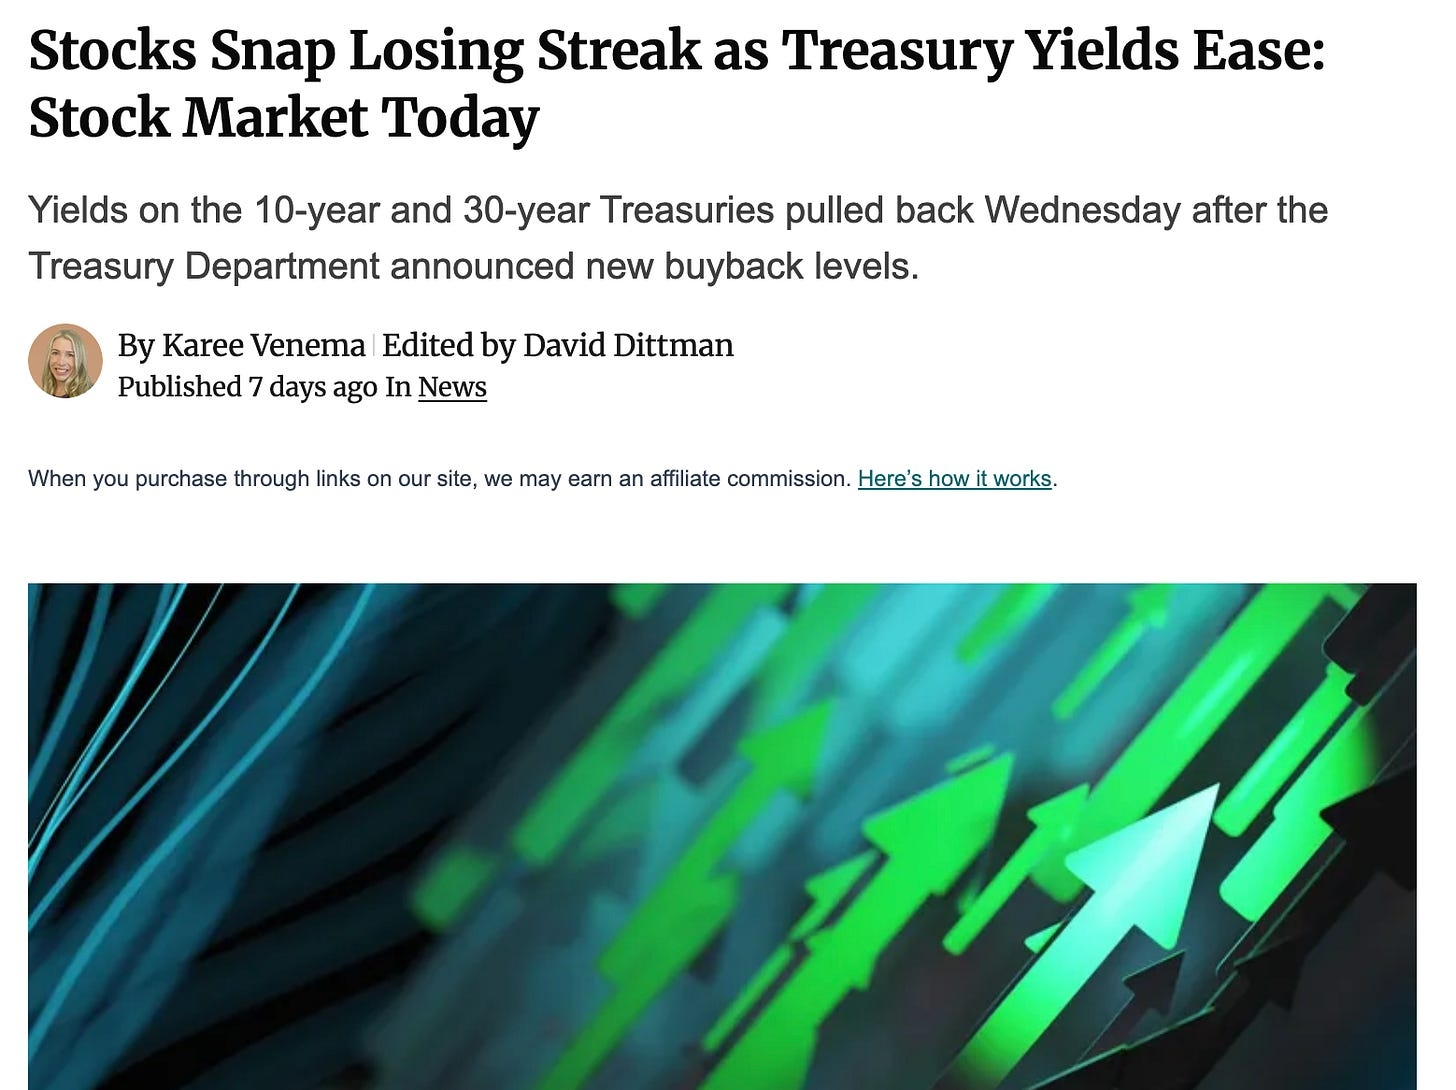
At 08:32 EDT, the U.S. Treasury announced that it would increase the maximum size of some long-end liquidity-support buybacks from $2B to at least $4B per operation.
Long-term yields reacted quickly.
The 10-year fell roughly 6.7 bps and the 30-year around 10 bps.
BTC moved from roughly the mid-$64K area toward $69K during the session.
There was also SEC crypto-policy news around the same time, which is why I wouldn’t pretend the Treasury headline was the one clean cause of the move.
Markets are rarely that nice.
But once Bitcoin started moving, derivatives made everything much more violent.
Across roughly 45 hours on August 19–20, around $3B of crypto derivatives positions were liquidated, with about $2.77B on the short side.
Important detail: that is market-wide crypto liquidation data, not $2.77B of BTC shorts alone.
Still, the direction is pretty obvious.
There were a lot of shorts in the wrong place.
And this is where I think people sometimes describe squeezes backwards.
Short liquidations usually don’t explain the first buyer.
Price has to move against the shorts before they get liquidated.
So saying “shorts caused the rally” is incomplete.
More like:
A catalyst pushed BTC up.
That hit short liquidation levels.
Forced buying pushed BTC higher.
Which hit more shorts.
Then crypto did what crypto does.
The squeeze turned a move into a much bigger move.
August 20 is the day that matters most to me
If this rally had been nothing more than a headline plus shorts getting blown out, I’d expect the structure to weaken pretty quickly once the forced buying was done.
Instead, something interesting happened on August 20.
Bitcoin kept moving higher.
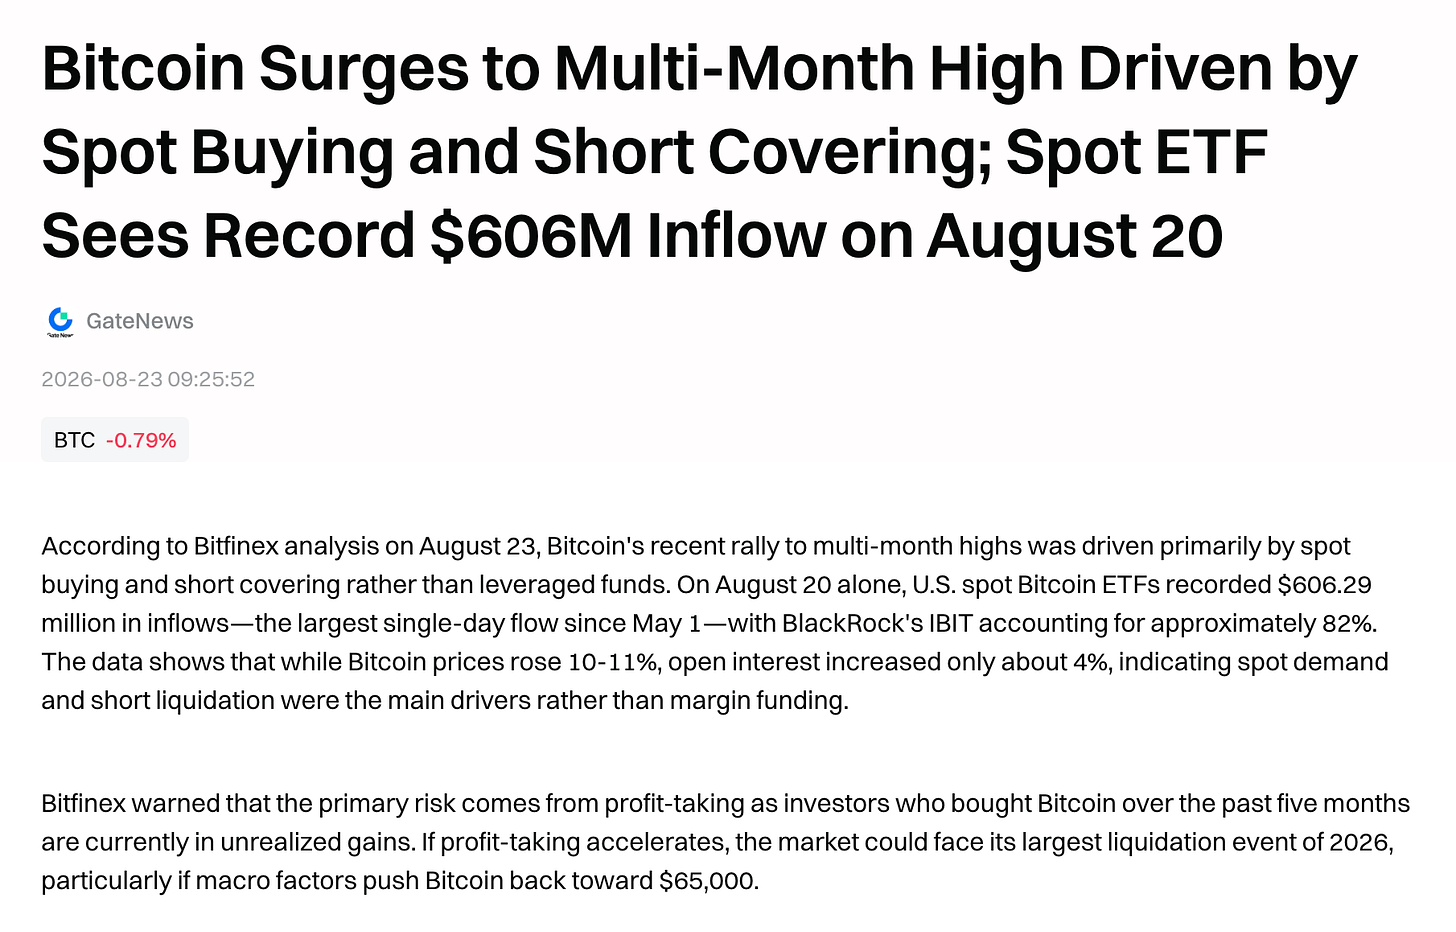
BTC ETF net inflow came in around +$606. 3M, the strongest single day in this window.
But OI-weighted funding actually dropped to around 0.0013.
That combination caught my attention.
Price up. ETF flows up. Funding down.
That’s not really what I’d expect from a rally being carried mainly by traders opening increasingly aggressive perp longs.
It looks much more like the market absorbed the squeeze and then found actual demand underneath it.
I wouldn’t say this proves every marginal buyer was spot. We don’t have clean enough historical Coinbase/Binance CVD, taker-flow or venue-level lead/lag data to make that claim.
But it’s probably the strongest evidence in the whole period that the rally’s mechanism changed.
The squeeze pushed the market higher.
Then spot/ETF demand helped keep it there.
And then traders started chasing it
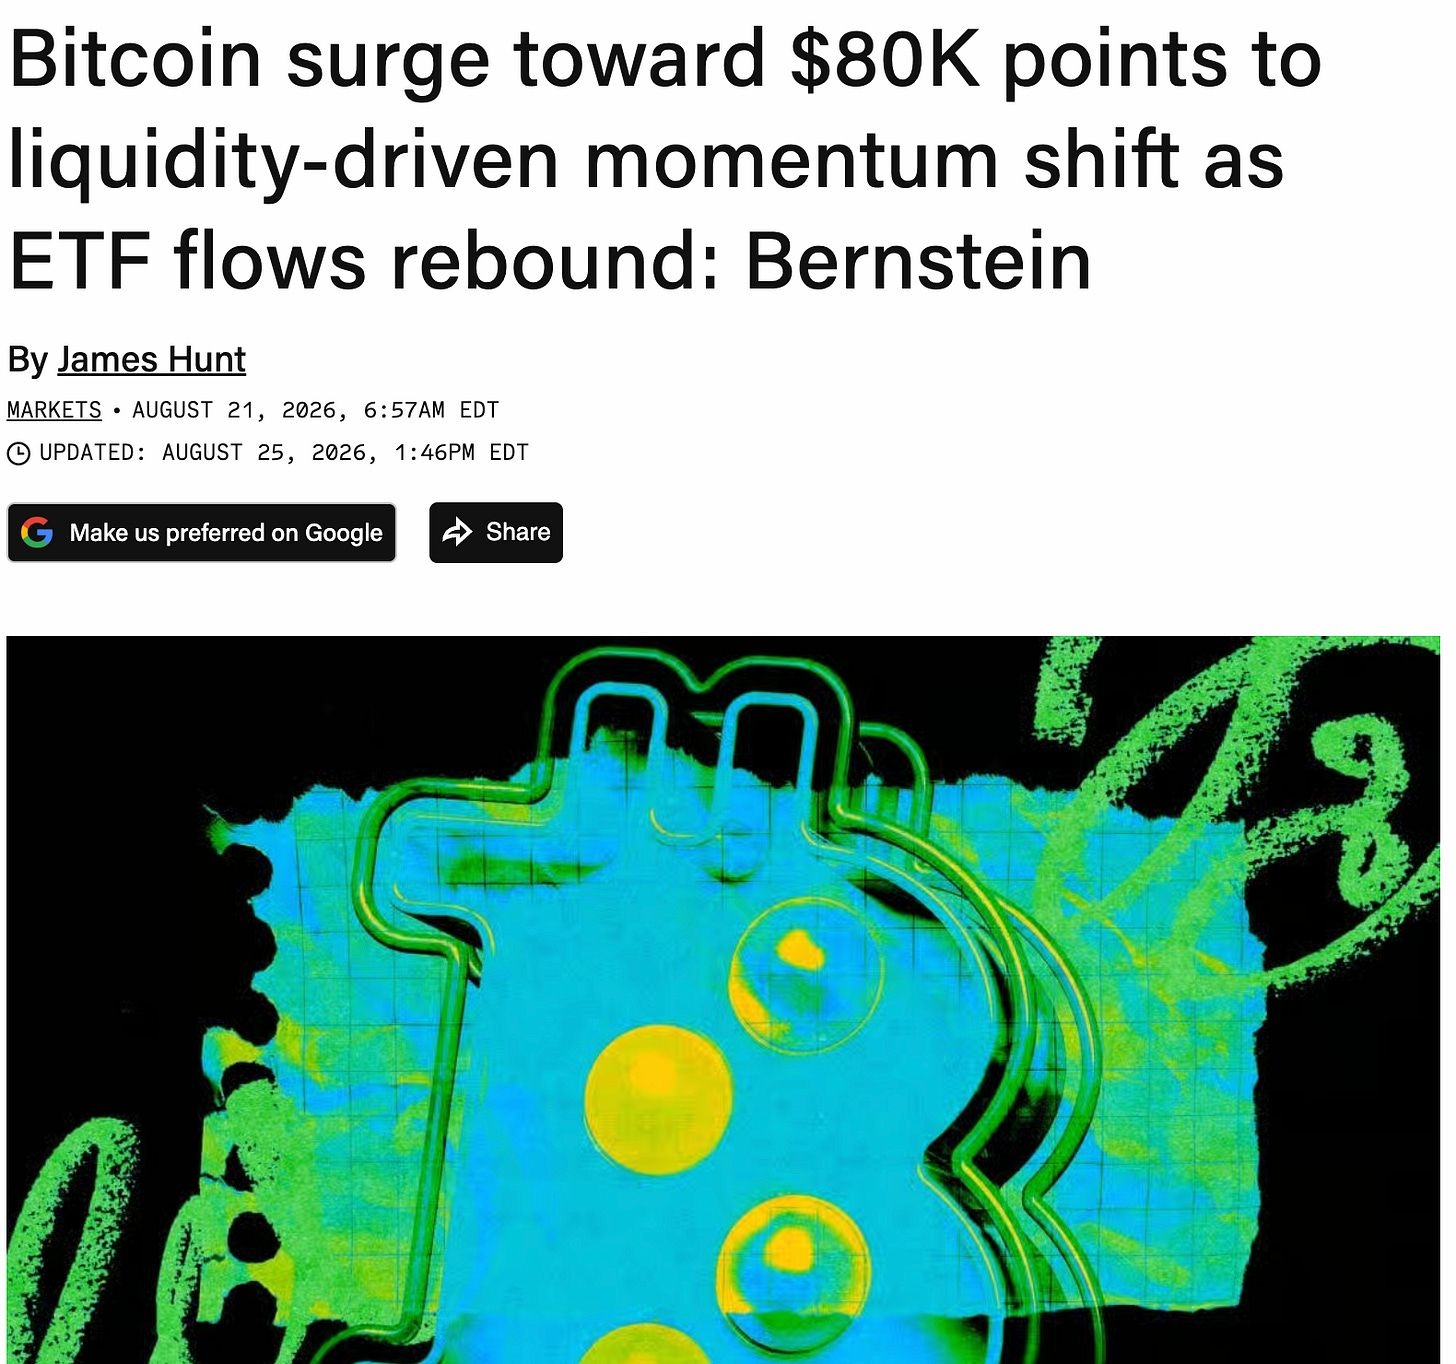
By August 21–23, things looked different again.
Funding started climbing.
OI-weighted funding went from around 0.0013 on August 20 to 0.0086 on August 21 and 0.0114 on August 22.
August 22 is especially useful because the ETF market was closed.
There was no fresh daily ETF flow number to lean on, yet positive funding remained elevated.
To me, that’s when the market started shifting from:
“spot demand + squeeze”
toward:
“spot demand + momentum longs.”
Not necessarily unhealthy. Strong trends attract leverage.
But it changes the risk.
Early in the move, shorts were the forced buyers.
Later in the move, longs became the people who could turn into forced sellers.
And by August 26, that flip was pretty visible.
BTC recorded about $99M of liquidations over the previous 24 hours, with roughly $84.7M coming from longs.
Around 85%.
That is almost the mirror image of the early squeeze setup.
The rally hadn’t necessarily become fake.
The fragile side had just changed.
ETF demand mattered, but I wouldn’t read it too literally
Across August 17–25, BTC ETFs recorded roughly $2.57B in net inflows.
That’s significant.
It’s one of the main reasons I don’t buy the idea that this was just a derivatives rally.
But ETF flow data gets oversimplified too.
A +$600M ETF day does not necessarily mean someone went into the spot order book and market-bought exactly $600M of BTC that afternoon.
Authorized participants, market makers, OTC desks, hedges and in-kind transfers can all sit somewhere in that process.
So I use ETF flows as evidence of strong regulated allocation demand.
Not as a perfect tick-by-tick map of spot buying.
That difference sounds small, but it matters if you’re trying to understand who actually moved price.
So what actually drove the rally?
I’d break it into three parts.
First, the market already had a spot-demand base. ETF inflows were positive before the breakout.
Then came the catalyst + squeeze phase. Macro and regulatory headlines pushed BTC higher, and heavily positioned shorts made the move much faster than it probably would have been otherwise.
Then came validation. ETF flows stayed strong after the squeeze and funding briefly cooled even as price continued higher.
And finally, momentum traders arrived. Funding moved back up, late longs became more important, and downside liquidation risk shifted toward them.
So no, I don’t think the right debate is:
Was it spot or was it a squeeze?
That’s the wrong binary.
The better model is:
spot demand base → catalyst → short squeeze → spot-supported continuation → momentum longs
The rally was real.
But the engine changed while it was running.
My take
The part I’d watch now isn’t whether people can still find bullish headlines for Bitcoin.
They can.
It’s whether the current buyer is as healthy as the one that carried the middle of the rally.
ETF demand staying positive while funding cools would be a pretty good setup.
ETF demand slowing while funding and open interest keep rising would be much less comfortable.
Because once a rally moves from forced short buying, to real demand, to traders chasing the same move with leverage, the price can still keep going.
But the downside gets very different.
And we already got a small preview of that on August 26.
The shorts were no longer the ones trapped.
The longs were.
This is not investment advice. ETF flows, funding, open interest and liquidation data are useful market-structure signals, but none of them alone can identify the exact marginal buyer or prove causality.