#cryptotradingpro #BTC
📊 $BTC /USD (4H): Technical and Liquidity Analysis
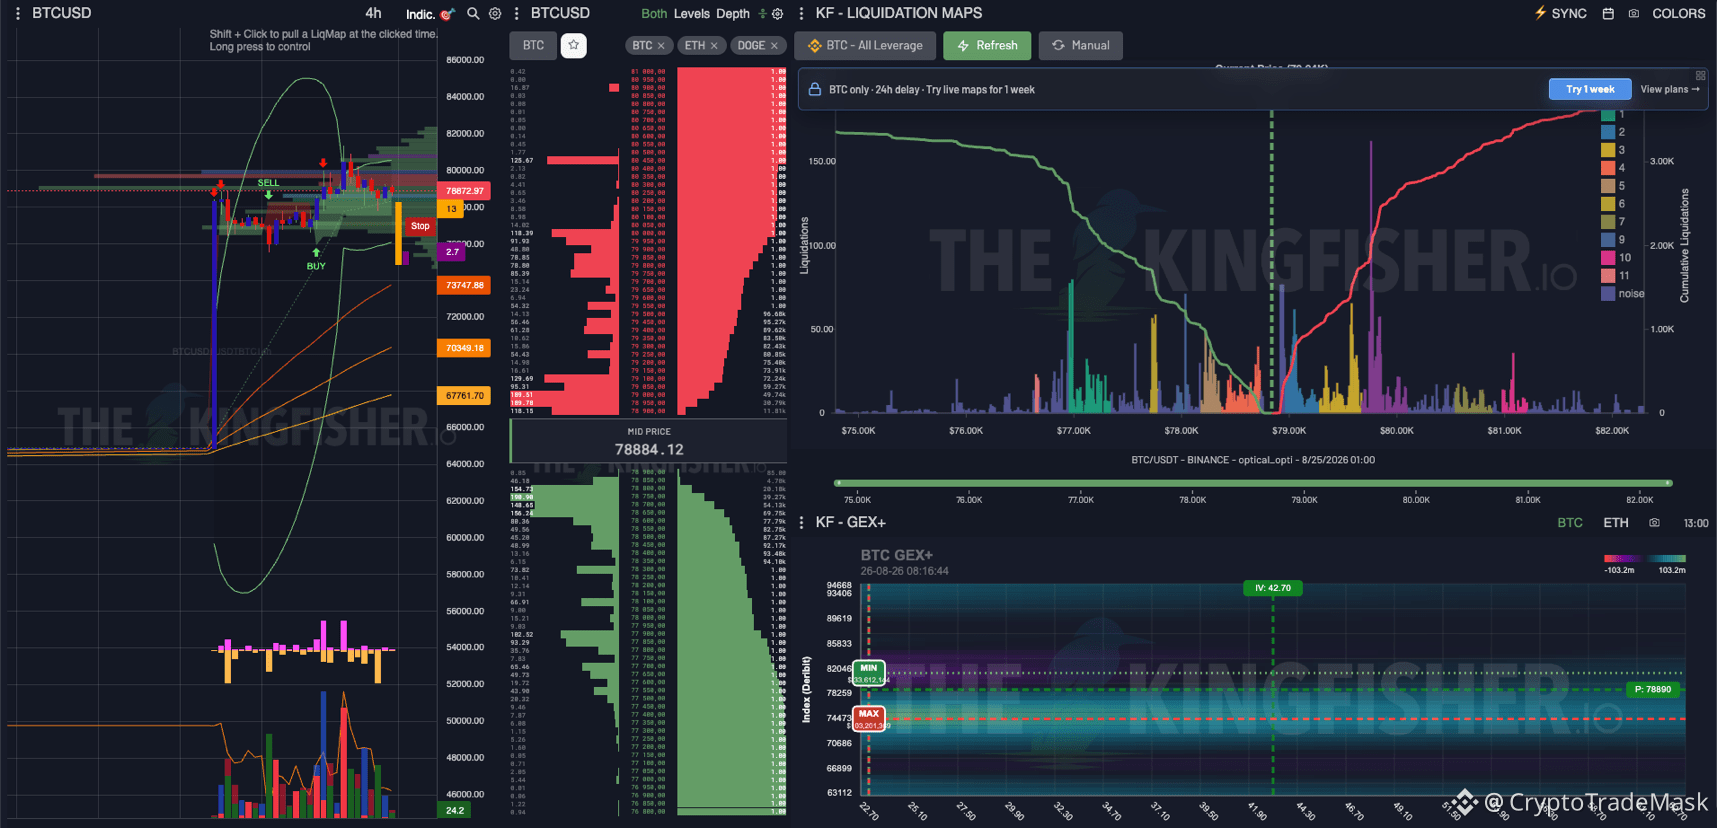
The current price of Bitcoin is trading around $78,880, trapped in a narrow range after a strong impulse growth. Let's analyze the liquidation charts and option levels:
🔍 What we see on the charts:
➡️ Resistance and Short Liquidations: The main resistance is in the $80,000 - $81,000 zone. The liquidation chart clearly shows a cascade of short stops around $79,800 - $80,200. This is the main target for the market maker above.
➡️ Support and Long Liquidations: The local support zone is $77,000 - $78,000. Below the current price, there are pools of long liquidations up to $76,000, and the key support levels on the chart are at $73,747 and $70,349.
➡️ Volatility and GEX+: IV is 42.70%, the price is inside the neutral Gamma Exposure corridor ($74.5k – $82k). The market is accumulating strength before the next exit.
🚦 Movement scenarios:
1️⃣ Main (Squeeze in both directions):
A possible quick spill/sweep to the $77,000 – $77,500 zone to remove hot longs, followed by a reversal and an impulse shot to $80,000 – $80,500 on the liquidity of shorts.
2️⃣ Bullish scenario:
A 4H candlestick consolidation above $80,500 will trigger a Gamma Squeeze and open the way to $82,000 – $84,000.
3️⃣ Bearish scenario:
A loss of $77,000 will send the price to cover the momentum imbalance in the $73,700 - $70,300 zone.
⚠️ Opinion: The priority remains to collect short liquidity above $80,000, but be prepared for local manipulation and longs to be removed before the breakdown. Trade with stops!
📊 $BTC /USD (4H): Technical and Liquidity Analysis
The current price of Bitcoin is trading around $78,880, trapped in a narrow range after a strong impulse growth. Let's analyze the liquidation charts and option levels:
🔍 What we see on the charts:
➡️ Resistance and Short Liquidations: The main resistance is in the $80,000 - $81,000 zone. The liquidation chart clearly shows a cascade of short stops around $79,800 - $80,200. This is the main target for the market maker above.
➡️ Support and Long Liquidations: The local support zone is $77,000 - $78,000. Below the current price, there are pools of long liquidations up to $76,000, and the key support levels on the chart are at $73,747 and $70,349.
➡️ Volatility and GEX+: IV is 42.70%, the price is inside the neutral Gamma Exposure corridor ($74.5k – $82k). The market is accumulating strength before the next exit.
🚦 Movement scenarios:
1️⃣ Main (Squeeze in both directions):
A possible quick spill/sweep to the $77,000 – $77,500 zone to remove hot longs, followed by a reversal and an impulse shot to $80,000 – $80,500 on the liquidity of shorts.
2️⃣ Bullish scenario:
A 4H candlestick consolidation above $80,500 will trigger a Gamma Squeeze and open the way to $82,000 – $84,000.
3️⃣ Bearish scenario:
A loss of $77,000 will send the price to cover the momentum imbalance in the $73,700 - $70,300 zone.
⚠️ Opinion: The priority remains to collect short liquidity above $80,000, but be prepared for local manipulation and longs to be removed before the breakdown. Trade with stops!