
$DUSK/USDT 4H Technical Analysis — What The Chart Is Telling Us 📊
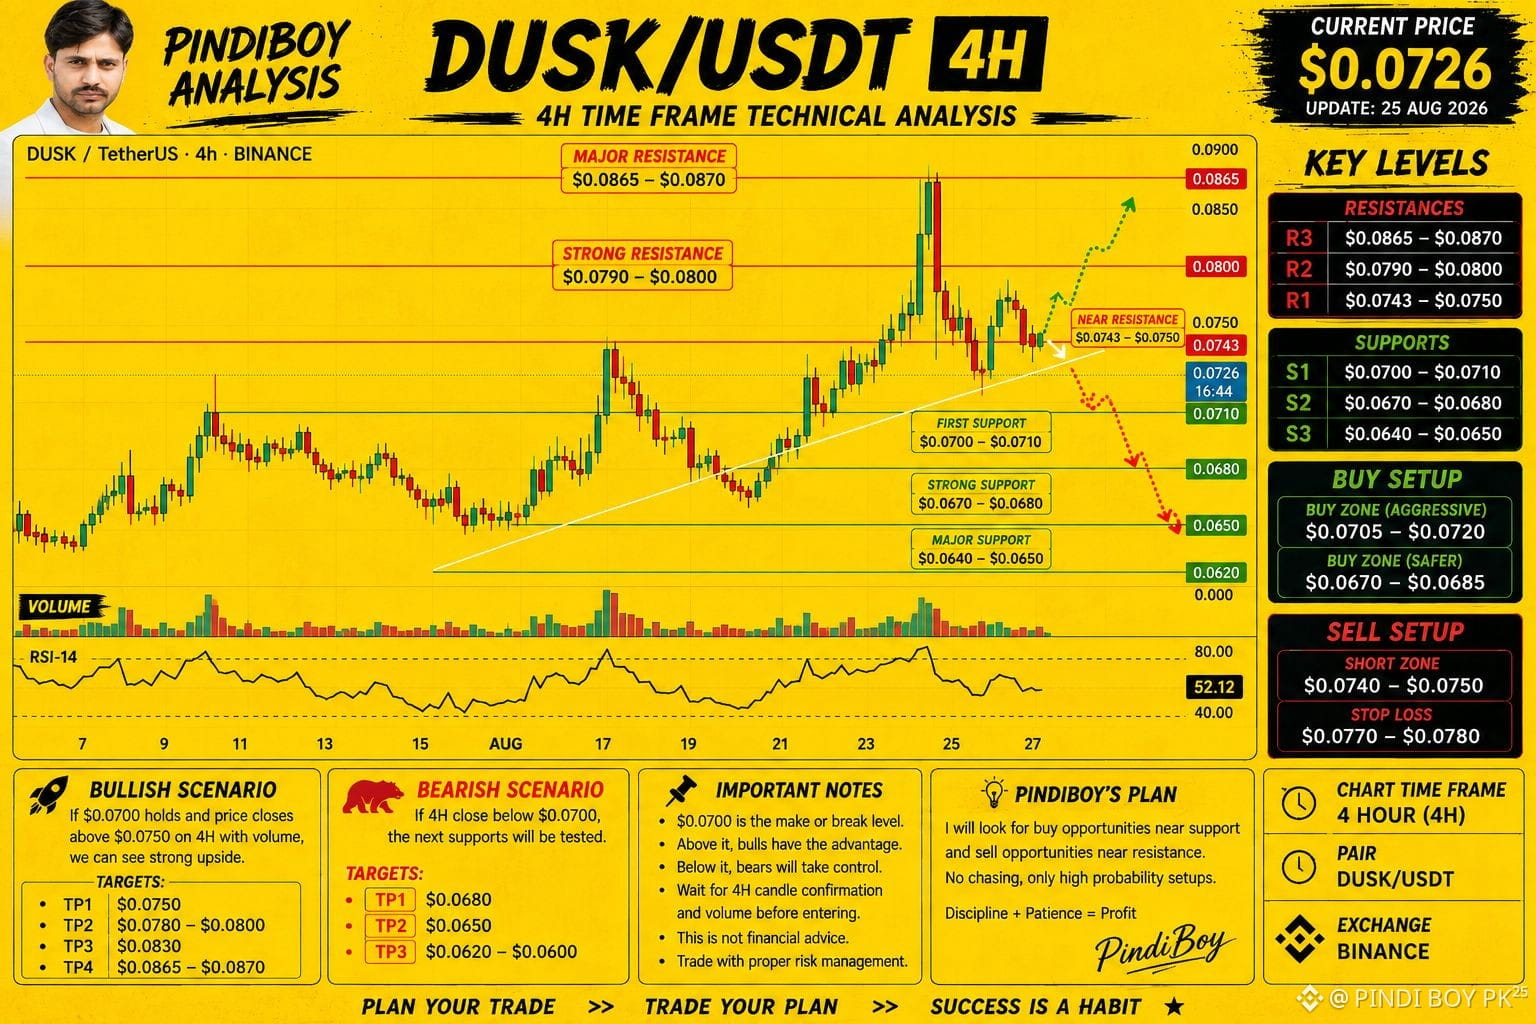
Looking at the 4H structure, DUSK is currently trading around $0.0726 after getting rejected from the higher $0.079–$0.080 area. The important thing now is not to chase the candle, but to understand where buyers and sellers are actually positioned.
The first support zone is around $0.0700–$0.0710. If this area holds and buyers step in, DUSK can attempt a recovery toward $0.0743–$0.0750, which is the first important resistance.
For a stronger bullish move, I want to see a 4H candle close above $0.0750. If that happens with volume, the next targets become $0.0780–$0.0800, followed by $0.0830. The major upside resistance remains around $0.0865–$0.0870, which is close to the recent swing high.
@Dusk is currently sitting at a very important decision area. The RSI is around 52, so the market is not overbought yet. That means there is still room for a move higher, but confirmation is more important than prediction.
On the downside, losing $0.0700 on a strong 4H close would weaken the structure. In that case, the next support is around $0.0670–$0.0680, while a deeper breakdown could take DUSK toward $0.0640–$0.0650. If $0.0650 also fails, the chart opens the door toward the $0.0620–$0.0600 region.
So my trading map is simple:
🟢 Buy zone: $0.0705–$0.0720
🟢 Safer support buy: $0.0670–$0.0685
🎯 Upside: $0.0750 → $0.0800 → $0.0830 → $0.0865
🔴 Short/rejection zone: $0.0740–$0.0750
⚠️ Bearish confirmation: 4H close below $0.0700
📉 Downside: $0.0680 → $0.0650 → $0.0620–$0.0600
The biggest lesson from this chart is that $0.0700 is the line I would watch most closely. Above it, DUSK still has a reasonable chance to rebuild bullish momentum.
And remember: these are technical levels, not guaranteed targets. Wait for 4H candle confirmation and volume before taking a leveraged trade.
$DUSK
#dusk #cryptotrading #TechnicalAnalysis #Binance #altcoins
@China_BNB @Mano 25 @509 JonyDong @Dusk
Looking at the 4H structure, DUSK is currently trading around $0.0726 after getting rejected from the higher $0.079–$0.080 area. The important thing now is not to chase the candle, but to understand where buyers and sellers are actually positioned.
The first support zone is around $0.0700–$0.0710. If this area holds and buyers step in, DUSK can attempt a recovery toward $0.0743–$0.0750, which is the first important resistance.
For a stronger bullish move, I want to see a 4H candle close above $0.0750. If that happens with volume, the next targets become $0.0780–$0.0800, followed by $0.0830. The major upside resistance remains around $0.0865–$0.0870, which is close to the recent swing high.
@Dusk is currently sitting at a very important decision area. The RSI is around 52, so the market is not overbought yet. That means there is still room for a move higher, but confirmation is more important than prediction.
On the downside, losing $0.0700 on a strong 4H close would weaken the structure. In that case, the next support is around $0.0670–$0.0680, while a deeper breakdown could take DUSK toward $0.0640–$0.0650. If $0.0650 also fails, the chart opens the door toward the $0.0620–$0.0600 region.
So my trading map is simple:
🟢 Buy zone: $0.0705–$0.0720
🟢 Safer support buy: $0.0670–$0.0685
🎯 Upside: $0.0750 → $0.0800 → $0.0830 → $0.0865
🔴 Short/rejection zone: $0.0740–$0.0750
⚠️ Bearish confirmation: 4H close below $0.0700
📉 Downside: $0.0680 → $0.0650 → $0.0620–$0.0600
The biggest lesson from this chart is that $0.0700 is the line I would watch most closely. Above it, DUSK still has a reasonable chance to rebuild bullish momentum.
And remember: these are technical levels, not guaranteed targets. Wait for 4H candle confirmation and volume before taking a leveraged trade.
$DUSK
#dusk #cryptotrading #TechnicalAnalysis #Binance #altcoins
@China_BNB @Mano 25 @509 JonyDong @Dusk