🚨 $ONG JUST EXPLODED +43.29% — BUYERS ARE FIGHTING BACK HARD! 🔥
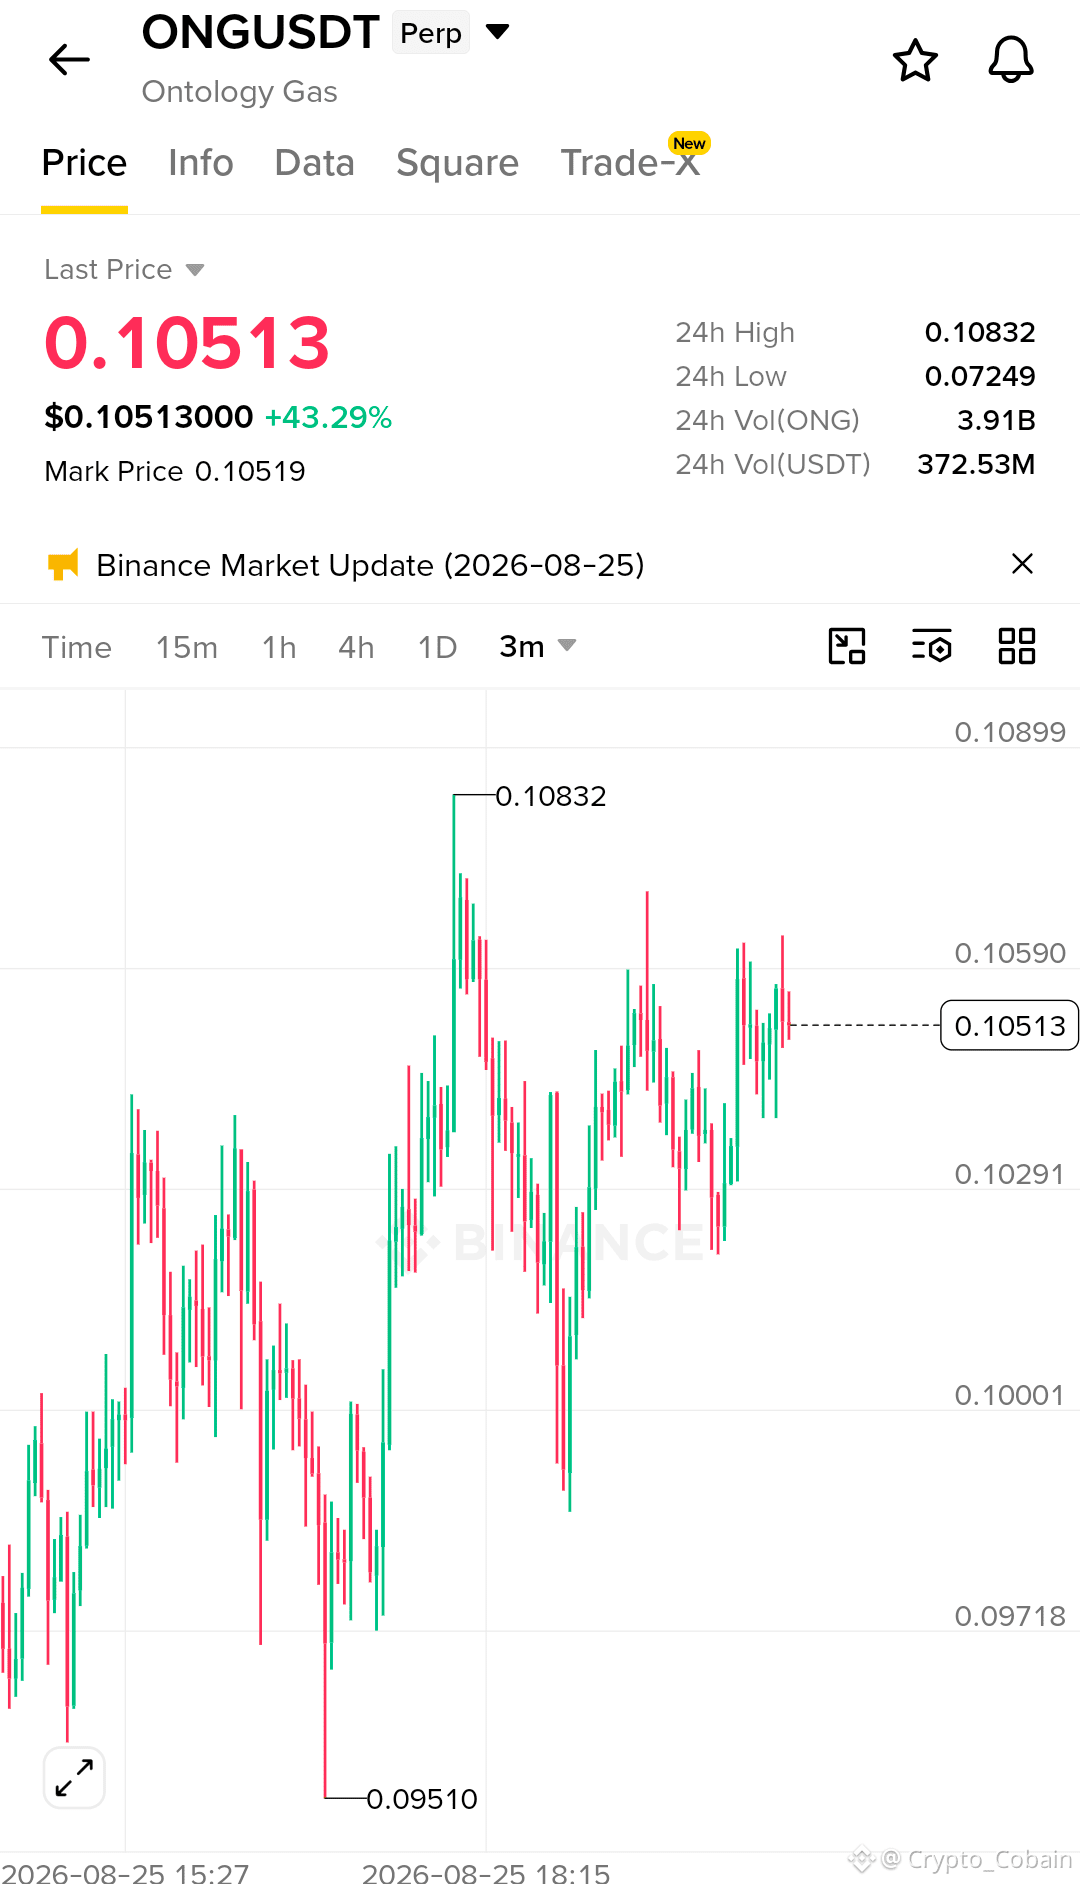
ONG is showing serious momentum on the 3M chart after recovering from the 0.09510 low and pushing all the way toward 0.10832.
I’m watching this closely because the structure has shifted from deep weakness into a strong recovery. Price is now holding around 0.10513, while buyers continue defending the higher zone.
📊 Current Price: 0.10513
📈 24H Change: +43.29%
🔥 24H High: 0.10832
📉 24H Low: 0.07249
💥 24H Volume: 372.53M USDT
🎯 Key Levels
• Resistance: 0.10832–0.10900
• Near support: 0.10500
• Key support: 0.10290
• Deeper support: 0.10000
The chart is compressing beneath the recent high. If ONG can break 0.10832 and hold above it with strong volume, momentum could accelerate toward the next psychological levels.
But if buyers lose 0.10290, I’d watch for a deeper pullback toward 0.10000 before the next attempt.
🔥 What I’m watching now:
Breakout → volume expansion → retest → continuation.
The move is already huge, so chasing random candles isn’t the setup I want. I’m more interested in how price reacts around resistance and whether buyers can turn the breakout level into support.
⚡ Bullish trigger: Clean reclaim above 0.10832
⚠️ Invalidation zone: Sustained weakness below 0.10290
$ONG has gone from 0.09510 → 0.10832 in a powerful recovery.
Now the battle is simple:
Can buyers break the 0.10832 ceiling? 👀🔥
DYOR. High volatility means conditions can change quickly.
🚀 ONG is definitely on my watchlist.
Follow for more 📈
Share with your trading fam 🤝
$ONG
#OilHoldsLosses #SamsungSKHynixLeveragedETFsPostFirstMonthlyOutflow #JapanNoAdditionalOilReserveReleaseInSepOct #KazakhstanCutsOilOutputForecastTo96MTons #HKJulyGoldNetExportsToMainland56.193Tons
ONG is showing serious momentum on the 3M chart after recovering from the 0.09510 low and pushing all the way toward 0.10832.
I’m watching this closely because the structure has shifted from deep weakness into a strong recovery. Price is now holding around 0.10513, while buyers continue defending the higher zone.
📊 Current Price: 0.10513
📈 24H Change: +43.29%
🔥 24H High: 0.10832
📉 24H Low: 0.07249
💥 24H Volume: 372.53M USDT
🎯 Key Levels
• Resistance: 0.10832–0.10900
• Near support: 0.10500
• Key support: 0.10290
• Deeper support: 0.10000
The chart is compressing beneath the recent high. If ONG can break 0.10832 and hold above it with strong volume, momentum could accelerate toward the next psychological levels.
But if buyers lose 0.10290, I’d watch for a deeper pullback toward 0.10000 before the next attempt.
🔥 What I’m watching now:
Breakout → volume expansion → retest → continuation.
The move is already huge, so chasing random candles isn’t the setup I want. I’m more interested in how price reacts around resistance and whether buyers can turn the breakout level into support.
⚡ Bullish trigger: Clean reclaim above 0.10832
⚠️ Invalidation zone: Sustained weakness below 0.10290
$ONG has gone from 0.09510 → 0.10832 in a powerful recovery.
Now the battle is simple:
Can buyers break the 0.10832 ceiling? 👀🔥
DYOR. High volatility means conditions can change quickly.
🚀 ONG is definitely on my watchlist.
Follow for more 📈
Share with your trading fam 🤝
$ONG
#OilHoldsLosses #SamsungSKHynixLeveragedETFsPostFirstMonthlyOutflow #JapanNoAdditionalOilReserveReleaseInSepOct #KazakhstanCutsOilOutputForecastTo96MTons #HKJulyGoldNetExportsToMainland56.193Tons