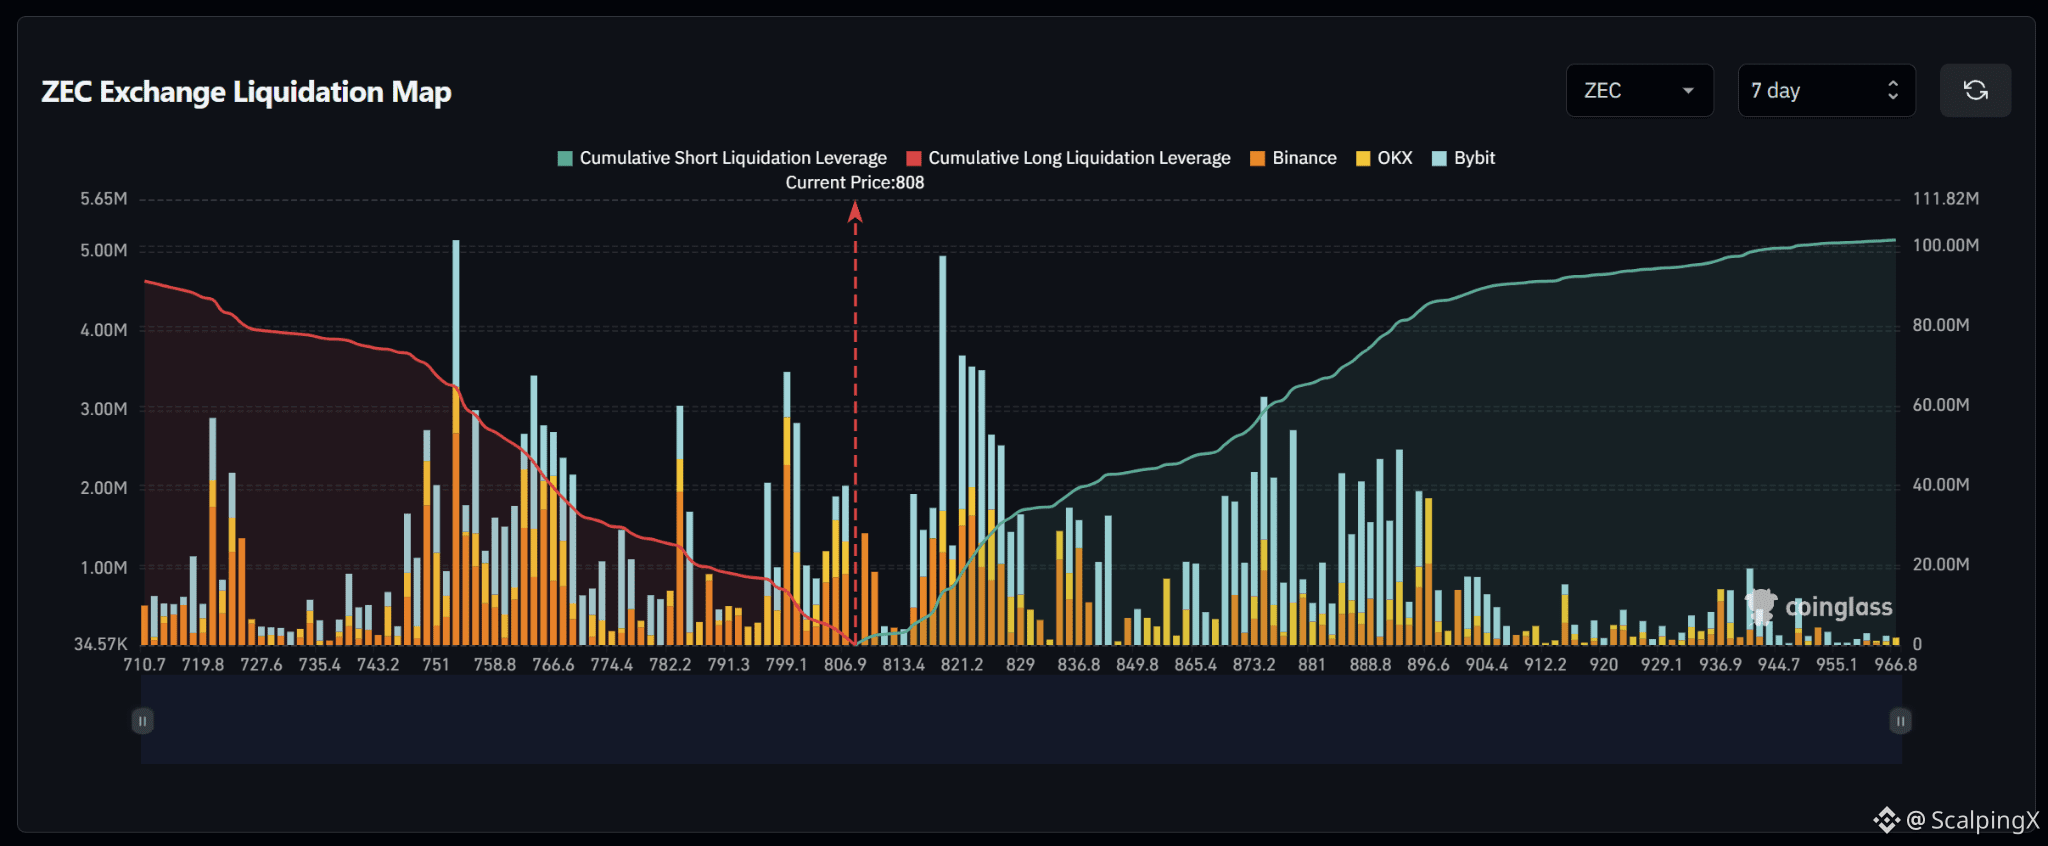
$ZEC – Liquidation Map (7 Days) – Current Price 808
🔎 The 7-day liquidation map shows roughly $100 million in short liquidations above the current price, slightly exceeding approximately $90 million in long liquidations below. The overall structure is therefore relatively balanced but modestly tilted to the upside, with a major short-liquidation cluster sitting fairly close above the market.
📉 Below the market, nearby long-liquidation liquidity is concentrated around 806.9–799.1, with 799.1 standing out as the strongest nearby cluster. Further downside liquidity remains dense across 782.2–766.6, while the largest lower cluster sits around 751–758.8. Losing 799.1 would increase the probability of a sweep toward 791.3–782.2.
📈 Above the market, short-liquidation liquidity rises from 813.4 and becomes particularly dense across 821.2–829, with the strongest nearby spike around 821.2. Additional clusters appear around 873.2–881 and 888.8–896.6. A break above 813.4 would bring 821.2–829 into focus.
🧭 The near-term setup is relatively balanced but modestly favors the upside because total short-liquidation exposure above is larger. Breaking 813.4 would increase the probability of a sweep toward 821.2–829, while losing 799.1 would shift attention toward 791.3–782.2.
#LiquidationMap
🔎 The 7-day liquidation map shows roughly $100 million in short liquidations above the current price, slightly exceeding approximately $90 million in long liquidations below. The overall structure is therefore relatively balanced but modestly tilted to the upside, with a major short-liquidation cluster sitting fairly close above the market.
📉 Below the market, nearby long-liquidation liquidity is concentrated around 806.9–799.1, with 799.1 standing out as the strongest nearby cluster. Further downside liquidity remains dense across 782.2–766.6, while the largest lower cluster sits around 751–758.8. Losing 799.1 would increase the probability of a sweep toward 791.3–782.2.
📈 Above the market, short-liquidation liquidity rises from 813.4 and becomes particularly dense across 821.2–829, with the strongest nearby spike around 821.2. Additional clusters appear around 873.2–881 and 888.8–896.6. A break above 813.4 would bring 821.2–829 into focus.
🧭 The near-term setup is relatively balanced but modestly favors the upside because total short-liquidation exposure above is larger. Breaking 813.4 would increase the probability of a sweep toward 821.2–829, while losing 799.1 would shift attention toward 791.3–782.2.
#LiquidationMap