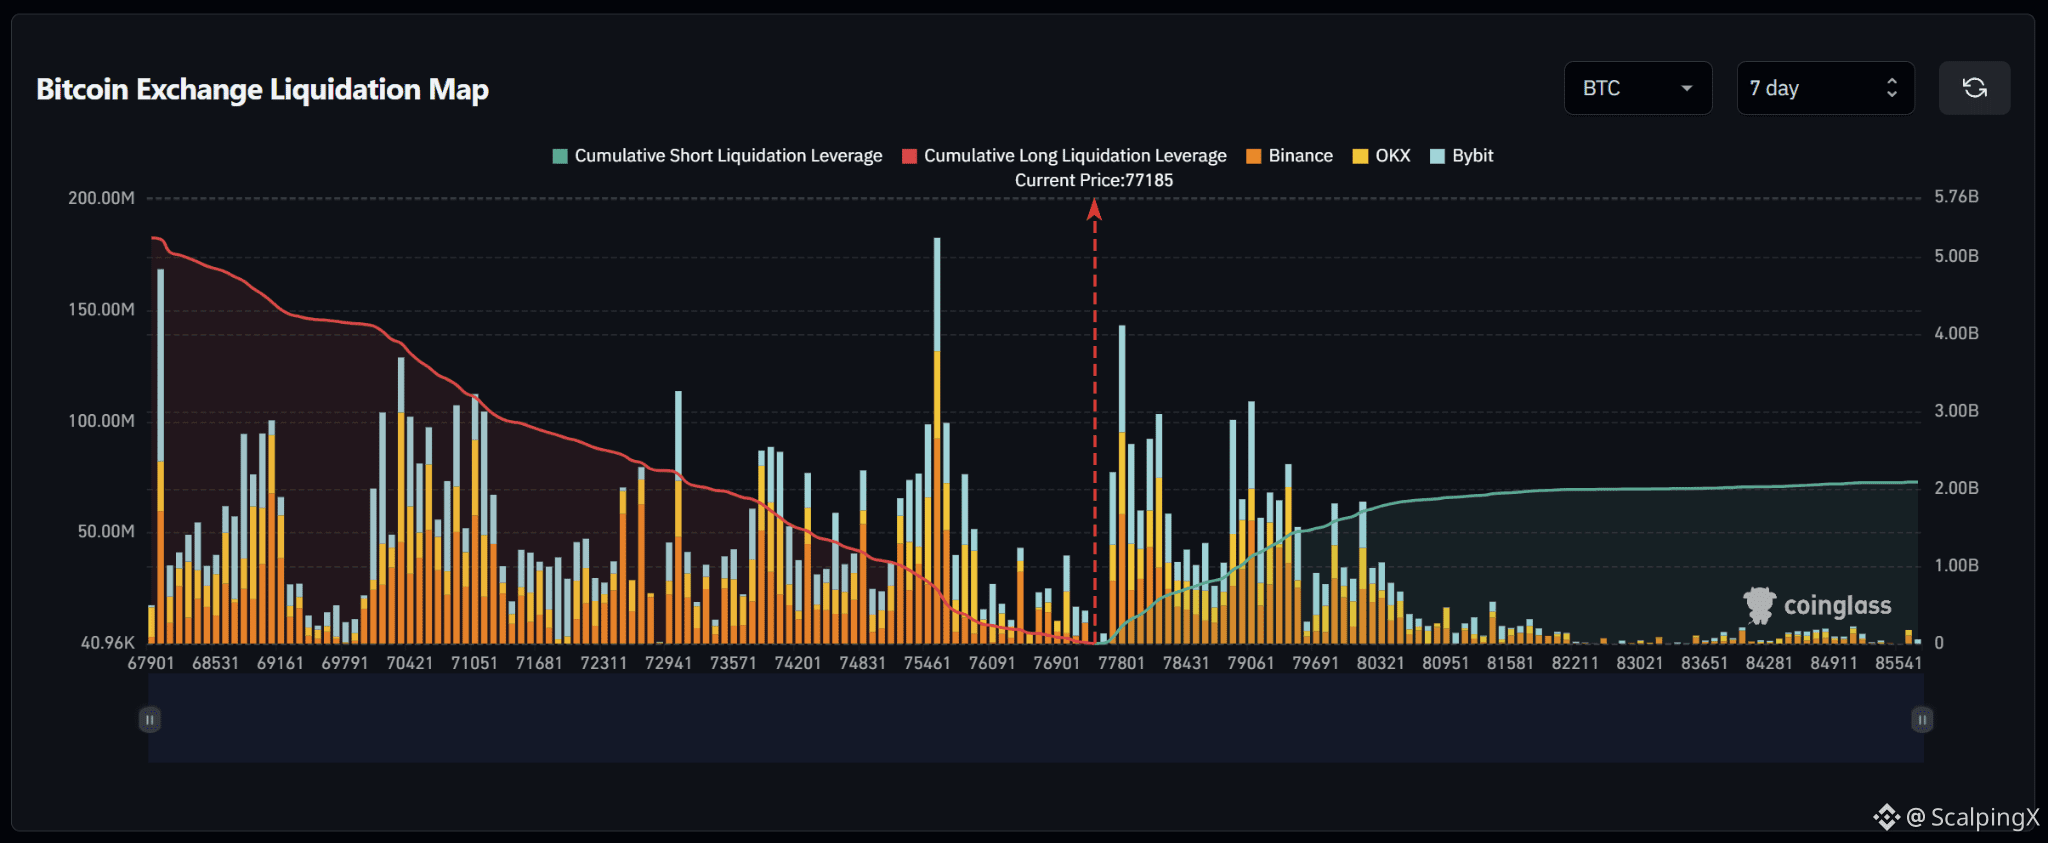
$BTC – Liquidation Map (7 Days) – Current Price 77,185
🔎 The 7-day liquidation map shows roughly $5.0 billion in long liquidations below the current price, far exceeding approximately $2.0 billion in short liquidations above. The liquidity structure therefore leans strongly to the downside, although several large short-liquidation clusters remain immediately above the market.
📉 Below the market, nearby long-liquidation liquidity is concentrated around 76,901–76,091 before increasing sharply across 75,461–74,831. The strongest nearby cluster sits around 75,461, where the largest liquidation bar in this area appears. Additional liquidity remains dense across 74,201–72,941. Losing 76,901 would increase the probability of a sweep toward 76,091–75,461.
📈 Above the market, short-liquidation liquidity rises sharply around 77,801 and remains elevated across 78,431–79,691. The strongest clusters sit near 77,801 and 79,061–79,691, while meaningful liquidity extends toward 80,321. A break above 77,801 would bring 78,431–79,061 into focus.
🧭 The broader setup favors the downside because total long-liquidation exposure below is roughly 2.5 times larger. Losing 76,901 would strengthen the probability of a sweep toward 76,091–75,461, while breaking above 77,801 would shift attention toward a short-liquidation sweep across 78,431–79,691.
#LiquidationMap
🔎 The 7-day liquidation map shows roughly $5.0 billion in long liquidations below the current price, far exceeding approximately $2.0 billion in short liquidations above. The liquidity structure therefore leans strongly to the downside, although several large short-liquidation clusters remain immediately above the market.
📉 Below the market, nearby long-liquidation liquidity is concentrated around 76,901–76,091 before increasing sharply across 75,461–74,831. The strongest nearby cluster sits around 75,461, where the largest liquidation bar in this area appears. Additional liquidity remains dense across 74,201–72,941. Losing 76,901 would increase the probability of a sweep toward 76,091–75,461.
📈 Above the market, short-liquidation liquidity rises sharply around 77,801 and remains elevated across 78,431–79,691. The strongest clusters sit near 77,801 and 79,061–79,691, while meaningful liquidity extends toward 80,321. A break above 77,801 would bring 78,431–79,061 into focus.
🧭 The broader setup favors the downside because total long-liquidation exposure below is roughly 2.5 times larger. Losing 76,901 would strengthen the probability of a sweep toward 76,091–75,461, while breaking above 77,801 would shift attention toward a short-liquidation sweep across 78,431–79,691.
#LiquidationMap