


As of August 22, 2026, the Zcash crypto market presents one of the most stretched technical setups seen from this asset in a long time. ZEC/USDT trades at $794.69 on the daily chart, above the upper Bollinger Band, with an RSI reading of 86.27 — deep into unsustainable territory.
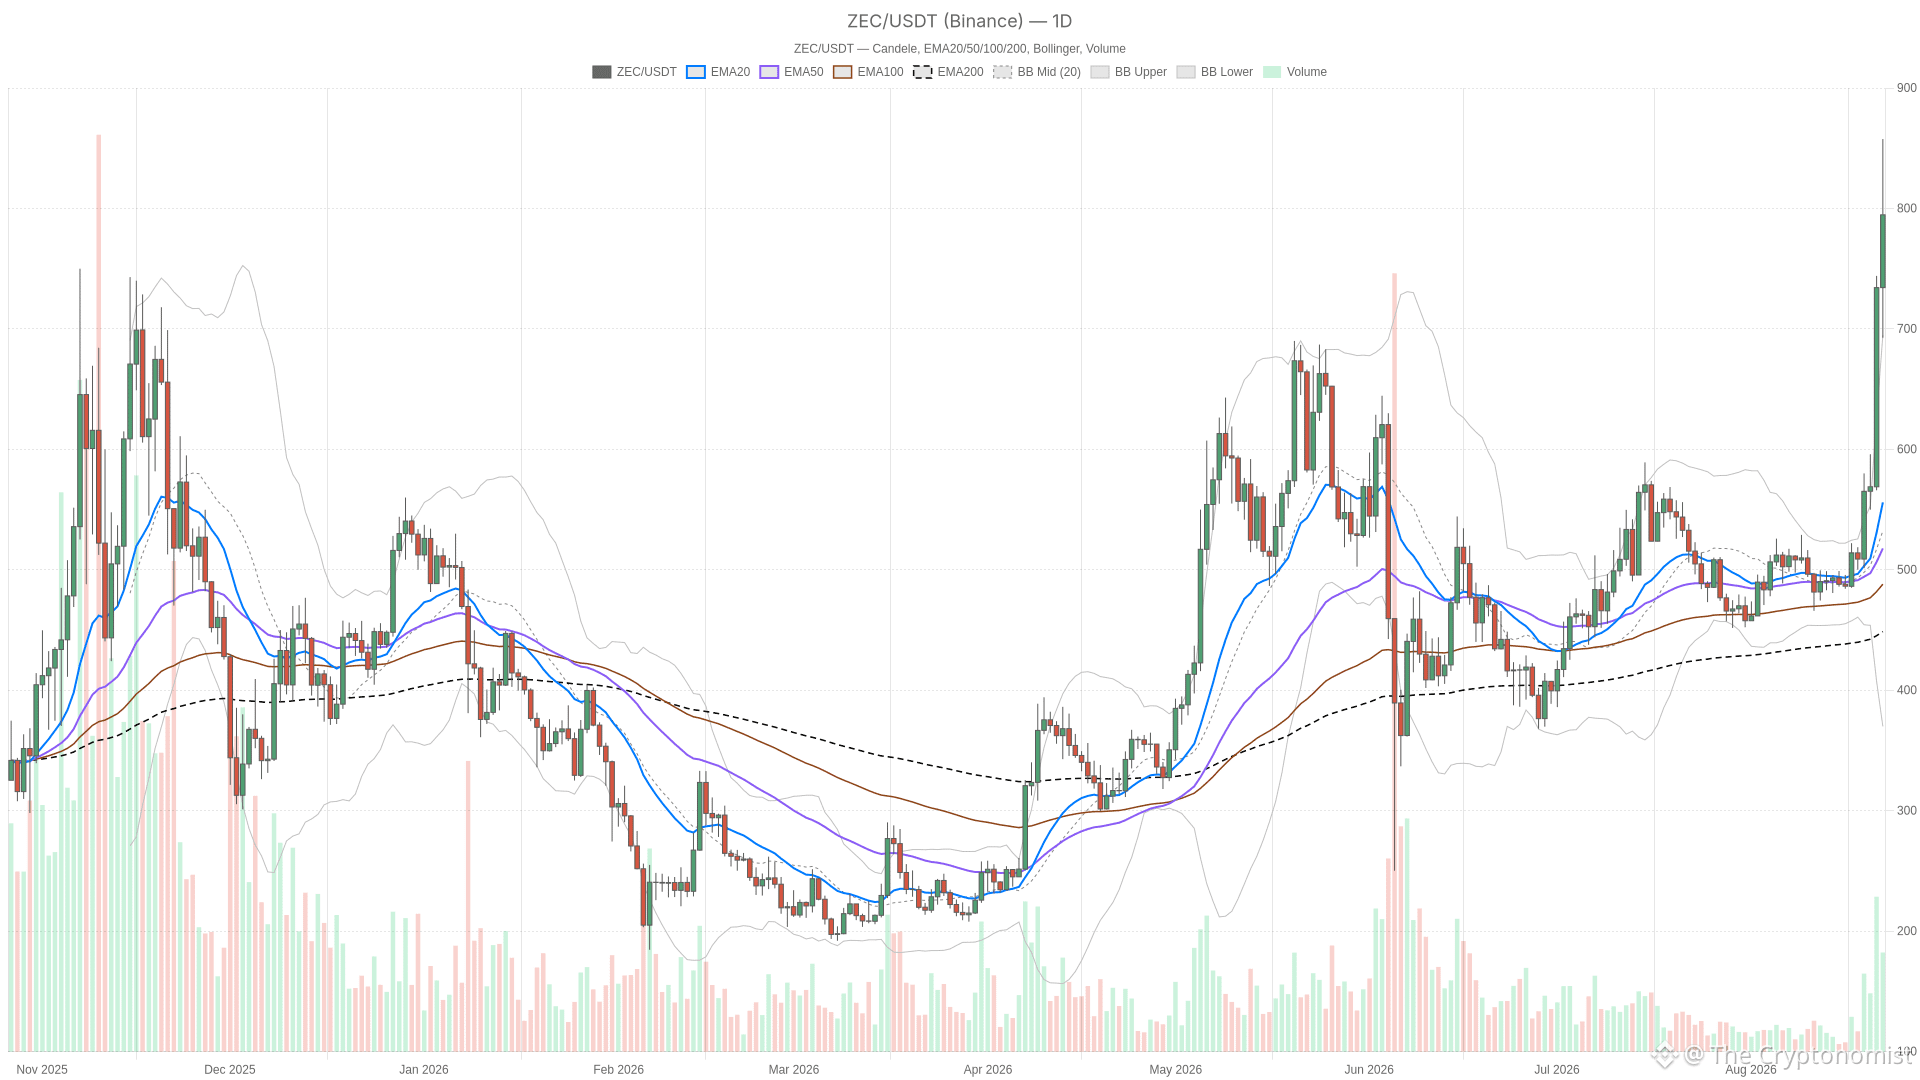 ZEC/USDT — daily chart with candlesticks, EMA20/EMA50 and volume.
Key takeaways
ZEC/USDT trades at $794.69 with RSI at 86.27, deep in extreme overbought territory
Price sits above the upper daily Bollinger Band at $694.68, a historically stretched position
Bitcoin dominance holds at 58.73% while total crypto market cap slipped -0.67% in 24 hours
Daily pivot at $781.67 and S1 at $705.70 define the near-term support zones to watch
Hourly MACD histogram has flipped negative, suggesting momentum may be cooling
Daily Chart: Full Trend Mode, But Dangerously Extended
The daily structure leaves no ambiguity about direction. EMA20 (555.96), EMA50 (517.77) and EMA200 (448.75) are stacked in perfect bullish order, and price is trading nearly 43% above the EMA20 alone. That kind of separation only appears during genuine breakout phases, confirming the daily regime is unambiguously bullish. The MACD backs this up, with the line at 45.26 well above the signal at 15.98 and a rising histogram of 29.28.
However, this is exactly where the story gets complicated. An RSI of 86.27 is not just overbought — it is an extreme reading rarely sustained for long without at least a sharp consolidation. Combine that with price trading above the upper Bollinger Band (694.68 vs. a 532.35 midline) and you get a market that has moved too far, too fast. The daily ATR of 48.66 confirms swings of this size are now the norm, raising the stakes for anyone chasing at current levels. Daily pivot points frame the near-term battle zones: pivot at 781.67, resistance R1 at 870.65, and support S1 at 705.70.
Hourly Momentum: Cracks Beginning to Show
The 1H timeframe still confirms the uptrend structurally — EMA20 (751.29) above EMA50 (677.54) above EMA200 (570.53) — but momentum is no longer accelerating. RSI14 has cooled to 68.72 from the daily extreme, and more tellingly, the MACD histogram has flipped negative (-0.67) even though the MACD line (47.3) remains just above its signal (47.97). That is a subtle but real warning: the engine that drove this rally is starting to lose thrust. Hourly pivots are extremely tight — pivot at 793.76, R1 at 795.14, S1 at 791.47 — showing price is coiled in a narrow band at a decision point.
15-Minute Execution: Consolidation Before the Next Move
Meanwhile, zooming into the 15-minute chart, the picture turns neutral. RSI sits almost exactly at 48.62, price (790.92) has slipped just below its EMA20 (798.37), and the MACD histogram is negative at -4.21. This is a market pausing to digest the move rather than one collapsing. Yet it is also not offering fresh bullish confirmation at this exact moment. The tension between timeframes is worth stating plainly: the daily is stretched and overbought, the hourly is bullish but losing steam, and the 15-minute is flat. That is a market that has run hard and is now deciding whether to consolidate, pull back, or find a second wind.
Bullish Scenario
If buyers defend the hourly pivot zone around 791-794 and reclaim the 15-minute EMA20 near 798, the path of least resistance stays up. The daily R1 at 870.65 becomes the next logical magnet. A sustained close above the daily pivot (781.67) with the MACD histogram turning positive again on the hourly would confirm the trend has more room left. Elevated Fear & Greed sentiment, currently at 71 (“Greed”), suggests risk appetite in the broader crypto market is still present enough to support further speculative buying into ZEC specifically. This scenario would be invalidated by a decisive break and hold below the daily S1 at 705.70, signaling the overbought unwind has gone beyond a routine pullback.
Bearish / Mean-Reversion Scenario
Given the RSI extreme and price sitting above the upper daily Bollinger Band, a mean-reversion move is arguably the higher-probability near-term outcome. A pullback toward the upper band itself (694.68) or toward the daily pivot (781.67) would not break the broader bullish structure — it would simply be normal digestion after a move this steep. The real warning would come if price loses the hourly S1 (791.47) and the 15-minute structure rolls over decisively below its EMA50 (773.09). That would open the door to a deeper retracement toward the 705-720 zone. This bearish case would be invalidated if price reclaims the 15-minute EMA20 and hourly momentum flips positive again.
Positioning and Risk
Zcash crypto is in a powerful uptrend by every daily structural measure, yet it is also historically stretched by momentum and volatility metrics that have a track record of preceding sharp corrections. The disagreement between the daily extreme reading and the hourly cooling momentum is the single most important thing to watch — it is the kind of tension that typically resolves within days, not weeks. Volatility, as measured by the daily ATR near 48.66, means whichever direction this breaks, the move is likely to be fast. Traders should size positions with that volatility in mind and watch whether the hourly MACD histogram flips positive or price loses the 791-794 pivot cluster.
FAQ
What does an RSI of 86.27 mean for ZEC?
An RSI reading of 86.27 signals that ZEC is in extreme overbought territory. Readings this elevated are rarely sustained for long without at least a sharp consolidation or retracement, meaning the current rally may be due for a pause even if the broader trend remains intact.
What are the key support levels for ZEC right now?
The daily pivot at $781.67 serves as the first line of defense. Below that, S1 at $705.70 and the upper Bollinger Band at $694.68 represent the next major support zones where buyers would need to step in to preserve the bullish structure.
Is the broader crypto market also rallying?
No. Total crypto market capitalization sits near $2.63 trillion and declined -0.67% over the past 24 hours, according to CoinGecko data. Zcash is rallying independently while the rest of the market takes a breather, pointing to asset-specific capital rotation rather than a broad risk-on wave.
Disclaimer: This article is for informational purposes only and does not constitute financial advice, an investment recommendation, or a solicitation to buy or sell any financial instrument or cryptocurrency. The analysis provided is not indicative of future results. Investing in crypto assets and financial markets carries a high risk of capital loss. Always do your own research (DYOR) and consult a qualified financial advisor before making any decision.
Article produced with the assistance of artificial intelligence and reviewed by the editorial team.