


Target stock (TGT) closed at 159.00 after a strong earnings pop, reaching a fresh 52-week high. The daily chart confirms a bullish trend, while short-term signals point to consolidation. Traders must now decide whether the breakout holds or pauses.
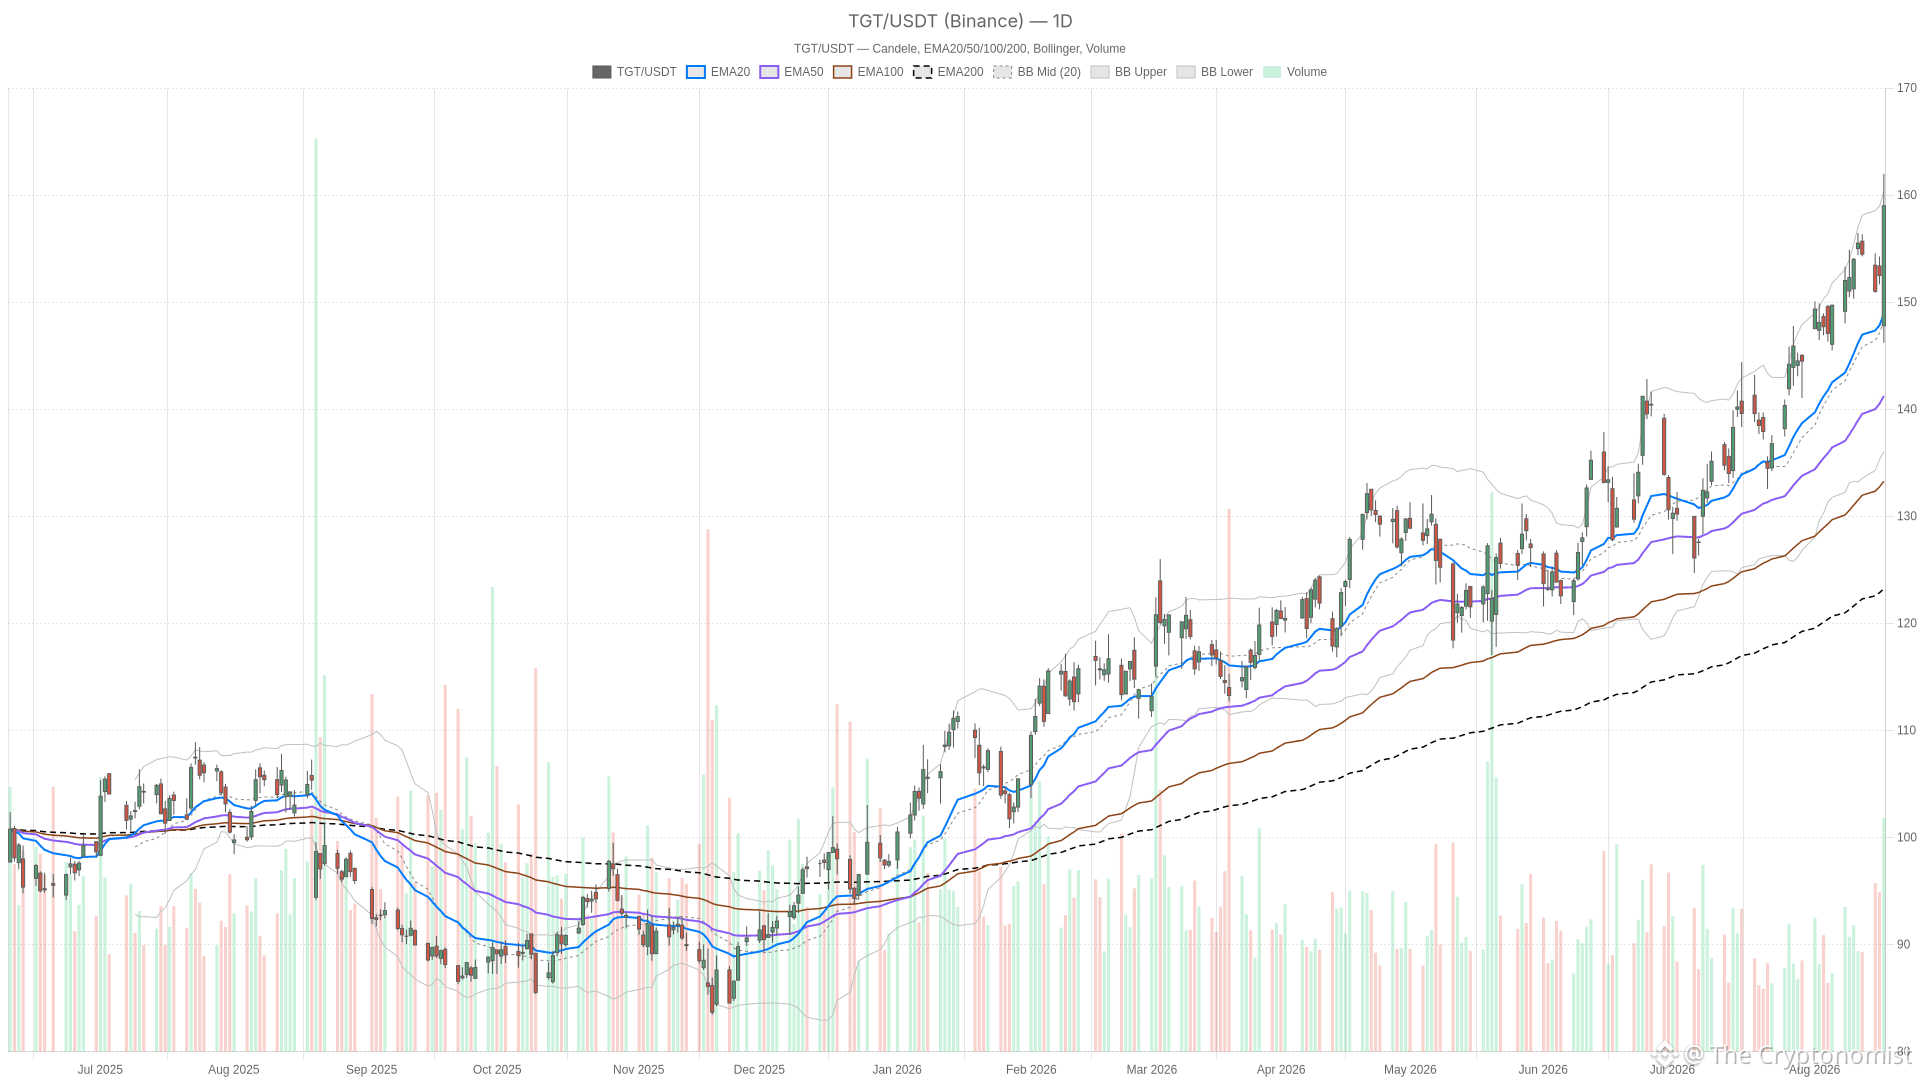 TGT — daily chart with candlesticks, EMA20/EMA50 and volume.
Key takeaways
Target stock closed at 159.00 after quarterly profit doubled to $1.88 billion and EPS reached $4.11.
The daily RSI14 sits at 71.55, a stretched reading that warns of a possible pause or pullback.
Price closed just under the daily upper Bollinger Band at 160.29, with key support at the EMA20 near 148.90.
The 1H chart confirms the uptrend with RSI at 61.38, leaving room before overbought signals appear.
The 15m chart shows a neutral pause, with RSI at 47.76 and a negative MACD histogram.
Target Stock Daily Trend: Strong Momentum, But Stretched
The daily trend in Target stock is unambiguously bullish, but momentum is stretched enough to warn of a pause or pullback.
Trend Structure and Overbought RSI
Price sits well above the EMA20 at 148.90, the EMA50 at 141.23 and the EMA200 at 123.22. That stacking order is exactly what technicians look for in a healthy uptrend. However, the RSI14 at 71.55 is firmly in overbought territory. Momentum has pushed the indicator into stretched levels. That typically means the market is due for a pause or a sharper pullback before the next leg higher.
MACD and Bollinger Band Positioning
The MACD supports the bullish case for now. The line sits at 4.89 above the signal at 4.56, with a histogram of 0.33. That is a positive but narrowing spread, suggesting momentum is still pointed higher but not accelerating aggressively.
On the Bollinger Bands, price at 159.00 is trading just under the upper band at 160.29. The mid-band sits at 148.17 and the lower band at 136.05. Being pinned against the upper band after such a strong move often signals a market running hot. It raises the odds of a mean-reversion move back toward the mid-band at some point.
Volatility and Pivot Context
Volatility has also expanded, with the ATR14 reading 4.55, well above where it likely sat before the earnings reaction. That is a natural consequence of the gap and the size of the daily range. It means traders should expect wider swings in both directions over the near term. On the pivot framework, the daily pivot point sits at 155.73, with resistance at 165.25 (R1) and support at 149.48 (S1). Price closing above the pivot and well into the upper half of that range confirms buyers are firmly in control on this timeframe.
1H Timeframe: Confirmation With a Caveat
The hourly chart confirms the daily uptrend, but with less extended momentum than the daily timeframe. The EMA structure remains bullish, with the EMA20 at 156.74 above the EMA50 at 154.33 and the EMA200 at 146.63. Price closed at 159.14 above all three. The RSI14 on the 1H chart sits at 61.38, a healthier and less extended reading than the daily RSI. That gap between timeframes is worth noting. The hourly chart still has room to run before flashing overbought signals, even though the daily chart is already stretched.
Meanwhile, the MACD on the 1H chart also confirms bullish momentum. The line sits at 1.93 above the signal at 1.26, with a histogram of 0.67. That is a stronger positive reading than what shows up on the daily chart. Bollinger Bands on this timeframe show the mid-band at 155.30 and the upper band at 162.99. Price is trading in the upper-middle portion of the range rather than glued to the ceiling.
The hourly pivot levels are tight, with the pivot point at 159.54, R1 at 160.13 and S1 at 158.55. The close at 159.14 sits almost exactly between pivot and support. Overall, the 1H timeframe confirms the daily uptrend without the same overbought warning signs, which somewhat tempers the daily caution.
15m Execution Context: A Short-Term Pause
The 15-minute chart shows a neutral short-term pause inside a much larger bullish structure. Zooming in, the regime here is labeled neutral rather than bullish, and the indicators back that up. RSI14 has cooled to 47.76, essentially a coin-flip reading that shows momentum has stalled after the initial push.
At the same time, the MACD has flipped slightly negative on this timeframe. The line sits at 0.83 below the signal at 1.29, with a histogram of -0.47. That is a short-term bearish crossover sitting inside a much larger bullish structure.
Price on the 15m chart closed at 159.14, just below the EMA20 at 159.98. It is still above the EMA50 at 157.90 and EMA200 at 154.44. On the Bollinger Bands, price is hugging the lower band at 159.12, with the mid-band up at 160.65. That positioning suggests short-term sellers have had the upper hand in the most recent candles. The broader trend on daily and hourly charts remains intact.
The 15m pivot point at 159.43, with resistance at 159.92 and support at 158.66, frames a tight consolidation range. Traders will want to watch that range for a directional break.
Bullish Scenario for Target Stock
The bullish case for Target stock rests on the daily uptrend continuing to absorb the overbought reading without a meaningful correction. Target stock needs to hold above the daily EMA20 near 148.90 and push through the daily R1 at 165.25. That would confirm buyers are willing to chase strength despite the stretched RSI.
Support from the strong earnings narrative, including the doubled profit and raised guidance, gives fundamental backing to that kind of continuation. On the 1H chart, a reclaim of the hourly R1 at 160.13 would be the first step. If the RSI stays below 70, momentum has room to build again before hitting resistance.
Bearish Scenario for Target Stock and What Would Invalidate the Uptrend
On the other hand, the overbought daily RSI at 71.55 combines with price sitting just under the upper Bollinger Band. That is a classic setup for a pullback. A break below the daily S1 at 149.48 would be the clearest signal that the rally is losing steam. Closing back under the daily EMA20 at 148.90 would carry the same message.
On the hourly chart, a drop through the pivot at 159.54 and S1 at 158.55 would align with the negative MACD on the 15m chart. That would reinforce a short-term corrective phase. Should that weakness spill into the daily timeframe, the mid-Bollinger Band at 148.17 becomes the next logical area. Buyers would need to step back in there to keep the broader uptrend intact.
Closing Thoughts
Overall, Target stock sits in a strong position structurally, with the daily and hourly timeframes both confirming a bullish regime built on genuine earnings momentum. However, the overbought daily RSI and the price action against the upper Bollinger Band suggest this is not a moment for complacency. The 15m chart’s neutral reading and negative MACD histogram indicate the market is digesting the recent surge.
That short-term hesitation could resolve into a healthy pause or open the door to a sharper pullback. With ATR readings elevated across timeframes, volatility is likely to stay elevated in the sessions ahead. Positioning should account for the possibility of sharp moves in either direction as the market decides whether this breakout has more room to extend.
FAQ
Is Target stock in a bullish or bearish trend?
The daily and hourly charts both confirm a bullish regime for Target stock. The daily price sits above the EMA20, EMA50 and EMA200, while the hourly chart echoes the same structure. The 15m chart is neutral, indicating a short-term pause.
What are the key support levels to watch for Target stock?
Key support sits at the daily S1 level of 149.48 and the daily EMA20 near 148.90. Below that, the mid-Bollinger Band at 148.17 is the next logical area where buyers would need to step back in.
Why is Target stock’s daily RSI a concern?
The daily RSI14 sits at 71.55, which is firmly in overbought territory. That reading, combined with price just under the upper Bollinger Band, warns of a possible pause or pullback.
What would invalidate the uptrend for Target stock?
A break below the daily S1 at 149.48, or a close back under the daily EMA20 at 148.90, would signal that the rally is losing steam. On the hourly chart, a drop through the pivot at 159.54 and S1 at 158.55 would reinforce a corrective phase.
Disclaimer: This article is for informational purposes only and does not constitute financial advice, an investment recommendation, or a solicitation to buy or sell any financial instrument or cryptocurrency. The analysis provided is not indicative of future results. Investing in crypto assets and financial markets carries a high risk of capital loss. Always do your own research (DYOR) and consult a qualified financial advisor before making any decision.
Article produced with the assistance of artificial intelligence and reviewed by the editorial team.