


弱いデータがあちこちで出る → USD安 → 金が上昇——全体の内訳はこちら*
# 📋 今日の全データを一目で
| 時間 | イベント | 実績 | 予想 | 前回 | バイアス |
| 18:15 | ADP雇用者数変化 | 9.50K | — | 8.30K | 🟡 やや強い |
| 18:30 | 輸出物価指数(前月比) | -1.3% | 0.2% | -0.7% | 🔴 予想を下回り |
| 18:30 | 住宅着工(前月比) | -12.4% | — | +19.7% | 🔴 予想を下回り |
| 18:30 | 住宅着工(総計) | 1.239M | 1.340M | 1.415M | 🔴 予想を下回り |
| 18:30 | 輸入物価指数(前月比) | -0.4% | 0.1% | -0.3% | 🔴 やや弱い |
| 18:30 | 建設許可 | 1.443M | 1.370M | 1.374M | 🟢 予想を上回り |
| 19:15 | 鉱工業生産(前年比) | 1.08% | 1.29% | 1.29% | 🔴 弱い |
| 19:15 | 鉱工業生産(前月比) | 0.2% | 0.3% | 0.3% | 🔴 弱い |
| 20:00 | 住宅販売保留(前月比) | -2.3% | 0.1% | -4.8% | 🔴 弱い |
| 20:20 | アトランタ連銀GDPNow(第3四半期) | 4.0% | 4.3% | 4.3% | 🔴 成長見通し下方修正 |
## 🧠 シンプルルール — これらの数値の読み方
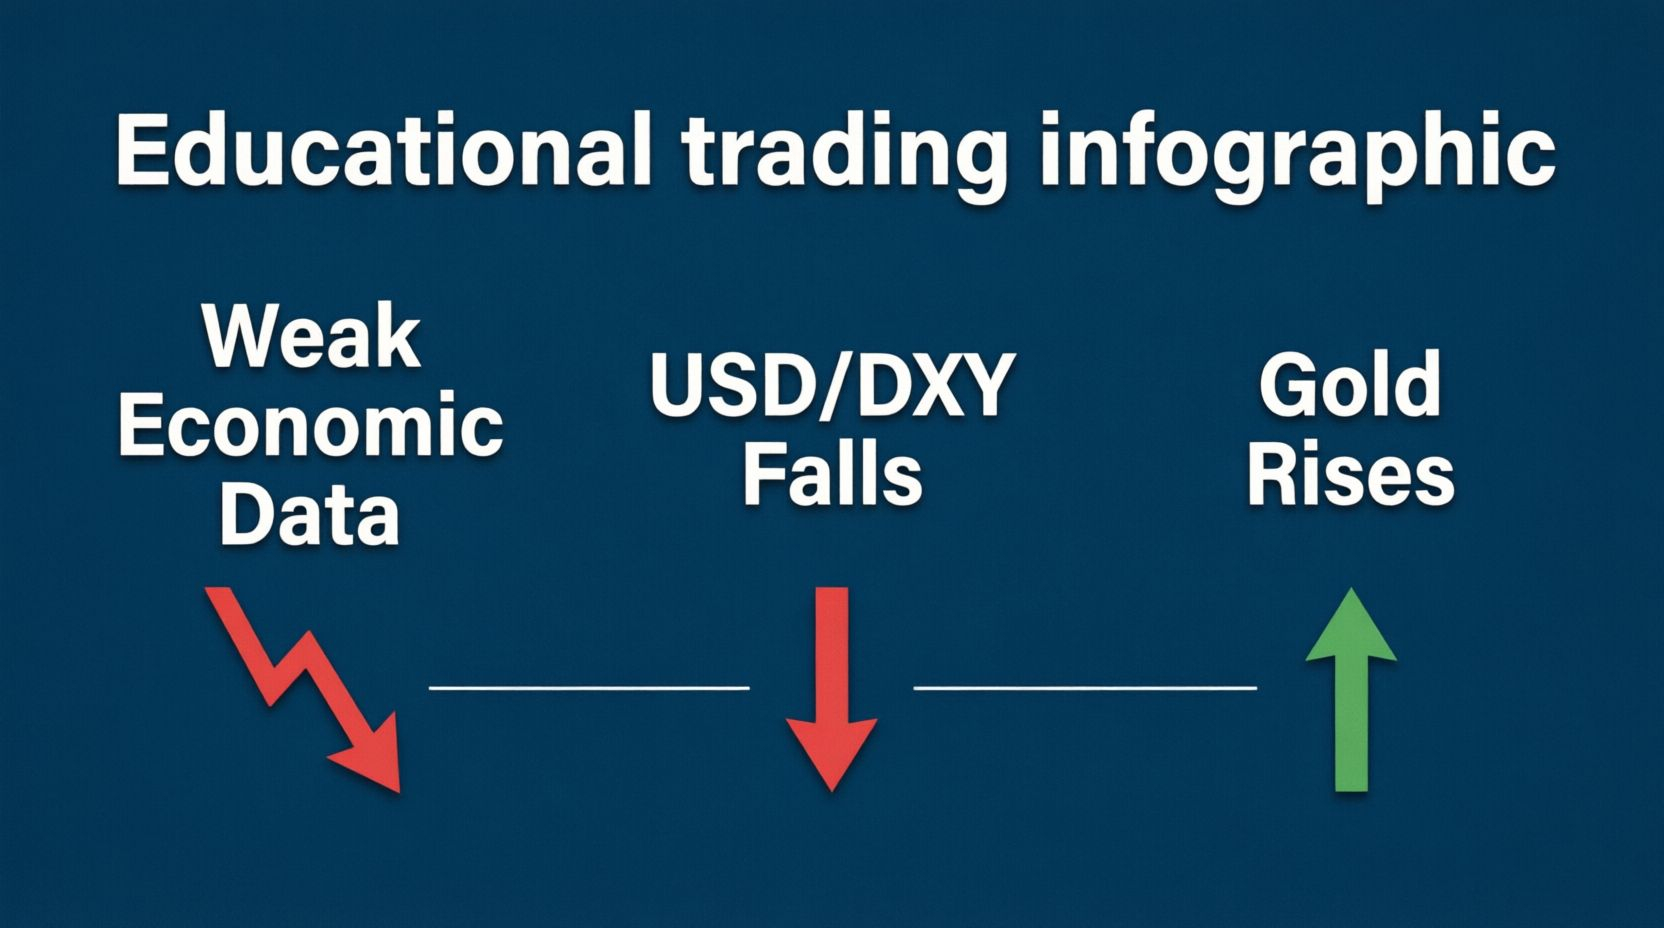
- 🟢 **実績 > 予想** = 強い景気 → USD上昇 → 金/原油は下落
- 🔴 **実績 @ 予想** = 景気弱い → USD下落 → 金/原油は上昇
- 🟡 **予想に近い** = まちまち/横ばい
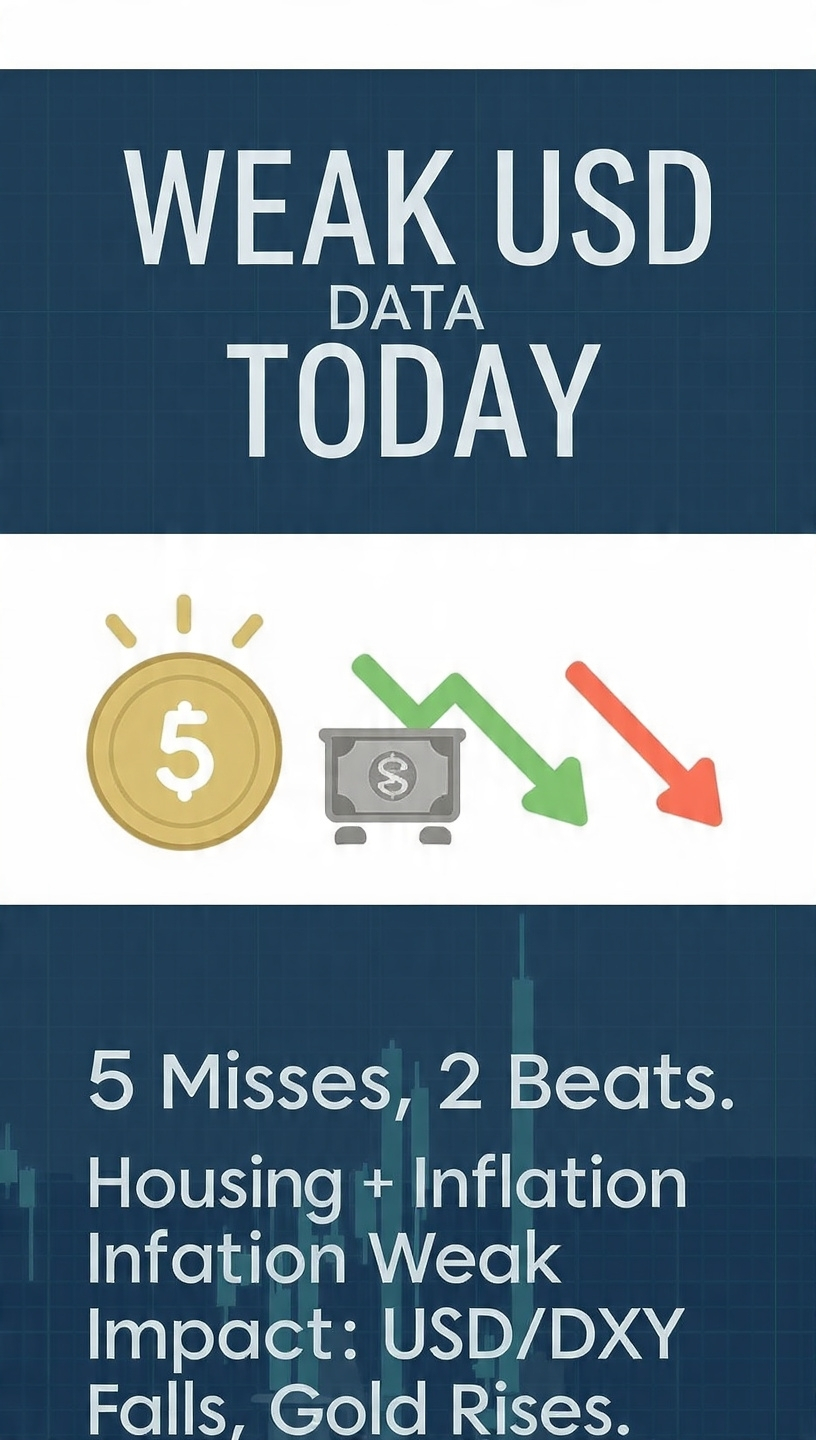
## 📉 今日の結論:いたるところで弱いデータ
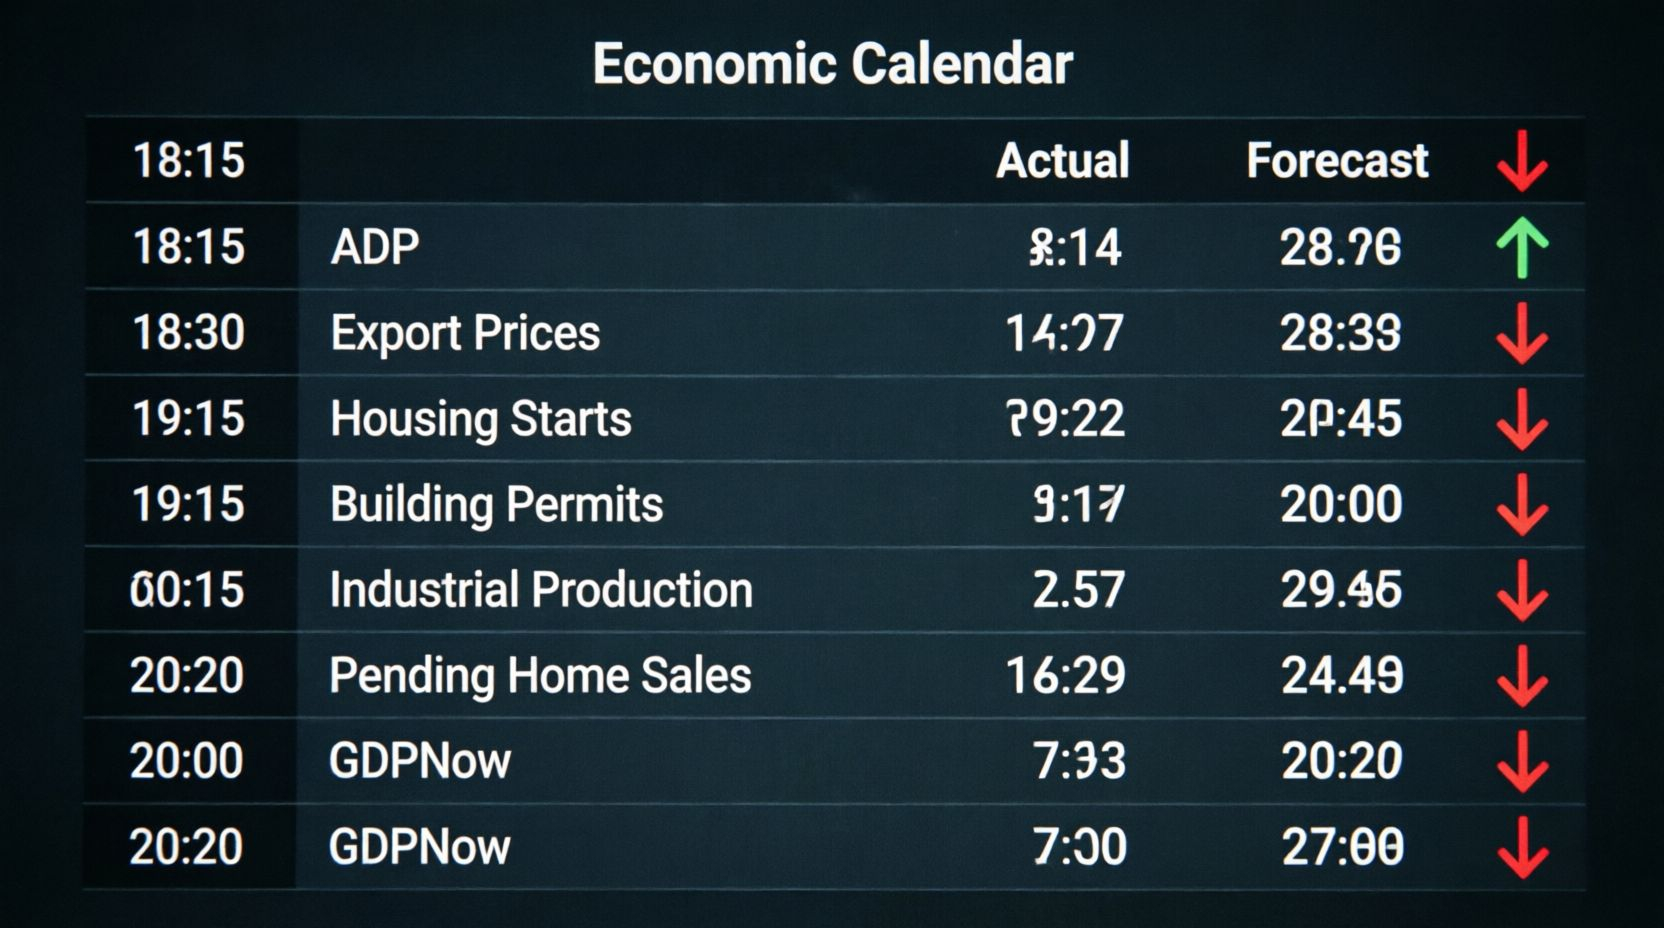
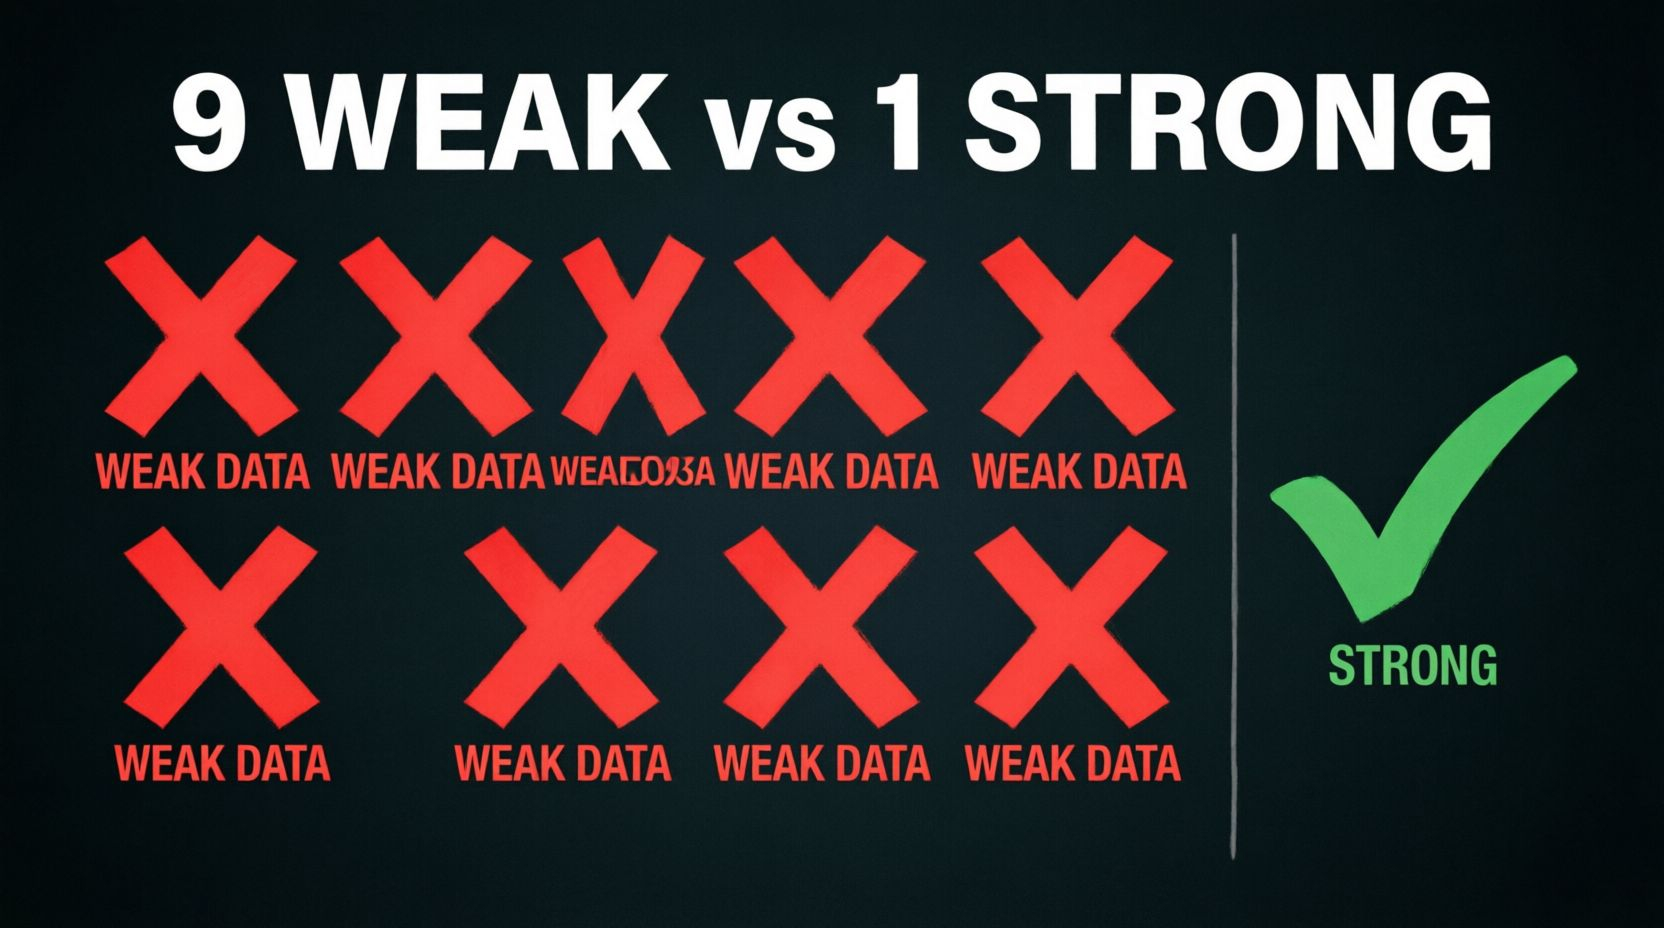
10回中9回の発表が予想を下回りました。上回ったのは建設許可だけ——ただし、それは先行きの住宅データであって、現在の成長ではありません。
- **輸出価格 -1.3%** → 予想を大きく下回る → 物価が落ち着く → 米連銀はより早く利下げする可能性
- **住宅着工 -12.4%** → 前月の上昇のあとで急落 → 不動産が急速に減速
- **鉱工業生産**が弱い → 製造業は想定ほど伸びていない
- **GDPNowが4.0%に引き下げ** → 成長見通しを下方修正
- **住宅販売保留(Pending Home Sales)-2.3%** → 住宅購入需要が弱まる
**結論:** 米国経済は減速の兆しを見せています。成長の鈍化は通常、ドル安と金利上昇(=金に有利な条件)につながります。
📸 *画像が必要:要約ダッシュボード — 🔴 弱い9件 vs 🟢 強い1件。*
---
## 📈 それぞれの市場にとっての意味
### 🪙 金 → 🟢 強気(上昇)
弱いデータ → USD安 → 金は世界の買い手にとって割安になる → 需要が上がる。弱い成長はまた、より早いFRB利下げの確率も高め、それは歴史的に金を支えてきました。
**見通し:** この弱いデータで金は $4,400+ に向かう可能性が高そうです。
### 🛢️ 原油 → ⚖️ まちまち/やや強気
いま働いているのは相反する2つの力です。
- ✅ 弱いUSD → 原油が安くなる → 価格を下支え
- ❌ 住宅、製造業、GDPの弱さ → 景気減速 → 需要の燃料が減る → 圧力
**見通し:** 横ばい〜緩やかな上昇。より明確な方向性には在庫データが必要です。
### 💵 米ドル(DXY)→ 🔴 弱気(下落)
データが一貫して予想を下回ると、トレーダーは『より弱い景気』と『より早いFRB利下げ』を織り込むため——どちらもドルにとっては弱材料です。
**見通し:** DXYに下押し圧力がかかり、それが総じてコモディティを支えます。
: 金 🟢 上昇、原油 ⚖️ まちまち、USD 🔴 下落.*
---
## 🧠 どう取引する?— 私のプラン
1. **発表前:** 予想を確認する——注目すべき数値を把握。
2. **発表時:** 実績と予想を即座に比べる。
- 予想より低い → 金を買う/USDを売る
- 予想より高い → 金を売る/USDを買う
3. **発表後:** 追いかけないでください——最初のスパイクが落ち着くまで5〜15分待ちましょう。
4. **確認:** 2つ以上の高インパクト指標が同じ方向を示すなら、その動きにはより確信が持てます。
今日の9つの弱い指標は、強い方向性のバイアスを示しています——ただし、まず市場が手の内を見せるまで待ちましょう。🛡️
## ⚠️ 重要なリマインダー
- 1つのデータ点だけでは新しいトレンドではありません。でも、多数の弱い数値がそろうと強いシグナルになります。
- USDは先に動きやすく、金が後からついてきます——DXYチャートをニュースと一緒に監視しましょう。
- 市場は素早く反転します——明日のデータが強ければ、今日の値動きは消える可能性があります。
- 必ずストップロスを使う — 指標発表は両方向に急なスパイクを起こします。
---
*これは個人的な分析であり、金融アドバイスではありません。必ず自分で調べてください。経済指標はボラティリティを生みます——適切なリスク管理で取引しましょう。*
**タグ:** #USD #DXY #GOLD #OIL #XAUUSD #EconomicCalendar #NewsTrader #MarketAnalysis
---
## 📋 画像チェックリスト(5点)
1. ヘッダー — カレンダー+マーケットダッシュボード(1920×500)
2. カレンダーの全画面スクリーンショット(あなたの2つの結合画像)
3. シンプルなルールの図解 — 強い/弱い → USD → 金への影響
4. 要約 — 🔴 弱い9件 vs 🟢 強い1件
5.
市場への影響 — 金上昇/原油はまちまち/USD下落
免責事項:これは私の意見にすぎず、金融的な安全性を保証するものではありません。起こる可能性もあれば、起こらない可能性もあります。ただし、これはルールです。