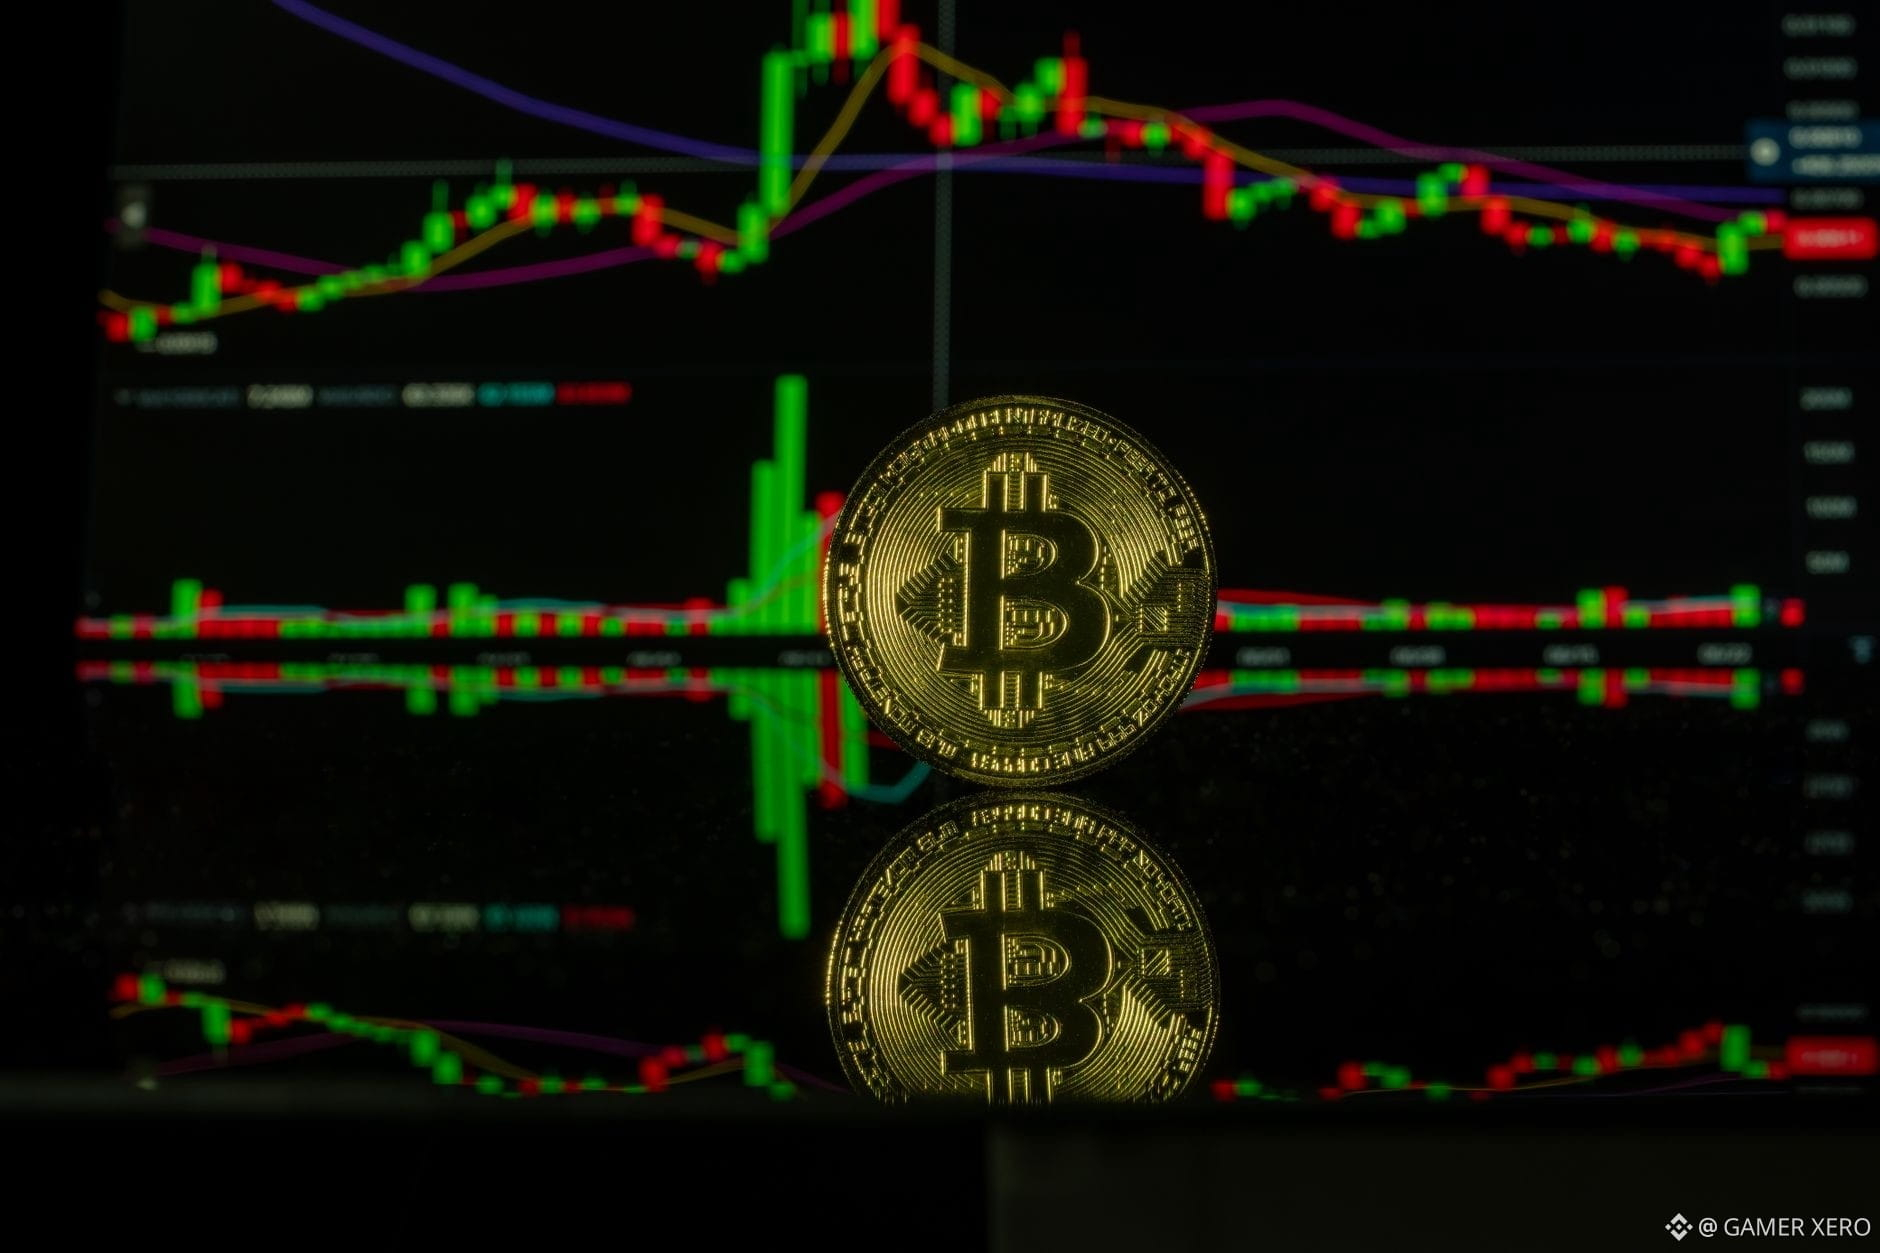
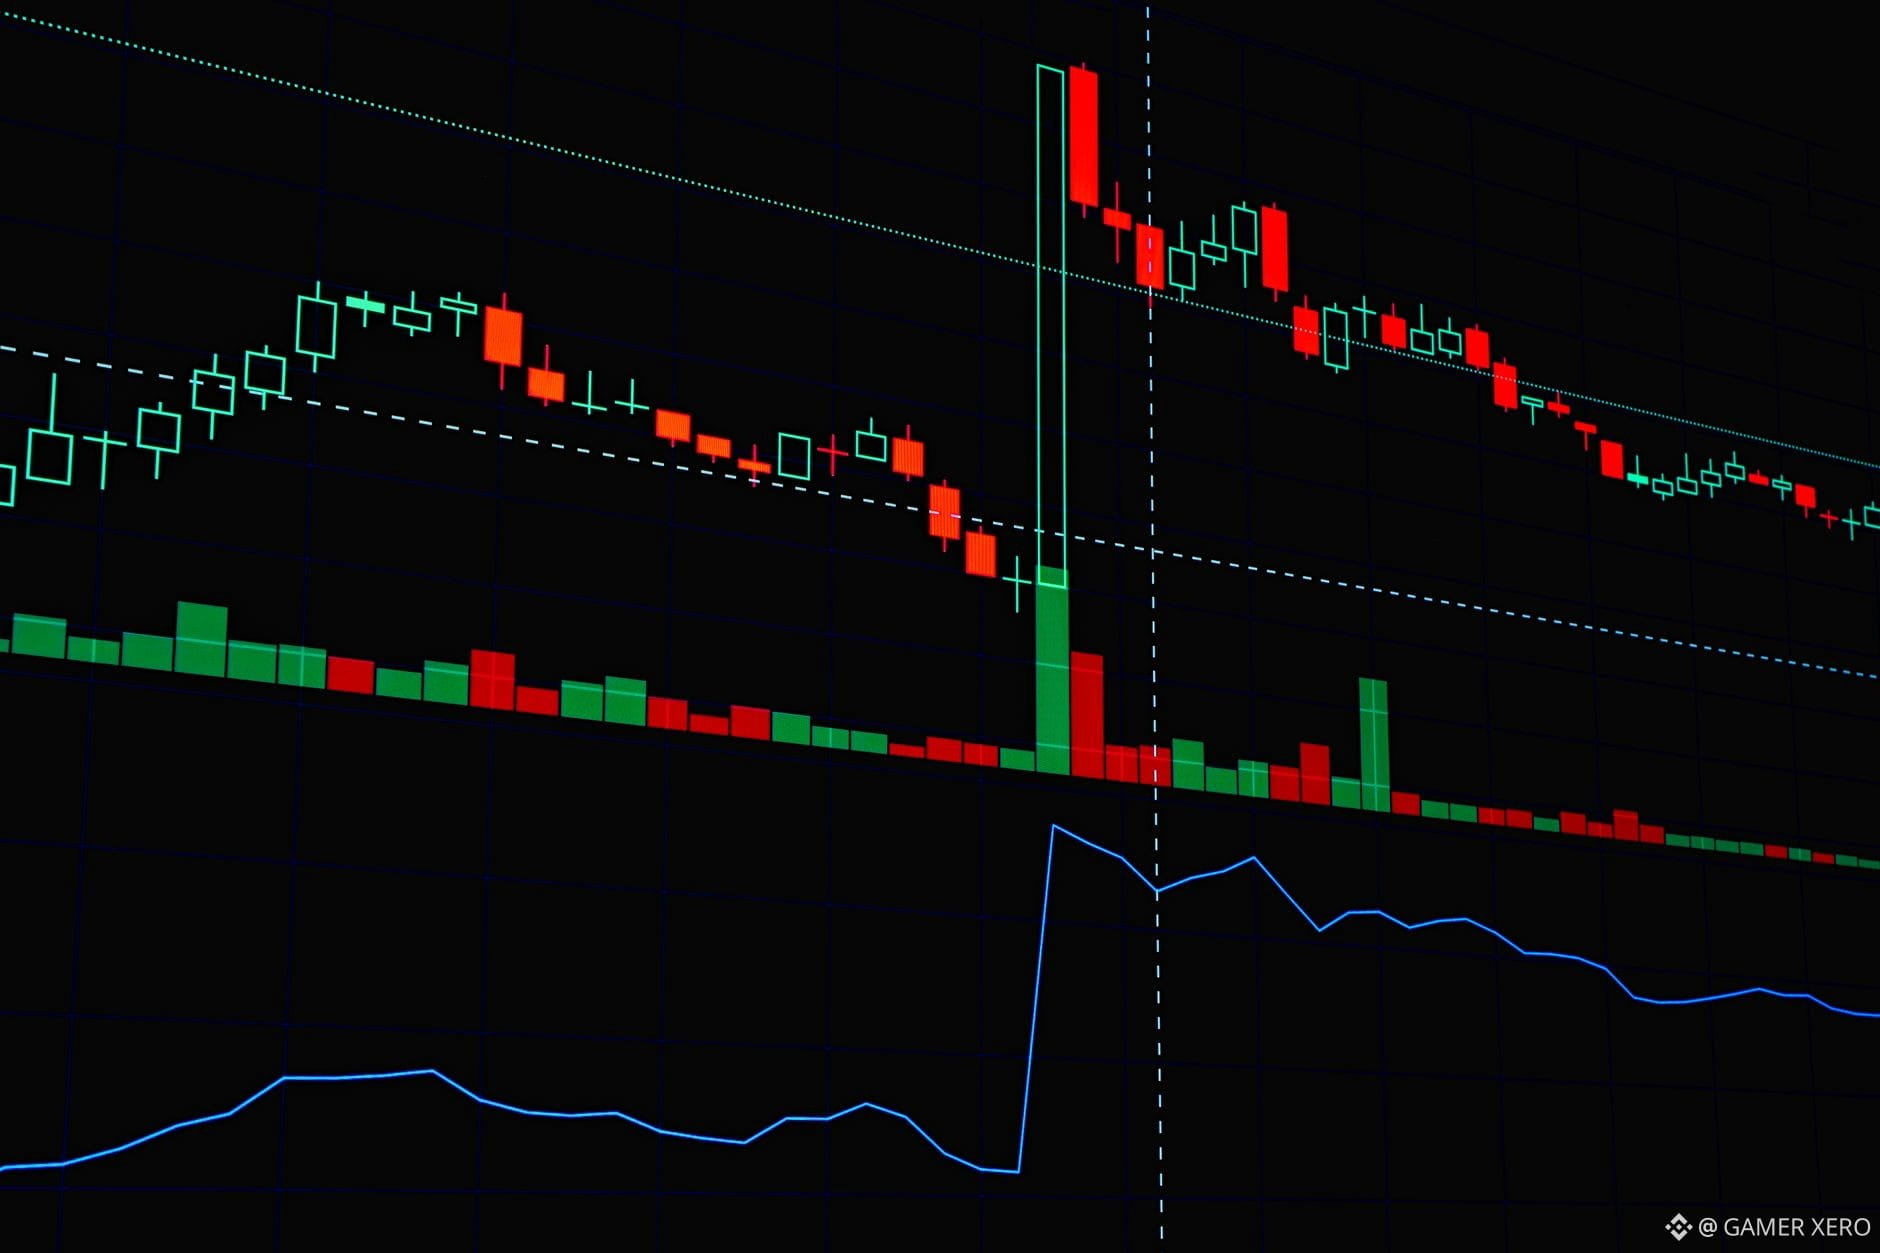
Binanceで$64,204のところに$BTC があり、24時間のレンジが$63,806〜$64,929であることは、価格の方向性以上の情報を教えてくれます。現物ペアの板(オーダーブック)の厚みを見てください。現在価格のすぐ下にある指値買い注文の総量と、数ティック上の売りウォール(厚い売り板)を比較します。たとえば、買い側が$64,150〜$64,200の範囲で150BTCを支えていて、最も近い売りウォールが$64,300で80BTCだとすると、市場は買い圧力に傾いています。この需給の不均衡は、価格が現在水準近辺に張り付くことが多く、下値は抑えられつつ、上昇余地は控えめな天井になりやすいです。
同じ考え方は$ETH にも当てはまります。厚みを見ると、$1,880〜$1,885に200ETHのまとまりがあり、売り側は$1,900あたりに90ETHと薄めです。売りを吸収できる流動性が多い場合、価格は狭いレンジにとどまりやすく、これは直近の1.12%下落はあったもののレンジは安定している状況と一致します。
これらの厚みスナップショットを毎時間追跡すると、不均衡が反転するタイミングを見つけやすくなります。ブレイクアウトや押し戻しが近づいている早期のサインになり得ます。ポジションのサイズを調整する前に、どれくらいの頻度で板の厚みを確認していますか?
#CryptoEducation #OrderBook #TraderTools #GAMERXERO
同じ考え方は$ETH にも当てはまります。厚みを見ると、$1,880〜$1,885に200ETHのまとまりがあり、売り側は$1,900あたりに90ETHと薄めです。売りを吸収できる流動性が多い場合、価格は狭いレンジにとどまりやすく、これは直近の1.12%下落はあったもののレンジは安定している状況と一致します。
これらの厚みスナップショットを毎時間追跡すると、不均衡が反転するタイミングを見つけやすくなります。ブレイクアウトや押し戻しが近づいている早期のサインになり得ます。ポジションのサイズを調整する前に、どれくらいの頻度で板の厚みを確認していますか?
#CryptoEducation #OrderBook #TraderTools #GAMERXERO