

#nfp
nfp
閲覧回数 38.3M
265,781人が討論中
注目
最新


·
--
翻訳参照
The NFP wait is exhausting. Markets are frozen ahead of the 12:30 UTC release. We have a 145K jobs forecast and a 4.2% unemployment target. $NEAR is idling at 4.462 but it is all noise until we see that ±6% institutional orderbook expansion. I am keeping my hands off until the data confirms a real macro signal. No reason to force a move here. $BTC
#NFP #MacroData #NEAR
#NFP #MacroData #NEAR
1
2

翻訳参照
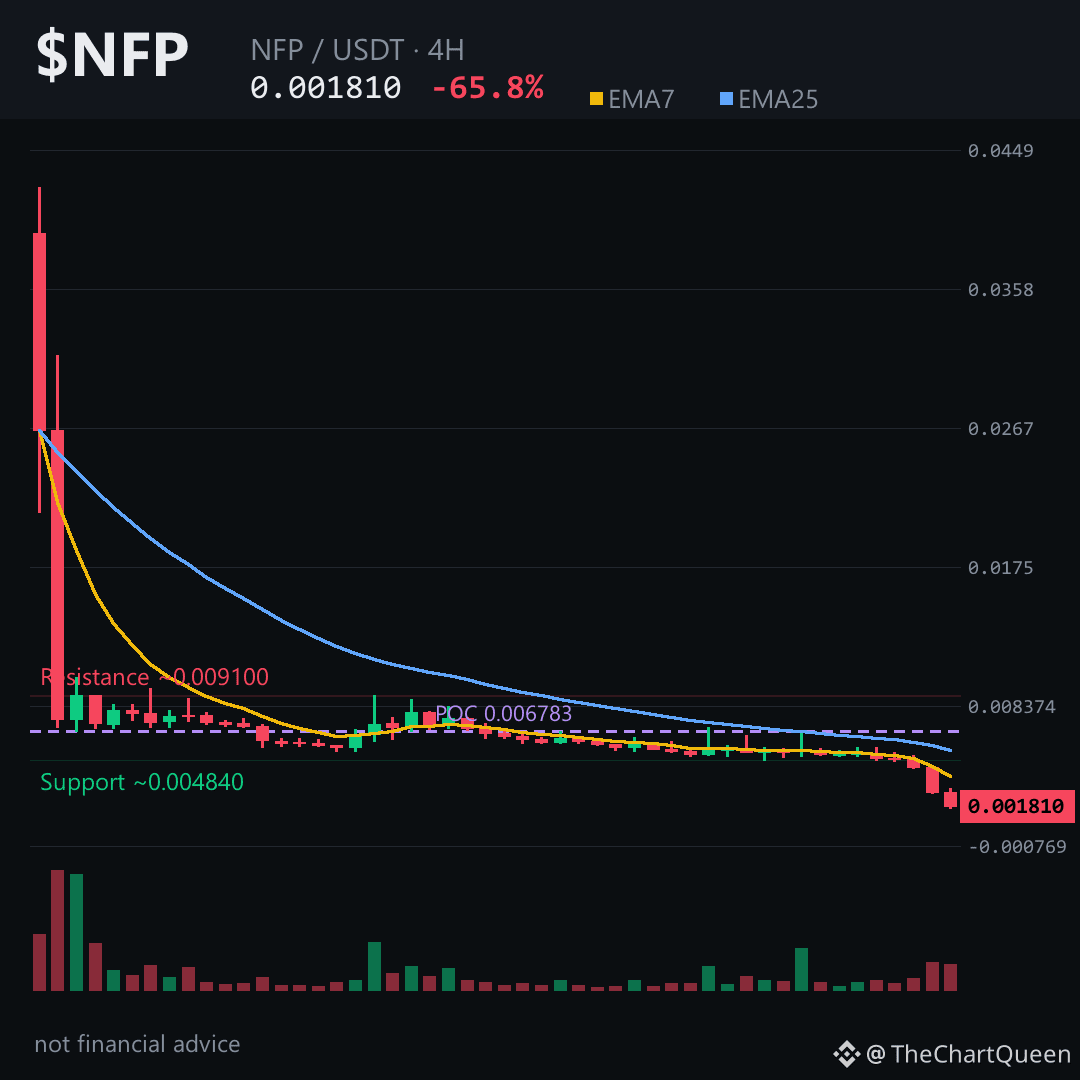
What just happened to $NFP?
A 65% single-day collapse, with the last two candles alone shedding over 70% of their value. That's not a correction. That's a liquidation cascade in real time — and the chart is asking one uncomfortable question: is there any floor left?
The 4-hour RSI is near 12.9 — heavily oversold, but in a true breakdown, oversold can stay oversold for days. The short-term moving average has collapsed far below the longer one; momentum is still pointing straight down.
Futures data reads like a ghost town — zero funding, zero open interest. Liquidity has evaporated. This isn't a crowded short; it's a market abandoned mid-crash.
The level that matters now is around 0.0019. That's the invalidation zone — the line in the sand where this bearish read would simply be wrong. As long as price stays below that area on the 4-hour chart, the path of least resistance points toward the 0.00165 zone, and potentially lower if momentum persists.
My read: this is a falling knife with no visible hand to catch it yet. The real risk isn't missing a bounce — it's mistaking a dead-cat twitch for a reversal. Tap $NFP to pull up the chart and see how far price is from that 0.0019 line.
Follow me here — when this level breaks or holds, I'll be breaking down what it means before the next candle closes.
What's the first sign you'd want to see before trusting any bounce in $NFP? 👇
⚠️ Not financial advice. DYOR.
#NFP #Crypto #BinanceSquare #Altcoins
86

·
--
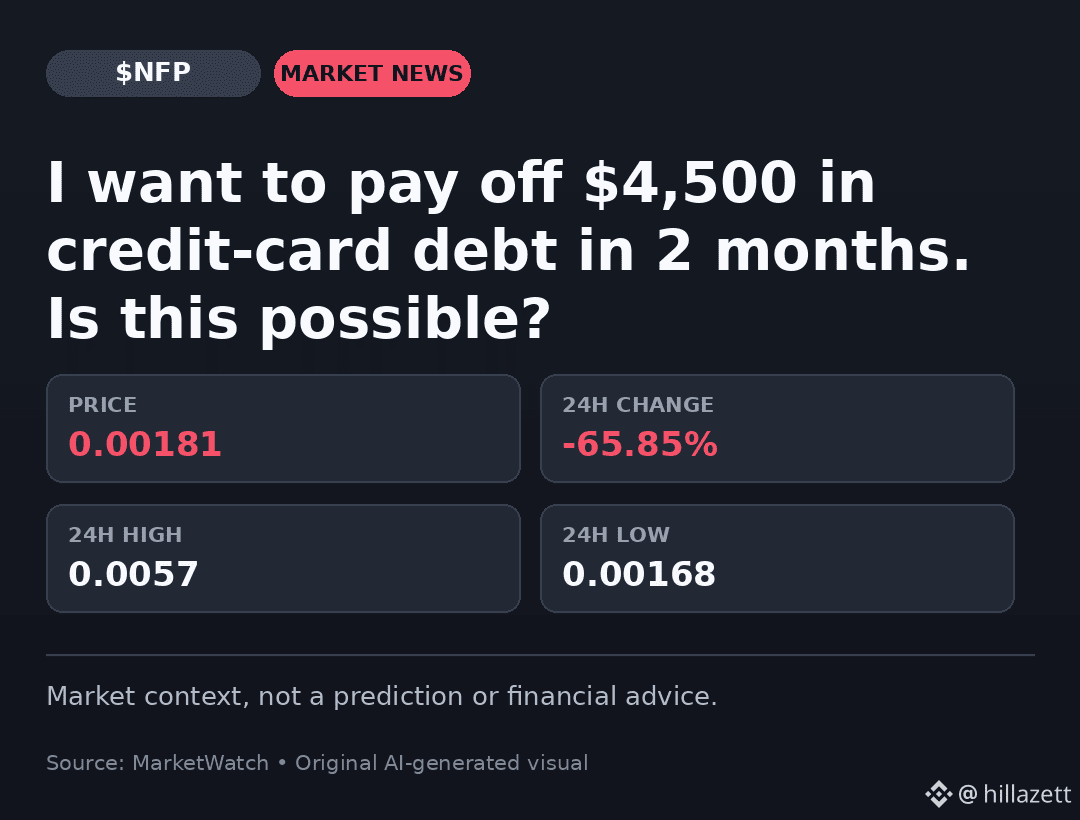
家計債務への不安がニュースの見出しを飾り、クレジットカードの残高4,500ドルをわずか2か月でどう返済するか、という声が上がっています。一方、高ベータの暗号資産には、息をつく余裕もありません。
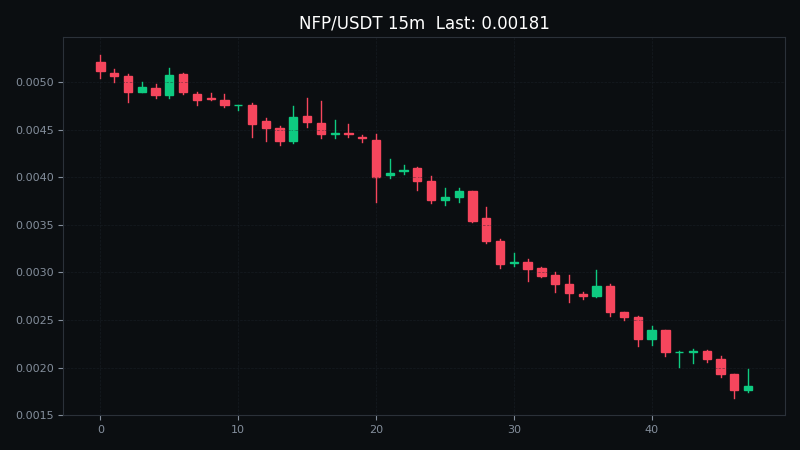
$NFPは65.85%下落し、現在は約0.00181で取引されています。取引高は383万ドルで、0.0057から0.00168の間を行き来し、変動幅は222.10%に達しました。
あらゆる場所で流動性が縮小すると、値動きは激しくなります。守りに徹していますか? #NFP #CryptoMarket
家計債務への不安がニュースの見出しを飾り、クレジットカードの残高4,500ドルをわずか2か月でどう返済するか、という声が上がっています。一方、高ベータの暗号資産には、息をつく余裕もありません。
$NFPは65.85%下落し、現在は約0.00181で取引されています。取引高は383万ドルで、0.0057から0.00168の間を行き来し、変動幅は222.10%に達しました。
あらゆる場所で流動性が縮小すると、値動きは激しくなります。守りに徹していますか? #NFP #CryptoMarket
$NFPは65.85%下落し、現在は約0.00181で取引されています。取引高は383万ドルで、0.0057から0.00168の間を行き来し、変動幅は222.10%に達しました。
あらゆる場所で流動性が縮小すると、値動きは激しくなります。守りに徹していますか? #NFP #CryptoMarket
29
·
--
今日はNFPの発表を控え、マクロ要因が主役です。12:30 UTCのボラティリティが高まる時間帯を待つ間、$BTC の価格を80870.42で追っています。雇用者数は145K~150K、失業率は4.2%との予想です。前回の賃金上昇率が0.4%だったことを踏まえ、データ発表後には機関投資家のオーダーブックが6%大幅に拡大すると予想しています。今は辛抱が肝心です。_
#NFP #MacroData #BTC
今日はNFPの発表を控え、マクロ要因が主役です。12:30 UTCのボラティリティが高まる時間帯を待つ間、$BTC の価格を80870.42で追っています。雇用者数は145K~150K、失業率は4.2%との予想です。前回の賃金上昇率が0.4%だったことを踏まえ、データ発表後には機関投資家のオーダーブックが6%大幅に拡大すると予想しています。今は辛抱が肝心です。_
#NFP #MacroData #BTC
#NFP #MacroData #BTC
1
2
·
--
マクロ市場の動向を追うため、夜更かししています。$LINK は12.014で安定していますが、皆の注目はNFPの発表に集まっています。市場予想は145K~150K、失業率は4.2%、賃金上昇率は0.3%と見ています。この12:30 UTCの時間帯は、機関投資家のオーダーブックが急速に拡大することが多いため、相場が落ち着くまで様子見します。$BTC
_
#NFP #MacroData #LINK
マクロ市場の動向を追うため、夜更かししています。$LINK は12.014で安定していますが、皆の注目はNFPの発表に集まっています。市場予想は145K~150K、失業率は4.2%、賃金上昇率は0.3%と見ています。この12:30 UTCの時間帯は、機関投資家のオーダーブックが急速に拡大することが多いため、相場が落ち着くまで様子見します。$BTC
_
#NFP #MacroData #LINK
_
#NFP #MacroData #LINK
1
1

·
--
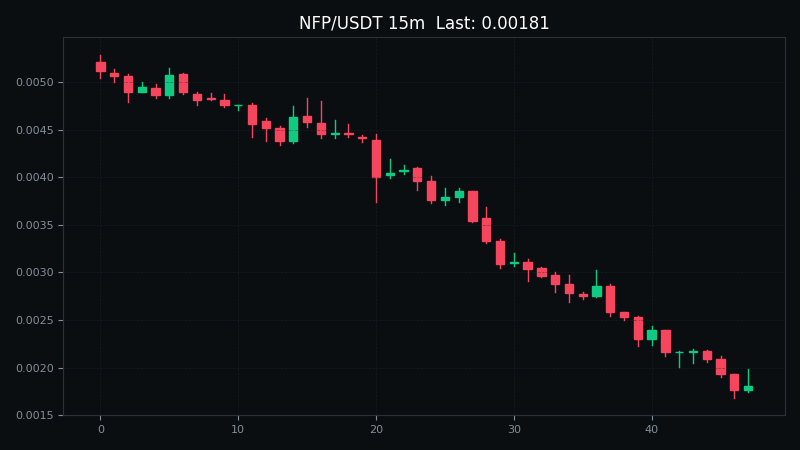
取引高3,834,192 USDTから見る$NFP:24時間で65.8%下落。
常識に反する真実があります。取引高が最大になるときは、必ずしも絶好の買い場ではなく、意見の対立が最も激しいときであることが多いのです。強気派が買い、弱気派が売る——激しい売買が繰り広げられます。本当にトレンドが確認されるのは、売買が一巡した後も方向性が明確なときです。
取引高が急増した後、あなたは追いかけて買いますか?それとも様子を見ますか?#NFP
この内容は情報交換のみを目的としており、投資助言ではありません。
取引高3,834,192 USDTから見る$NFP:24時間で65.8%下落。
常識に反する真実があります。取引高が最大になるときは、必ずしも絶好の買い場ではなく、意見の対立が最も激しいときであることが多いのです。強気派が買い、弱気派が売る——激しい売買が繰り広げられます。本当にトレンドが確認されるのは、売買が一巡した後も方向性が明確なときです。
取引高が急増した後、あなたは追いかけて買いますか?それとも様子を見ますか?#NFP
この内容は情報交換のみを目的としており、投資助言ではありません。
常識に反する真実があります。取引高が最大になるときは、必ずしも絶好の買い場ではなく、意見の対立が最も激しいときであることが多いのです。強気派が買い、弱気派が売る——激しい売買が繰り広げられます。本当にトレンドが確認されるのは、売買が一巡した後も方向性が明確なときです。
取引高が急増した後、あなたは追いかけて買いますか?それとも様子を見ますか?#NFP
この内容は情報交換のみを目的としており、投資助言ではありません。

·
--
#IOST/R/USDT #NFP/R/USDT
IOSTとNFPは、最も高い取引ポテンシャルを持っています。#RSIの値が低いIOSTは、買いのリスクを軽減します。#RSIの値が高く、24時間の出来高が急増しているNFPは、売りのリスクを低減します。ただし、他の要因も考慮する必要があります。
#IOST/R/USDT #NFP/R/USDT
IOSTとNFPは、最も高い取引ポテンシャルを持っています。#RSIの値が低いIOSTは、買いのリスクを軽減します。#RSIの値が高く、24時間の出来高が急増しているNFPは、売りのリスクを低減します。ただし、他の要因も考慮する必要があります。
IOSTとNFPは、最も高い取引ポテンシャルを持っています。#RSIの値が低いIOSTは、買いのリスクを軽減します。#RSIの値が高く、24時間の出来高が急増しているNFPは、売りのリスクを低減します。ただし、他の要因も考慮する必要があります。
234
·
--
##IOST
テクニカル分析:24時間変動率は92.42%、RSIは72.92で、IOSTが買われすぎの領域から脱する可能性を示しています。
##NFP
テクニカル分析:24時間で65.85%下落し、RSIは7.53です。NFPは売られすぎの領域で推移しており、反発が期待されます。
##IOST
テクニカル分析:24時間変動率は92.42%、RSIは72.92で、IOSTが買われすぎの領域から脱する可能性を示しています。
##NFP
テクニカル分析:24時間で65.85%下落し、RSIは7.53です。NFPは売られすぎの領域で推移しており、反発が期待されます。
テクニカル分析:24時間変動率は92.42%、RSIは72.92で、IOSTが買われすぎの領域から脱する可能性を示しています。
##NFP
テクニカル分析:24時間で65.85%下落し、RSIは7.53です。NFPは売られすぎの領域で推移しており、反発が期待されます。
149
24時間で−65.85%。
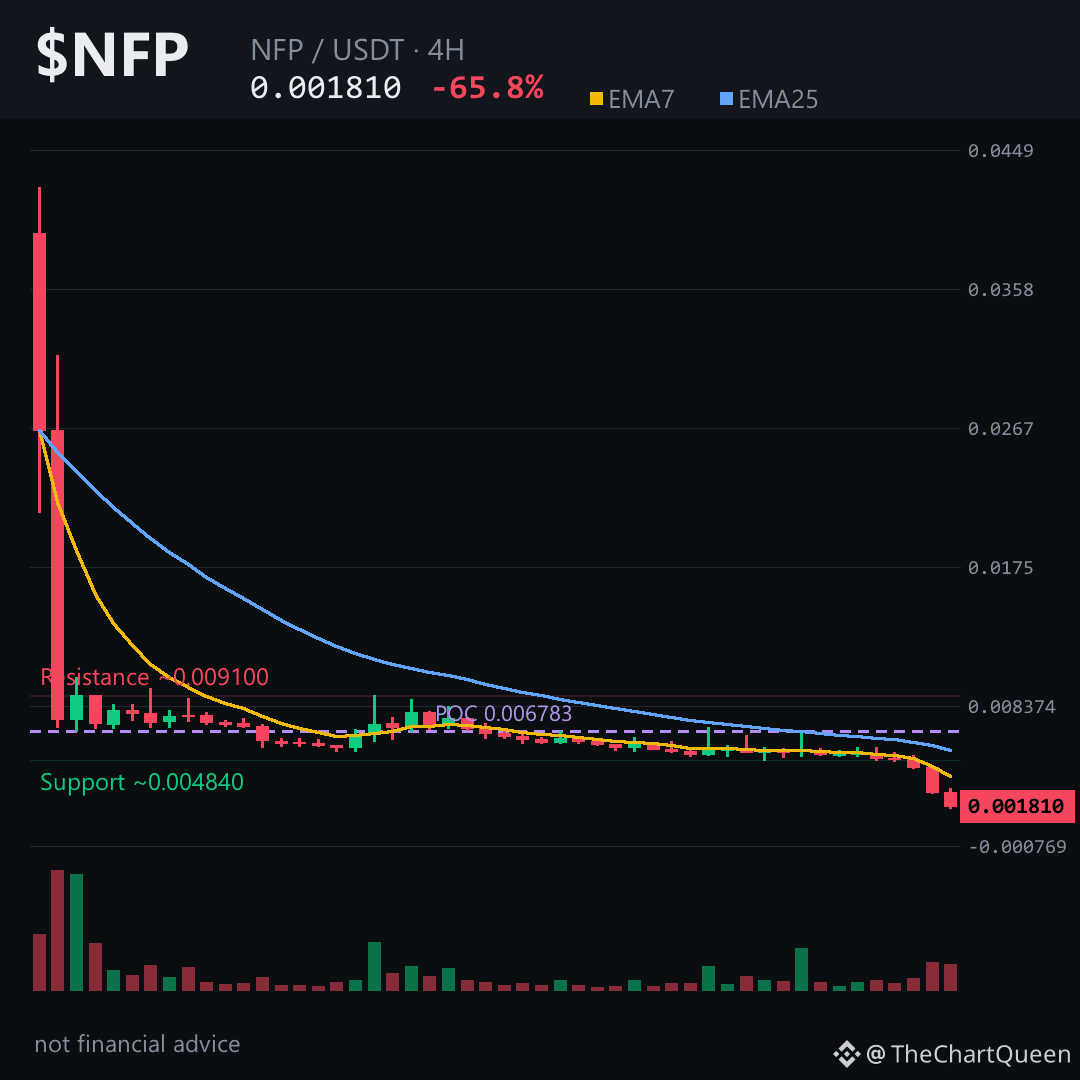
この数字だけでも、底を打ったと判断する前に立ち止まるべきです。4時間足チャートでは、価格が0.00479〜0.00445の弱気ギャップを突き抜けて急落しました。まだ埋まっていないこの空白は、今や上値抵抗として機能しています。4時間足のRSIは12.89と大幅な売られすぎ水準ですが、下降トレンドでは、売られすぎは単に売りがまだ終わっていないことを意味する場合がよくあります。モメンタムは加速しています。
4時間足で、$NFPは0.00181付近で取引されています。無効化ゾーンは0.00191前後です。4時間足の終値がこの水準を上回れば、目先の弱気見通しは弱まります。下値の目標ゾーンは0.00165付近まで広がっており、24時間安値の0.00168と一致します。ここが重要な境界線です。ここを割り込めば、さらに下まで構造的なサポートはありません。
先物市場の流動性に支えられていない、落ちてくるナイフのような状況です。資金調達率は横ばいで、建玉も実質ゼロ。つまり、踏み上げられるようなショートの偏りはありません。現時点では、構造的な裏付けのない反発を拾いにいくリスクがあります。$NFPをタップしてチャートを開き、このギャップを自分の目で確認してください。
0.00165ゾーンが試されるか、反発するか、その後の動きを追うためにフォローしてください。$NFPで注目している水準はどこですか? 👇
⚠️ 金融アドバイスではありません。ご自身で調査してください。
#NFP #Altcoins #Crypto #BinanceSquare
14
·
--
翻訳参照
Understanding the difference between a percentage drop and an intraday range is crucial in crypto.
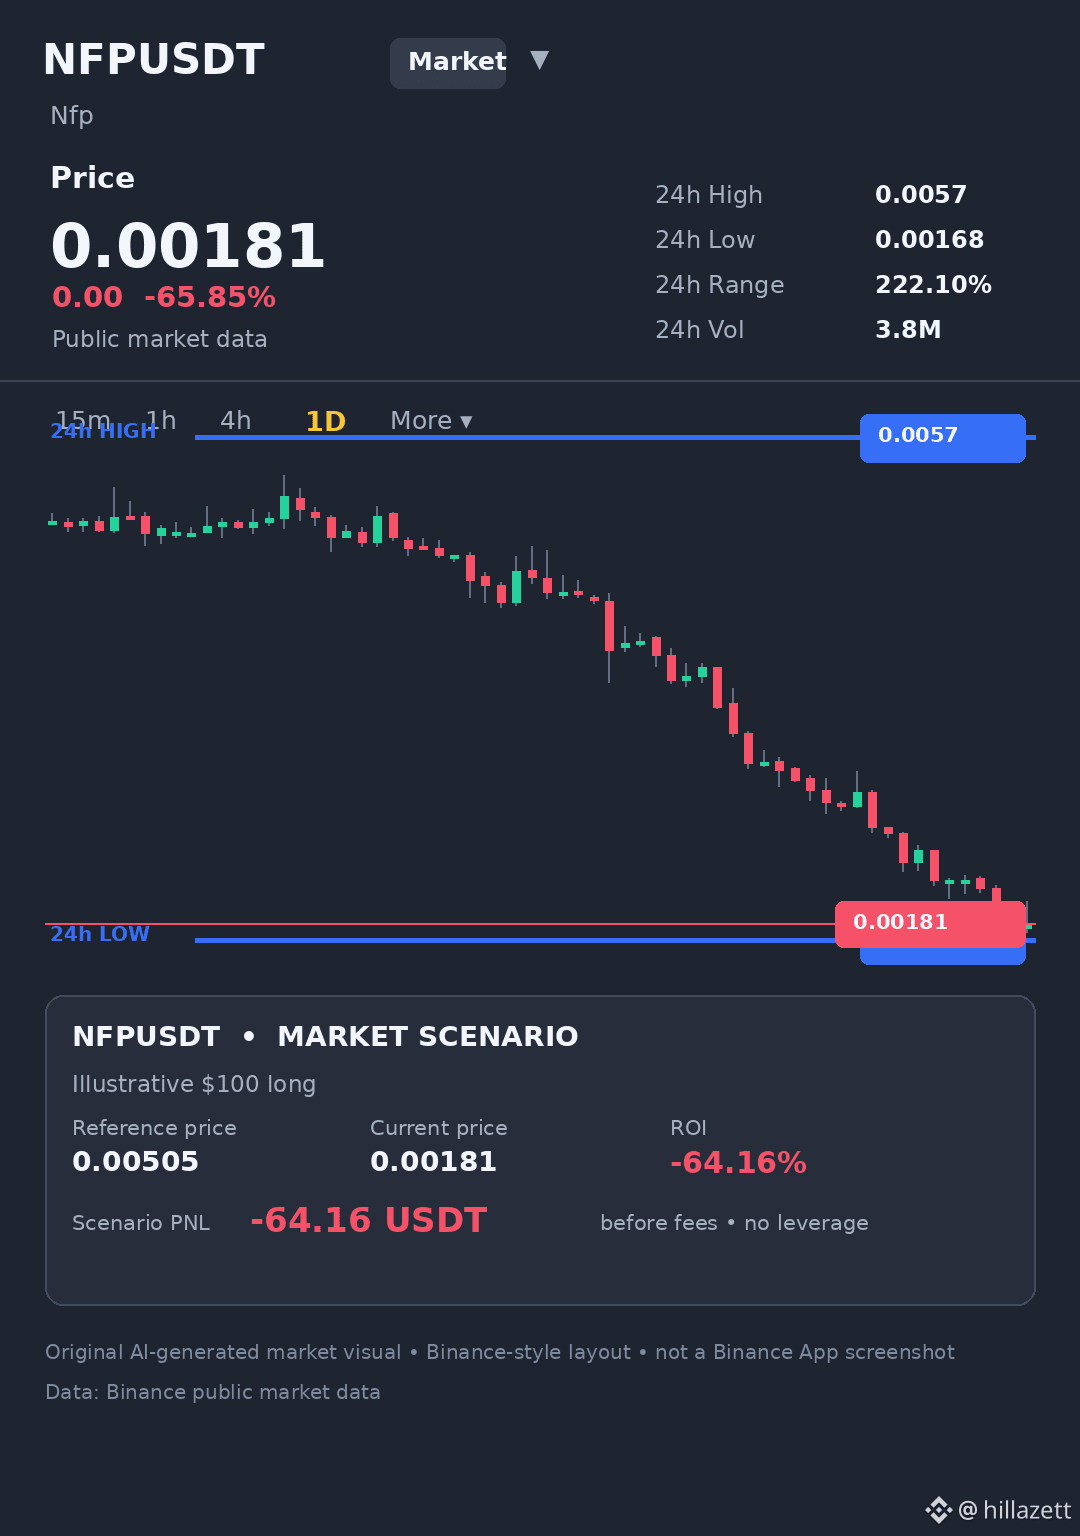
$NFP dropped 65.85% to 0.00181, but its high-to-low spread between 0.0057 and 0.00168 represents a massive 222.10% range on $3.83M volume. Measuring from the bottom up highlights just how violent intraday expansion can be.
Does range expansion change your position sizing? #NFP #CryptoEducation
$NFP dropped 65.85% to 0.00181, but its high-to-low spread between 0.0057 and 0.00168 represents a massive 222.10% range on $3.83M volume. Measuring from the bottom up highlights just how violent intraday expansion can be.
Does range expansion change your position sizing? #NFP #CryptoEducation
75
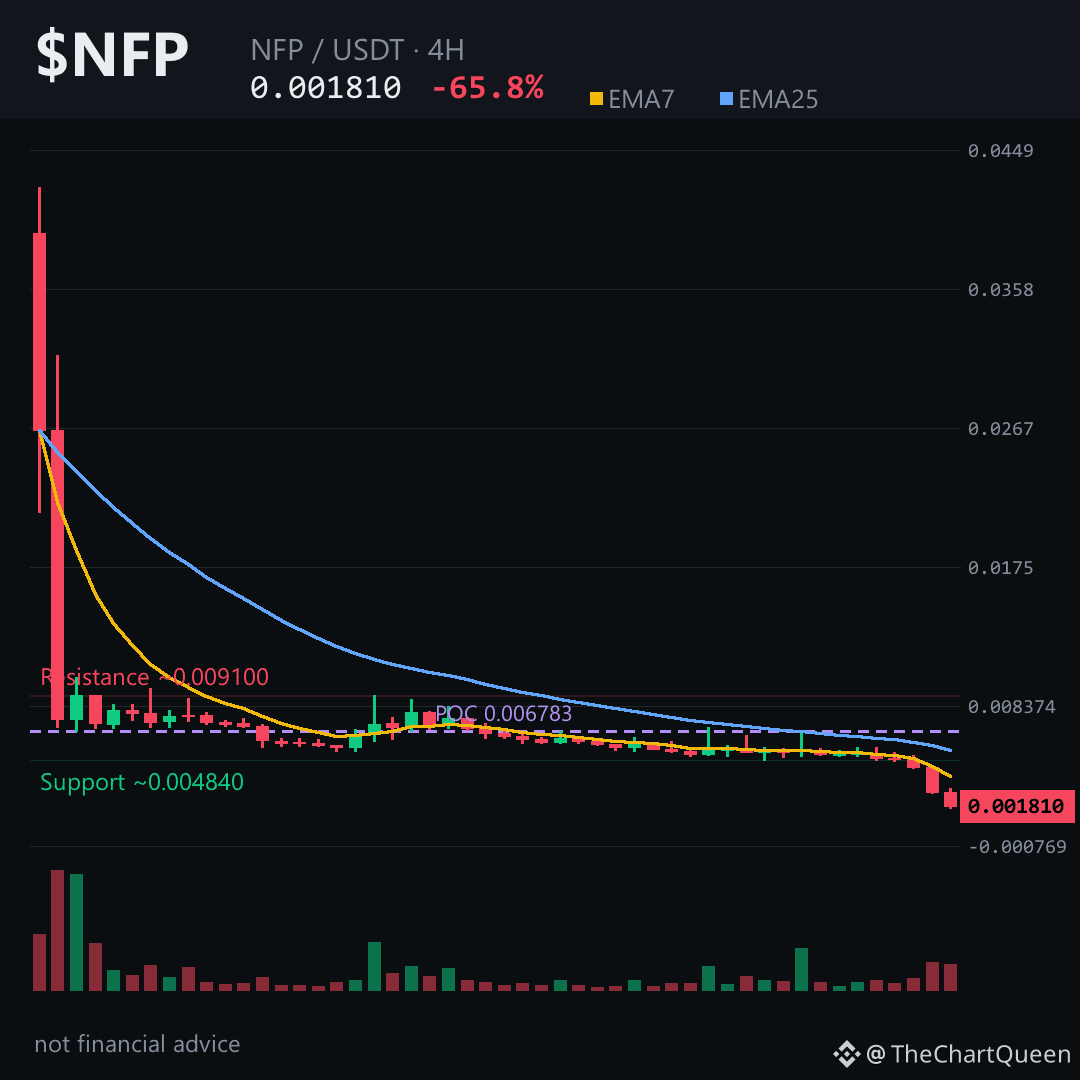
24時間で65%の大暴落——そして4時間足のRSIは12.89。
これは単なる押し目ではありません。構造を根本からリセットする動きで、チャートは次の展開について、ある具体的なサインを示しています。
直近8時間のうち、2本のローソク足が大きな打撃を与えました。37%の急落に続き、さらに34%下落。リアルタイムで強制清算とパニック売りが起きています。
ただ、RSIがここまで低いと、通常は強く反発します。問題は、その反発が売りに押されるのか、それとも実際に持ちこたえるのかです。
0.00445〜0.00479にある弱気のフェアバリューギャップは、上方にまだ大きく残っています。未充填の非効率な価格帯で、価格は次の動きを決める前に、こうした領域へ戻ることがよくあります。
無効化ゾーンは0.00191付近です。$NFPが4時間足の終値でこの水準を回復できなければ、抵抗の少ない方向は引き続き下です。
下値では、0.00165が最初の明確な目標です。このフラッシュの最後の下落が勢いを失う可能性がある水準です。
モメンタムは明らかに弱気ですが、目先の下落余地はおそらくもう限られています。本当のリスクは、トレンドが再開する前に、遅れてショートしたトレーダーを捕まえるような、急激な平均回帰のヒゲです。
$NFPをタップしてチャートを開き、このギャップが実際にどれほど大きいか確認しましょう。
注目しているのはどちらの水準ですか? 0.0045付近の上のギャップ、それとも0.00165付近の下値目標? 👇
このチャートの次の分析もお見逃しなく。
⚠️ 金融アドバイスではありません。ご自身で調査してください。
#NFP #Crypto #BinanceSquare
68
·
--
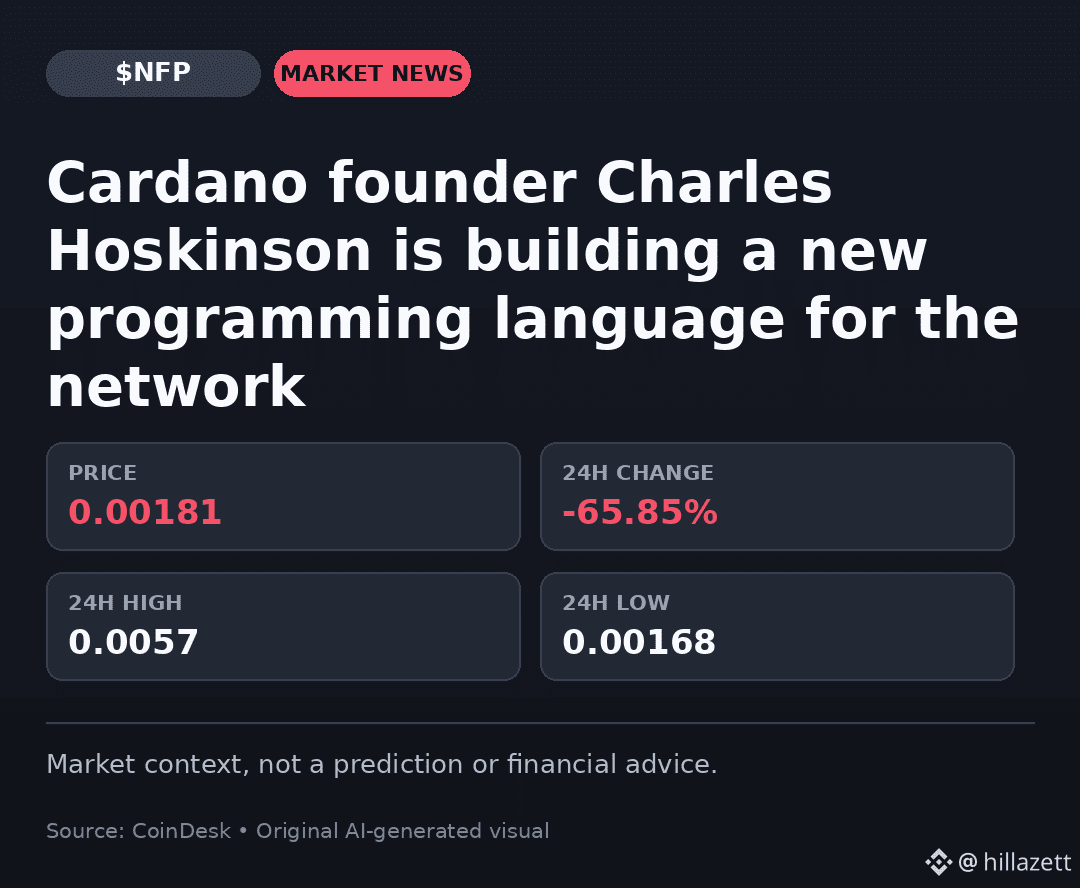
Charles Hoskinson氏はCardano向けの新しいプログラミング言語を開発していますが、今日の市場の厳しい現実が重くのしかかっています。
$NFPは65.85%下落して0.00181となり、出来高が383万ドルを超える中、0.0057から0.00168の間で推移し、222.10%の値幅を記録しました。安値に張り付くような状況で、短期的な売り圧力は依然として強いままです。
エコシステムの開発に注目していますか?それとも、この激しい値動きを見守っていますか? #CryptoNews #NFP
Charles Hoskinson氏はCardano向けの新しいプログラミング言語を開発していますが、今日の市場の厳しい現実が重くのしかかっています。
$NFPは65.85%下落して0.00181となり、出来高が383万ドルを超える中、0.0057から0.00168の間で推移し、222.10%の値幅を記録しました。安値に張り付くような状況で、短期的な売り圧力は依然として強いままです。
エコシステムの開発に注目していますか?それとも、この激しい値動きを見守っていますか? #CryptoNews #NFP
$NFPは65.85%下落して0.00181となり、出来高が383万ドルを超える中、0.0057から0.00168の間で推移し、222.10%の値幅を記録しました。安値に張り付くような状況で、短期的な売り圧力は依然として強いままです。
エコシステムの開発に注目していますか?それとも、この激しい値動きを見守っていますか? #CryptoNews #NFP
51

·
--
翻訳参照
$NFP -65.85% | $EPIC +16.35% | $PEPE +5.14%
#NFP slipped to $0.00181000, a sharp ‑65.85% move on $3.8 M of volume. The token fuels the NFPrompt Platform, an AI‑powered UGC hub for tokenized AIGC, so the decline may reflect broader AI‑project volatility.
#EPIC rose to $0.3024, gaining +16.35% with $3.7 M changing hands. The rebound suggests renewed interest after a recent dip, though the upside could be limited by overall market breadth.
#PEPE ticked up to $0.00000409, up +5.14% on a hefty $24.0 M of volume. The modest lift amid strong trading hints at lingering speculative pressure.
👀 Watch how NFP’s AI‑UGC narrative holds up if market sentiment swings back toward risk‑on assets.
#Write2Earn #Binance
9
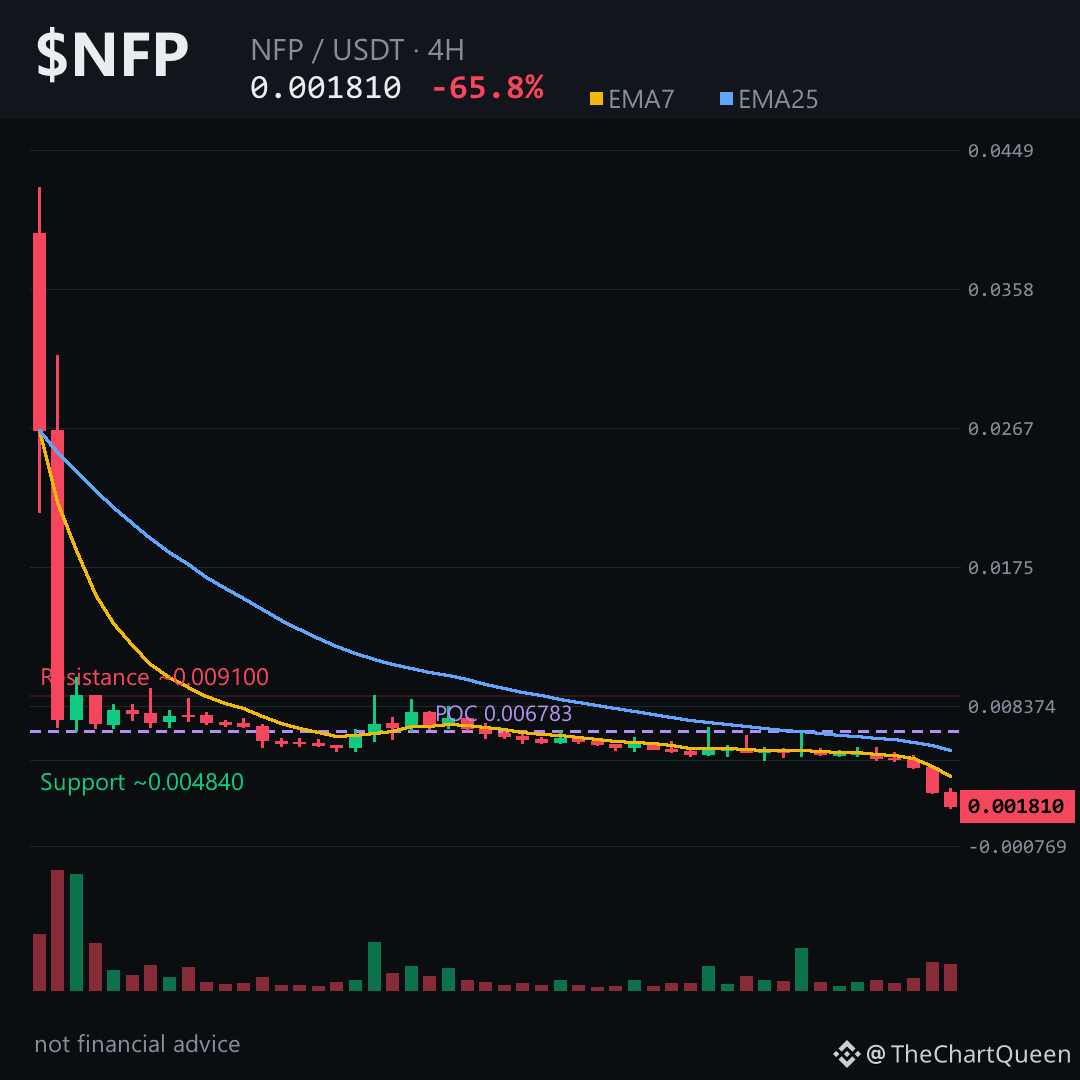
24時間で-66%のローソク足を見て、誰もが底だと言う。だがチャートを見る限り、まだ早い。
$NFPはただ下落しただけではない。2本のローソク足で、5日分の値動きの構造が消し飛んだ。4時間足のRSIは12で、極端な水準に見える。しかし、買い手がいなくなったコインでは、極端な状態が続くこともある。出来高プロファイルのコントロールポイントは0.0067付近とかなり上にあり、最近このコインを触った人のほとんどが含み損を抱えているということだ。下にあるのはサポートではない。上にあるのはレジスタンスだ。
最も重要な水準は、0.0018付近の4時間足ピボットゾーンだ。4時間足の終値で$NFPが0.00191付近を回復できなければ、最も抵抗の少ない方向は0.00165ゾーン、さらに下を目指す可能性もある。そのピボットを割れば、0.0011付近のマクロ的な底まで、意味のある需要は見当たらない。暴落時に埋まらずに残ったギャップである0.0045~0.0048のゾーンまで反発すれば、強い売り圧力に直面する可能性が高い。
私の見立てでは、これは上に弱気筋を抱えた「落ちるナイフ」だ。本当のリスクは底を逃すことではない。売りを吸収する先物市場の厚みがまったくないコインで、デッド・キャット・バウンスに飛びつくことだ。
4時間足の構造に変化があれば、この見立てを更新する。更新を見逃さないよう、ここでフォローしてほしい。
今の$NFPで、あなたがより信頼している水準はどちら? 0.00165のターゲット、それとも0.00191の無効化水準? 👇
⚠️ 金融アドバイスではありません。ご自身で調査してください。
#NFP #Crypto #BinanceSquare #Altcoins
2
·
--
$NFP -65.85% | $GTC +14.62% | $EPIC -14.68%
#NFP は$0.00181000まで下落し、取引高は$3.8 M、下落率は65.85%となりました。AIを活用したUGCプラットフォームのトークンは大きな圧力にさらされており、この急落は、現時点では売り手が市場を支配していることを示しています。
#GTC は$0.2650まで上昇し、取引高は$10.0 M、上昇率は14.62%となりました。小幅な上昇ながら、対象銘柄の中で取引高が最も多く、関心の再燃を示唆しています。
#EPIC は$0.2592で推移し、取引高は$5.4 M、下落率は14.68%となりました。下落は目立つものの、NFPほど深刻ではなく、より緩やかな売り圧力を示しています。
👀 GTCの取引高急増が市場全体の動きとどう連動するか注目しましょう。短期的なトレンドの反転を示す可能性があります。
#Write2Earn #Binance
8

·
--
$NFPは1日で65.85%下落し、0.0057から一気に0.00168まで急落しました。この値動きは通常の調整とはまったく異なります。同じ日に8%下落した他のコインと比べても、そちらは市場の正常な変動です。一方、$NFPでは誰かが投げ売りのような売却をしています。直近1時間でもさらに16.59%下落し、取引高は時間平均の1.6倍に達しました。出来高を伴う下落は、売り圧力がまだ積極的に続いていることを示しています。
#NFP #BinanceSquare #Crypto
$NFPは1日で65.85%下落し、0.0057から一気に0.00168まで急落しました。この値動きは通常の調整とはまったく異なります。同じ日に8%下落した他のコインと比べても、そちらは市場の正常な変動です。一方、$NFPでは誰かが投げ売りのような売却をしています。直近1時間でもさらに16.59%下落し、取引高は時間平均の1.6倍に達しました。出来高を伴う下落は、売り圧力がまだ積極的に続いていることを示しています。
#NFP #BinanceSquare #Crypto
#NFP #BinanceSquare #Crypto
1
42
·
--
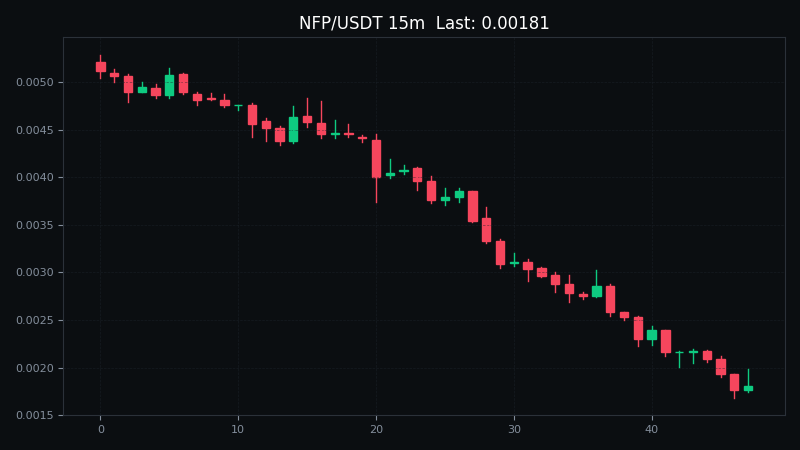
$NFPは24時間で65.8%下落。ちょっとアンケートです。
今回の相場で、すでに利益を出せた人、それともこれから参入しようとしている人?利益を出せた人はいつエントリーしたのか、これから参入する人はどの価格を待っているのか、ぜひ教えてください。
相場で最も価値があるのは、実際の取引記録です。コメント欄で情報交換しましょう。#NFP
本内容は情報交換のみを目的としており、投資助言ではありません。
$NFPは24時間で65.8%下落。ちょっとアンケートです。
今回の相場で、すでに利益を出せた人、それともこれから参入しようとしている人?利益を出せた人はいつエントリーしたのか、これから参入する人はどの価格を待っているのか、ぜひ教えてください。
相場で最も価値があるのは、実際の取引記録です。コメント欄で情報交換しましょう。#NFP
本内容は情報交換のみを目的としており、投資助言ではありません。
今回の相場で、すでに利益を出せた人、それともこれから参入しようとしている人?利益を出せた人はいつエントリーしたのか、これから参入する人はどの価格を待っているのか、ぜひ教えてください。
相場で最も価値があるのは、実際の取引記録です。コメント欄で情報交換しましょう。#NFP
本内容は情報交換のみを目的としており、投資助言ではありません。
2
·
--
データが語る:$NFPは24時間で65.8%下落し、現在価格は0.00181、24時間の取引額は3,834,192 USDTです。
価格と出来高は、市場の最も正直な言葉です。価格と出来高がともに拡大すれば、トレンドの信頼性は高まります。一方、価格が上昇しても出来高が減少している場合は、見せかけの上昇に注意が必要です。このデータを記録して、明日、同じ時間にもう一度比べてみましょう。
少しずつ、資金の意図が読み取れるようになります。#NFP
この内容は情報交換のみを目的としており、投資助言を構成するものではありません。
データが語る:$NFPは24時間で65.8%下落し、現在価格は0.00181、24時間の取引額は3,834,192 USDTです。
価格と出来高は、市場の最も正直な言葉です。価格と出来高がともに拡大すれば、トレンドの信頼性は高まります。一方、価格が上昇しても出来高が減少している場合は、見せかけの上昇に注意が必要です。このデータを記録して、明日、同じ時間にもう一度比べてみましょう。
少しずつ、資金の意図が読み取れるようになります。#NFP
この内容は情報交換のみを目的としており、投資助言を構成するものではありません。
価格と出来高は、市場の最も正直な言葉です。価格と出来高がともに拡大すれば、トレンドの信頼性は高まります。一方、価格が上昇しても出来高が減少している場合は、見せかけの上昇に注意が必要です。このデータを記録して、明日、同じ時間にもう一度比べてみましょう。
少しずつ、資金の意図が読み取れるようになります。#NFP
この内容は情報交換のみを目的としており、投資助言を構成するものではありません。
4
ログインして、さらにコンテンツを読む
厳選トピックで世界の暗号資産トレーダーの仲間入り
⚡️ 暗号資産に関する最新かつ有益な情報が見つかります。
💬 世界最大の暗号資産取引所から信頼されています。
👍 認証を受けたクリエイターから、有益なインサイトを得られます。
メール / 電話番号
トレンドトピック
1
#BinancePick
閲覧回数 3.1M
152,925人が討論中
2
#EarningsSeason
閲覧回数 5.3M
26,015人が討論中
3
#AnthropicTTMRevenueGrewAbout1200%
閲覧回数 30,903
426人が討論中
4
#AnthropicS1ExpectedToday
閲覧回数 26,745
352人が討論中
5
#SouthKoreaReportedlyWeighsFourthCryptoTaxDelay
閲覧回数 31,024
479人が討論中
6
#FranklinTempletonFilesForTwoDividendToBitcoinETFs
閲覧回数 40,922
546人が討論中
7
#StrategyMSTRSurpassesNasdaqInMarketCap
閲覧回数 31,176
390人が討論中
8
#CanadaProposesStablecoinRedemptionWithin3BusinessDays
閲覧回数 1,339
36人が討論中
9
#ElectrumWalletBugLetRogueServersStealFunds
閲覧回数 31,531
467人が討論中
10
#ArgentineCourtDismissesLIBRACaseAgainstMilei
閲覧回数 47,178
584人が討論中