

#etherum
etherum
閲覧回数 1.1M
991人が討論中
注目
最新

·
--
弱気相場
翻訳参照
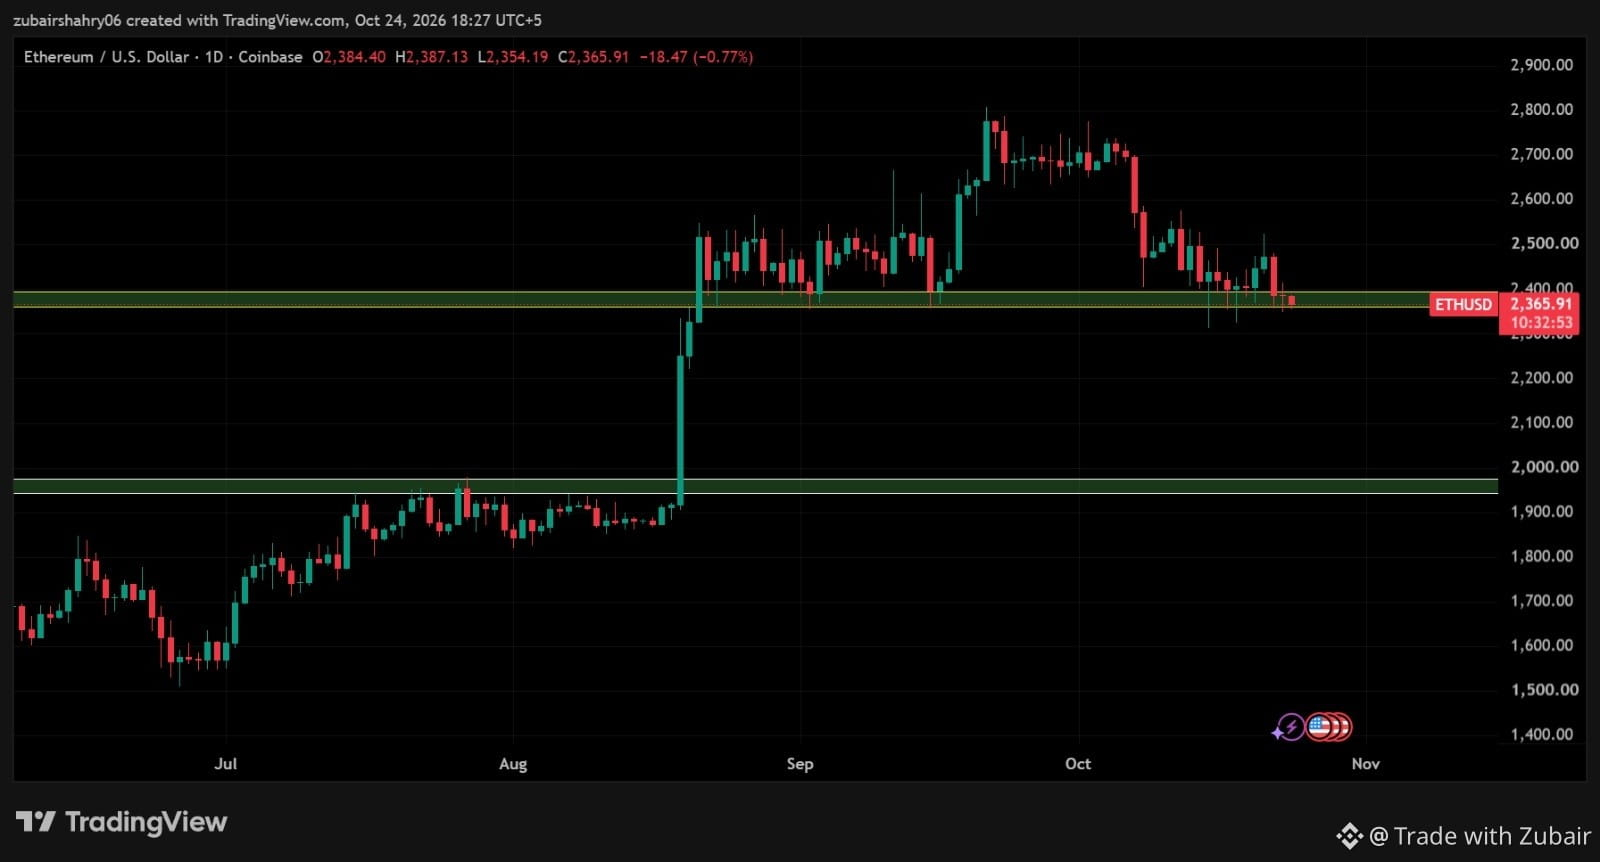
📊 ETH/USD Technical Analysis — The Battle at $2,350–$2,400
The breakout was powerful. The pullback is testing the conviction. 👀
$ETH on the 1D chart is approaching a crucial support zone after retreating from the $2,750–$2,800 region. The market is now testing the same area that previously acted as resistance before the massive breakout.
🔍 Key observations
* 🟡 $2,350–$2,400 : Critical support zone under pressure.
* 🟢 $1,940–$1,980 : Major lower support zone if the current level breaks down.
* 🔴 $2,500–$2,550 : Potential resistance if buyers regain control.
* 📉 Market structure : Short-term bearish pressure, with price making lower highs and moving back toward support.
🎯 What comes next ?
* Bullish scenario : A strong rejection from support could trigger a relief rally toward $2,500 and beyond.
* Bearish scenario : A decisive daily close below the support zone could open the door to further downside.
No prediction is guaranteed. The reaction at support matters more than the level itself.
🔥 The real game is happening at support!
The breakout created the excitement. Now the pullback will reveal whether buyers are ready to defend their ground.
Don't chase the candle. Wait for confirmation. Protect your capital. Trade the setup, not the emotion.
#CryptoAnalysis #Etherum #TechnicalAnalysis
75


·
--
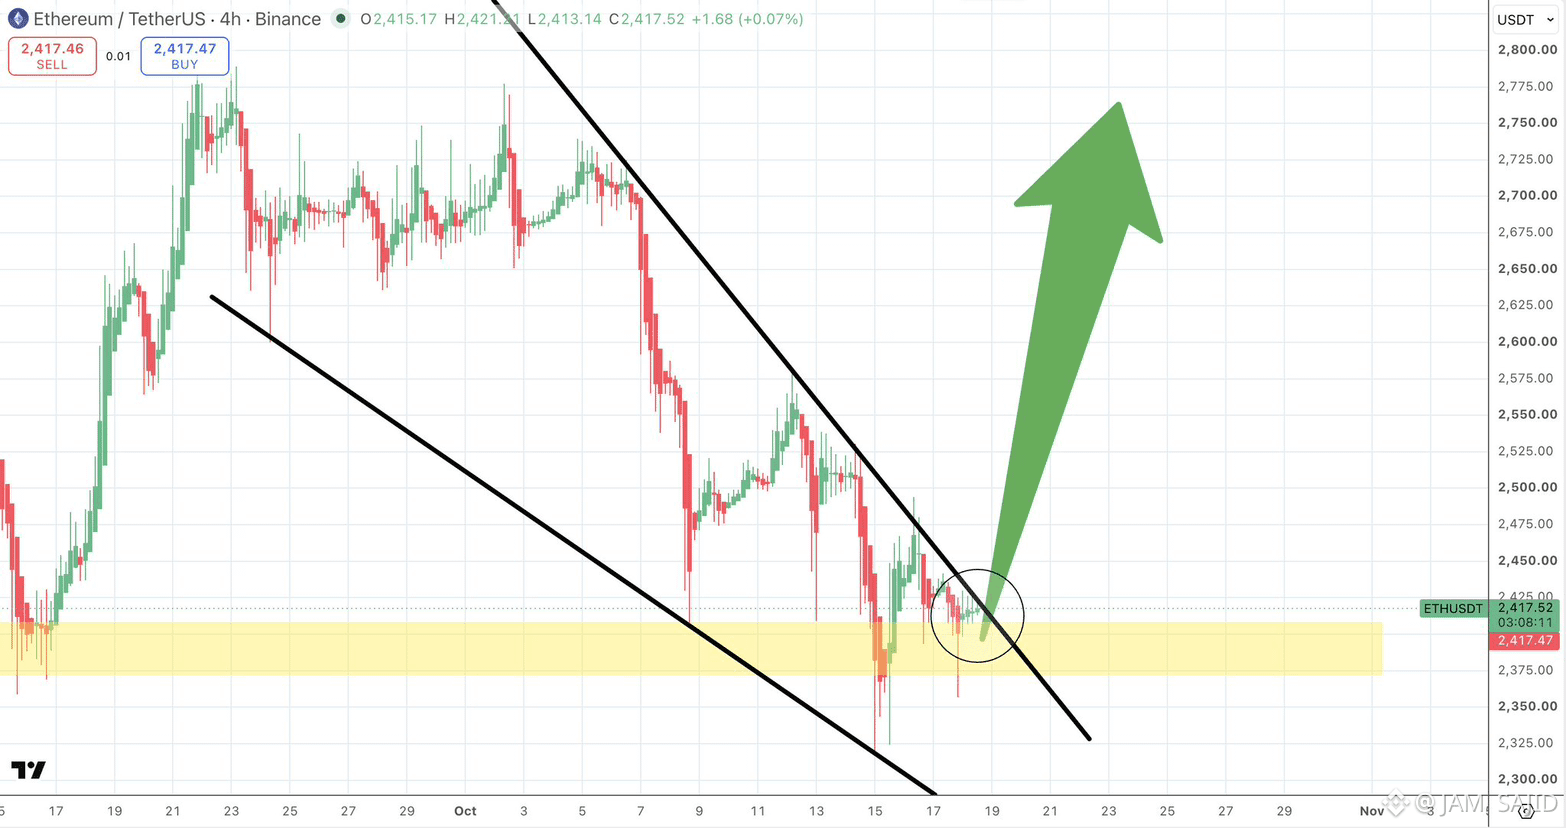
🚨 **イーサリアム vs. ビットコイン:ETHは主導権を握れるか?** 🔥$ethイーサリアムは、スマートコントラクトやDeFiアプリケーション、拡大を続けるブロックチェーンエコシステムを支える、暗号資産市場の主要プレイヤーです。
しかし、最大の疑問はこれです。**次の相場局面で、ETHはBTCを上回ることができるでしょうか?**
📈 **強気材料**
🟢 イーサリアムネットワークの活動が活発化
🟢 ETH/BTCの価格パフォーマンスが向上
🟢 機関投資家の需要が増加
🟢 大商いを伴うブレイクアウトが確認された
📉 **注意すべきリスク**
🔴 暗号資産市場全体の調整
🔴 ETH/BTCの勢いが弱まる
🔴 需要の減少、または売り圧力の高まり
🚨 **イーサリアム vs. ビットコイン:ETHは主導権を握れるか?** 🔥
$ethイーサリアムは、スマートコントラクトやDeFiアプリケーション、拡大を続けるブロックチェーンエコシステムを支える、暗号資産市場の主要プレイヤーです。
しかし、最大の疑問はこれです。**次の相場局面で、ETHはBTCを上回ることができるでしょうか?**
📈 **強気材料**
🟢 イーサリアムネットワークの活動が活発化
🟢 ETH/BTCの価格パフォーマンスが向上
🟢 機関投資家の需要が増加
🟢 大商いを伴うブレイクアウトが確認された
📉 **注意すべきリスク**
🔴 暗号資産市場全体の調整
🔴 ETH/BTCの勢いが弱まる
🔴 需要の減少、または売り圧力の高まり
しかし、最大の疑問はこれです。**次の相場局面で、ETHはBTCを上回ることができるでしょうか?**
📈 **強気材料**
🟢 イーサリアムネットワークの活動が活発化
🟢 ETH/BTCの価格パフォーマンスが向上
🟢 機関投資家の需要が増加
🟢 大商いを伴うブレイクアウトが確認された
📉 **注意すべきリスク**
🔴 暗号資産市場全体の調整
🔴 ETH/BTCの勢いが弱まる
🔴 需要の減少、または売り圧力の高まり
176

·
--
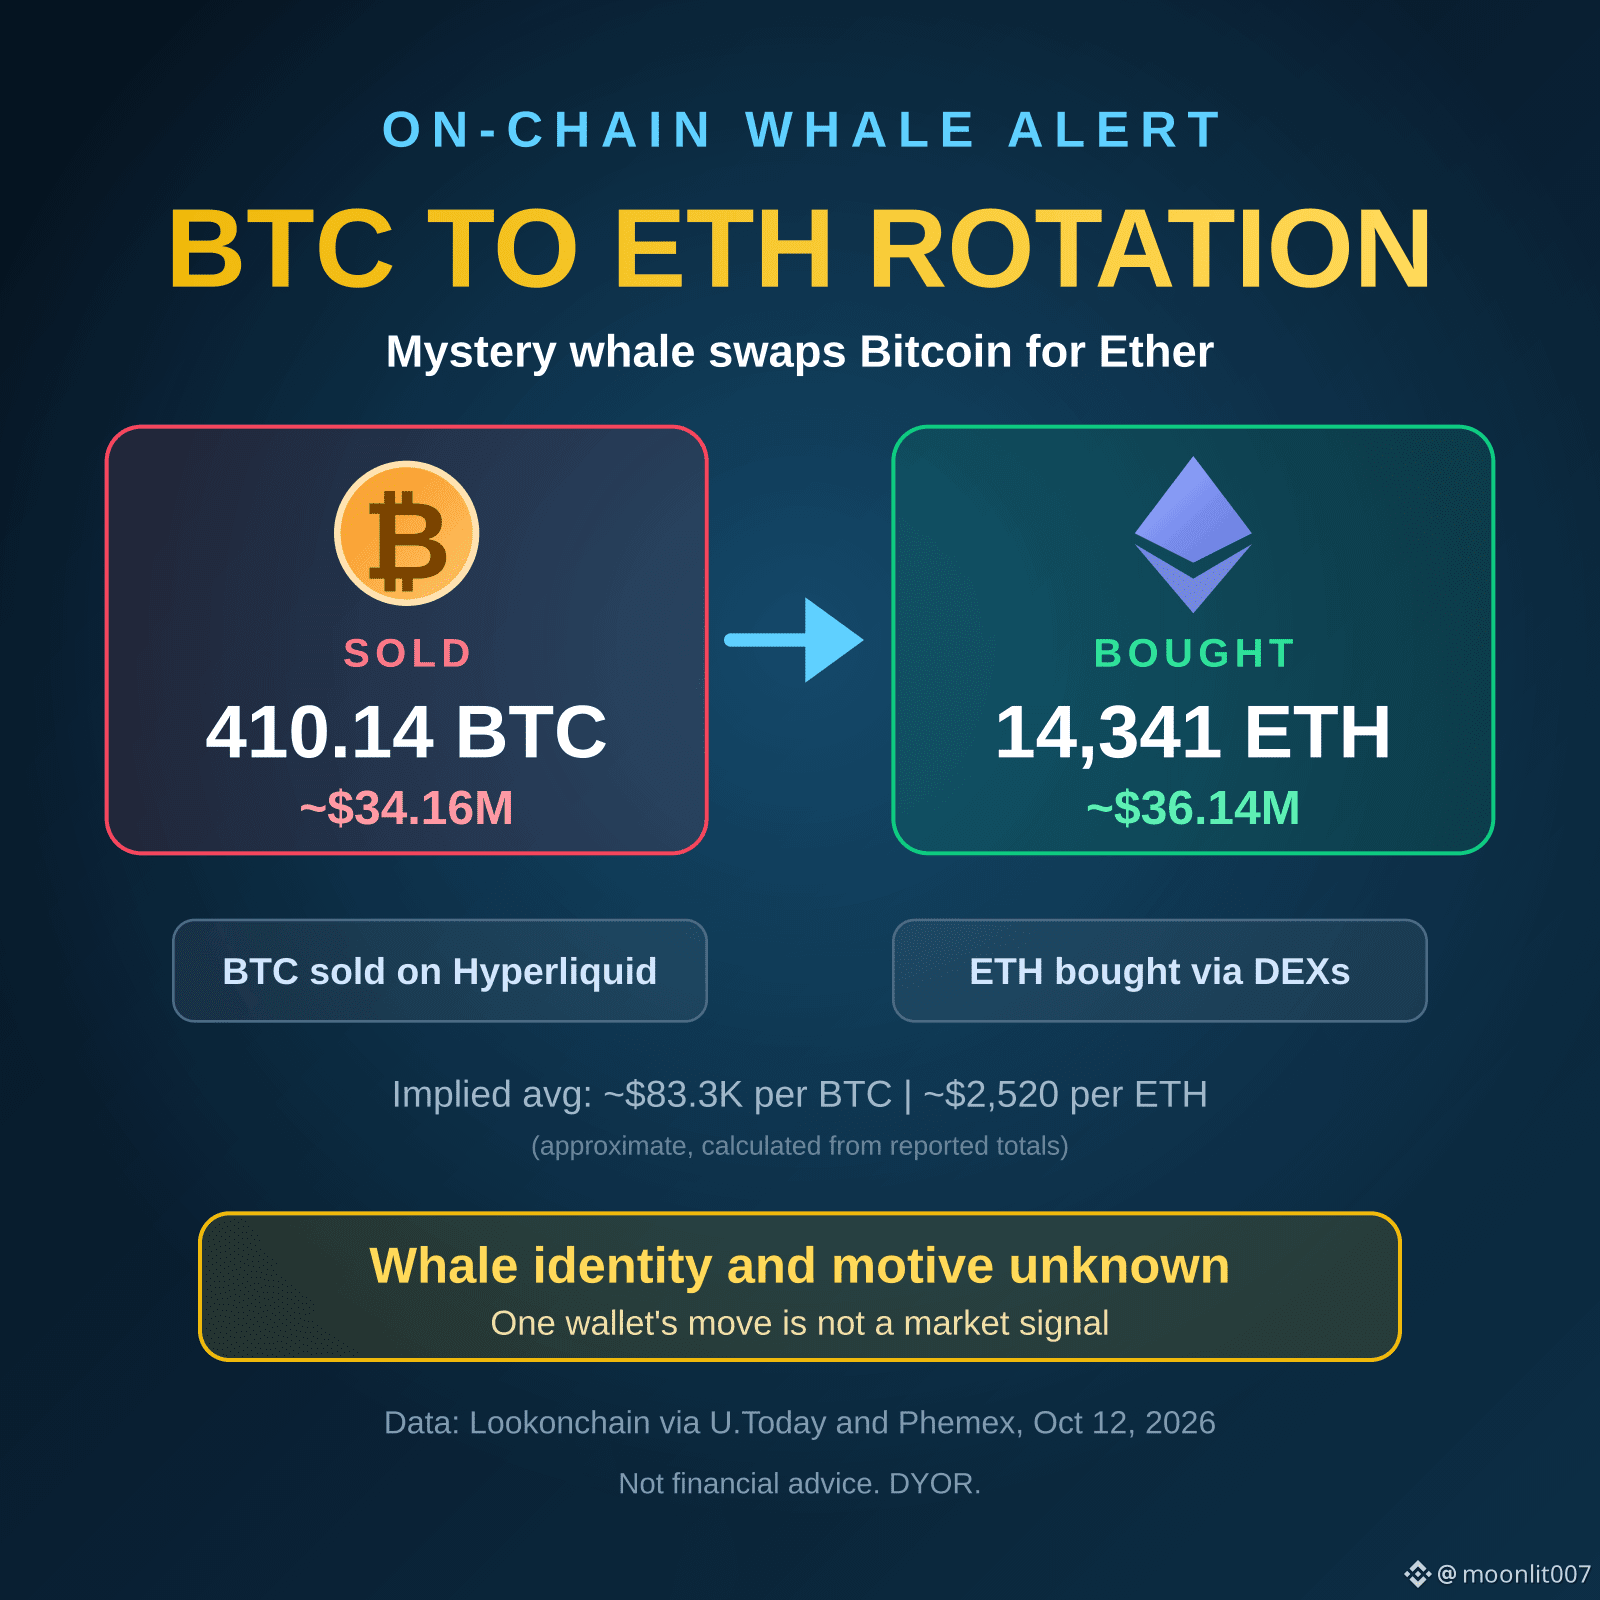
🐋 謎のクジラ、410.14 BTCを売却しETHに乗り換え 🔄
オンチェーンデータによると、大口トレーダーがビットコインを売り、イーサに資金を移しています。詳細はこちら👇
取引内容:
🔴 Hyperliquidで410.14 BTC(約3,416万ドル)を売却
🟢 DEXを通じて14,341 ETH(約3,614万ドル)を購入
⚖️ BTCの売却額をわずかに上回る金額をETHに投入
📍 1 BTCあたり約83,300ドル、1 ETHあたり約2,520ドルに相当します(報告された合計額からの私の推定)
オンチェーンで確認されたウォレットの動き:
📌 トークン化BTCが複数回、クジラのアドレスに送金
📌 あるアドレスがHyperliquidのブリッジ経由で874,576 USDCを受け取り
📌 2つのアドレスがUniswapから約865 ETHと827 ETHを受け取り
市場の状況:
📊 ETHは約2,550ドル。24時間で約1.9%上昇した一方、7日間では約6%下落
📊 24時間で約4,800万ドル相当のETH先物が清算され、その大半はショートポジション
📊 先週、米国の現物ETH ETFから5億4,200万ドルの純流出があった後の動きです。つまり、ファンドが売る一方で、このクジラは買っています
注意点:
⚠️ クジラの正体や動機は不明です
⚠️ これは単一のウォレットの動きであり、トレンドとは限りません。クジラも間違えることがあります
⚠️ 長期的な乗り換えなのか、短期的な取引なのかは分かりません\
#MYSTERYWHALE #WHALEALERT #ETHERUM
$ETH
{spot}(ETHUSDT)
$BTC
{spot}(BTCUSDT)
🐋 謎のクジラ、410.14 BTCを売却しETHに乗り換え 🔄
オンチェーンデータによると、大口トレーダーがビットコインを売り、イーサに資金を移しています。詳細はこちら👇
取引内容:
🔴 Hyperliquidで410.14 BTC(約3,416万ドル)を売却
🟢 DEXを通じて14,341 ETH(約3,614万ドル)を購入
⚖️ BTCの売却額をわずかに上回る金額をETHに投入
📍 1 BTCあたり約83,300ドル、1 ETHあたり約2,520ドルに相当します(報告された合計額からの私の推定)
オンチェーンで確認されたウォレットの動き:
📌 トークン化BTCが複数回、クジラのアドレスに送金
📌 あるアドレスがHyperliquidのブリッジ経由で874,576 USDCを受け取り
📌 2つのアドレスがUniswapから約865 ETHと827 ETHを受け取り
市場の状況:
📊 ETHは約2,550ドル。24時間で約1.9%上昇した一方、7日間では約6%下落
📊 24時間で約4,800万ドル相当のETH先物が清算され、その大半はショートポジション
📊 先週、米国の現物ETH ETFから5億4,200万ドルの純流出があった後の動きです。つまり、ファンドが売る一方で、このクジラは買っています
注意点:
⚠️ クジラの正体や動機は不明です
⚠️ これは単一のウォレットの動きであり、トレンドとは限りません。クジラも間違えることがあります
⚠️ 長期的な乗り換えなのか、短期的な取引なのかは分かりません\
#MYSTERYWHALE #WHALEALERT #ETHERUM
$ETH
$BTC
15

ETH価格分析 — 急落後、イーサリアムは底固めに向かっているのか?
◆━━━━━━━━━━━━━━━━◆
✔︎ 市場概況
ETH/USDTは、主要な暗号資産の中でも比較的大きな下落を経験した後、2,618ドル付近(-2.84%)で取引されています。価格には引き続き下押し圧力がかかっていますが、買い手は直近安値付近で反応し始めています。
➤ テクニカル分析
イーサリアムはMA(5)の2,663ドル、MA(10)の2,685ドル、MA(20)の2,696ドルを下回りました。この下落局面では、直近の取引で最も大きな出来高を記録し、下落時の市場活動が活発化していたことが確認されました。2,589ドルを上回る水準で小幅な反発が見られますが、移動平均線のゾーンは引き続き上値抵抗として機能しています。
➤ シナリオ分析
① 強気シナリオ:4時間足が2,685~2,696ドルを上回って終値をつければ、モメンタムが改善し、2,724ドルが再び意識される可能性があります。
② 弱気シナリオ:2,589ドルを下抜けると、下落圧力が強まる可能性があります。
③ 中立シナリオ:市場が安定する中、価格は2,589~2,685ドルの範囲で推移する可能性があります。
➤ 重要水準
レジスタンス:2,685ドル | 2,724ドル
サポート:2,589ドル | 2,500ドル
$ETH
{future}(ETHUSDT)
#BinanceLaunchesBinanceIntelligence #ETH #Etherum
ETH価格分析 — 急落後、イーサリアムは底固めに向かっているのか?
◆━━━━━━━━━━━━━━━━◆
✔︎ 市場概況
ETH/USDTは、主要な暗号資産の中でも比較的大きな下落を経験した後、2,618ドル付近(-2.84%)で取引されています。価格には引き続き下押し圧力がかかっていますが、買い手は直近安値付近で反応し始めています。
➤ テクニカル分析
イーサリアムはMA(5)の2,663ドル、MA(10)の2,685ドル、MA(20)の2,696ドルを下回りました。この下落局面では、直近の取引で最も大きな出来高を記録し、下落時の市場活動が活発化していたことが確認されました。2,589ドルを上回る水準で小幅な反発が見られますが、移動平均線のゾーンは引き続き上値抵抗として機能しています。
➤ シナリオ分析
① 強気シナリオ:4時間足が2,685~2,696ドルを上回って終値をつければ、モメンタムが改善し、2,724ドルが再び意識される可能性があります。
② 弱気シナリオ:2,589ドルを下抜けると、下落圧力が強まる可能性があります。
③ 中立シナリオ:市場が安定する中、価格は2,589~2,685ドルの範囲で推移する可能性があります。
➤ 重要水準
レジスタンス:2,685ドル | 2,724ドル
サポート:2,589ドル | 2,500ドル
$ETH
#BinanceLaunchesBinanceIntelligence #ETH #Etherum
65

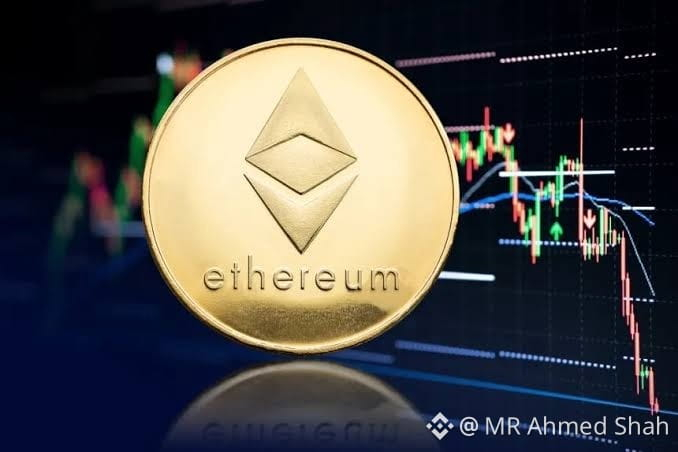
$ETH ETH Analysis
価格アクション:ETHは主要なサポート付近で横ばいとなっており、$3,500のレジスタンスを再び奪還できずにいます。レンジは$3,200〜$3,500。
テクニカル:
· サポート:$3,200(重要)、$3,000(主要)
· レジスタンス:$3,500、$3,700
· 50日移動平均線が動的なレジスタンスとして機能
· RSIは中立付近(約45)
オンチェーン:取引所からの資金流出が増加しており、蓄積(アキュムレーション)を示唆しています。ETHのステーキングは史上最高水準で推移しており(供給の約30%)、流動供給が減少しています。
カタリスト:
· スポットETH ETFの資金フローは依然としてまちまち
· レイヤー2の採用が拡大(過去最高のTVL)
· Dencunアップグレードの影響が落ち着き、手数料が低下
{spot}(ETHUSDT)
#ETH #Etherum #Crypto
$ETH ETH Analysis
価格アクション:ETHは主要なサポート付近で横ばいとなっており、$3,500のレジスタンスを再び奪還できずにいます。レンジは$3,200〜$3,500。
テクニカル:
· サポート:$3,200(重要)、$3,000(主要)
· レジスタンス:$3,500、$3,700
· 50日移動平均線が動的なレジスタンスとして機能
· RSIは中立付近(約45)
オンチェーン:取引所からの資金流出が増加しており、蓄積(アキュムレーション)を示唆しています。ETHのステーキングは史上最高水準で推移しており(供給の約30%)、流動供給が減少しています。
カタリスト:
· スポットETH ETFの資金フローは依然としてまちまち
· レイヤー2の採用が拡大(過去最高のTVL)
· Dencunアップグレードの影響が落ち着き、手数料が低下
#ETH #Etherum #Crypto
49

·
--
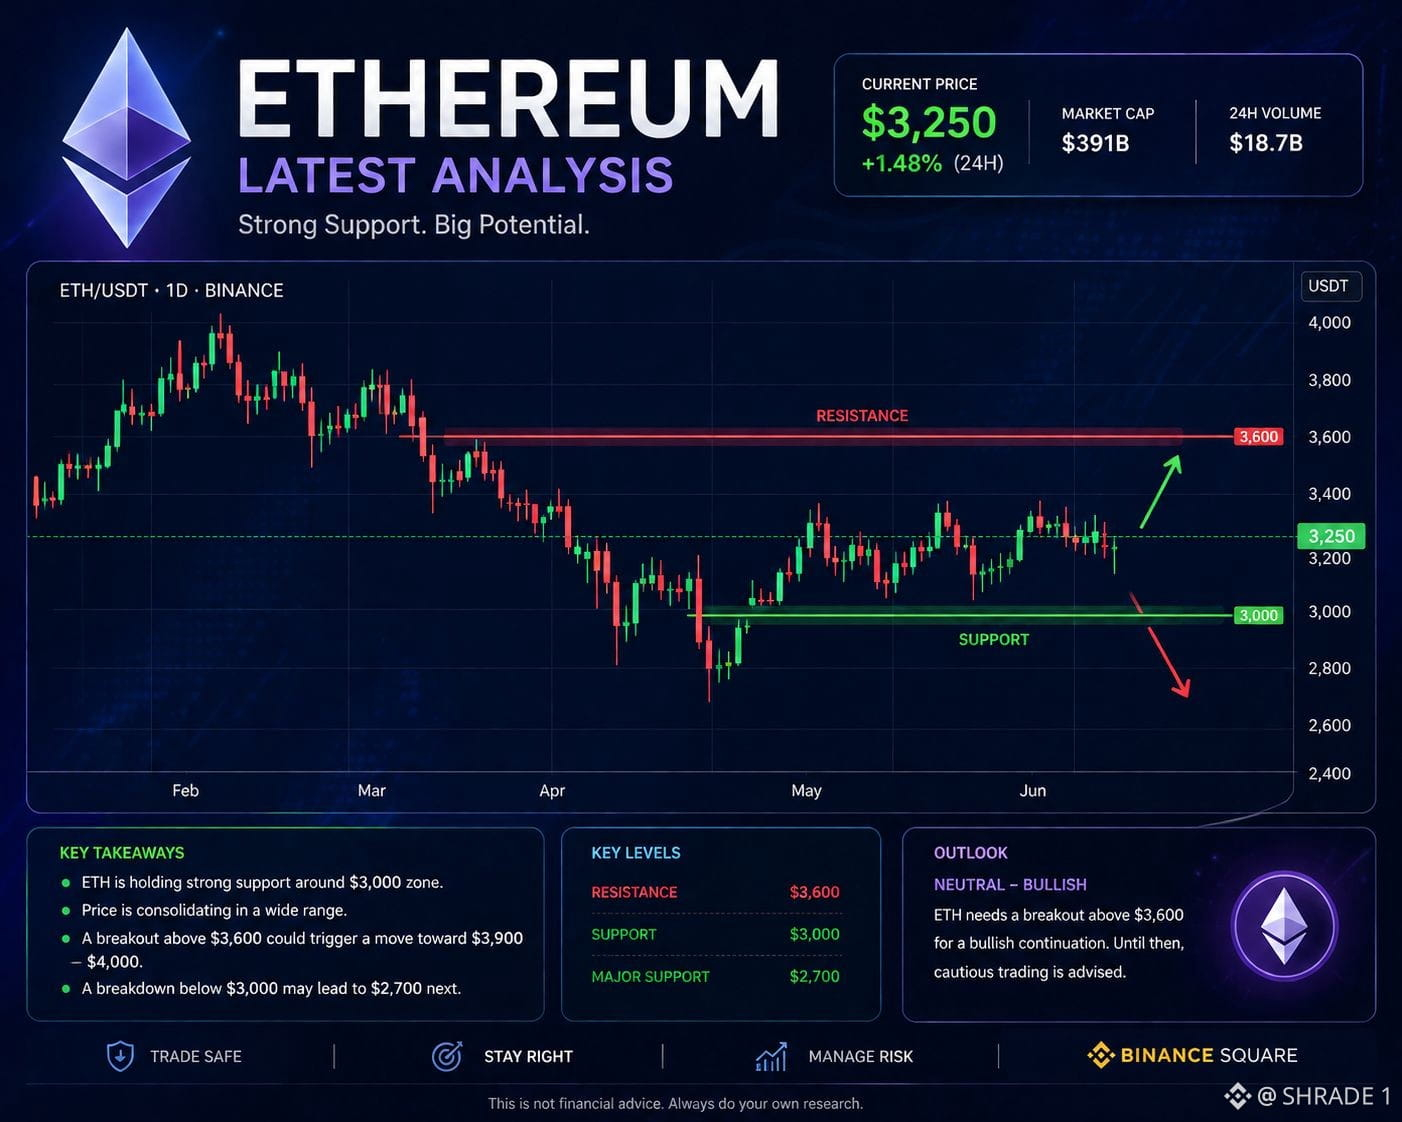
$ETH イーサリアムは直近の市場の弱さの後、重要なサポートゾーンで取引されています。買い手は現在の水準を守ろうとしているものの、モメンタムは慎重なままです。最寄りのレジスタンスを強く上抜けると回復を示す可能性がある一方、サポートを割り込むとさらなる下落につながる恐れがあります。
The Economic Times +1
主要見通し
トレンド:ニュートラル(ただし弱気圧力あり)。
📈 強気シナリオ:サポートを維持し、レジスタンスを上抜ければ上向きのモメンタムが再始動する可能性。
📉 弱気リスク:現在のサポートを失うと、より深い調整につながるかもしれません。
注目:ETFフロー、マクロ経済ニュース、そして全体的なビットコインの動きが、ETHの値動きに引き続き影響するため、それらを確認してください。
{spot}(ETHUSDT)
#Etherum
#ETH
#CryptoNews
#BinanceSquare #CryptoMarket
$ETH イーサリアムは直近の市場の弱さの後、重要なサポートゾーンで取引されています。買い手は現在の水準を守ろうとしているものの、モメンタムは慎重なままです。最寄りのレジスタンスを強く上抜けると回復を示す可能性がある一方、サポートを割り込むとさらなる下落につながる恐れがあります。
The Economic Times +1
主要見通し
トレンド:ニュートラル(ただし弱気圧力あり)。
📈 強気シナリオ:サポートを維持し、レジスタンスを上抜ければ上向きのモメンタムが再始動する可能性。
📉 弱気リスク:現在のサポートを失うと、より深い調整につながるかもしれません。
注目:ETFフロー、マクロ経済ニュース、そして全体的なビットコインの動きが、ETHの値動きに引き続き影響するため、それらを確認してください。
#Etherum
#ETH
#CryptoNews
#BinanceSquare #CryptoMarket
The Economic Times +1
主要見通し
トレンド:ニュートラル(ただし弱気圧力あり)。
📈 強気シナリオ:サポートを維持し、レジスタンスを上抜ければ上向きのモメンタムが再始動する可能性。
📉 弱気リスク:現在のサポートを失うと、より深い調整につながるかもしれません。
注目:ETFフロー、マクロ経済ニュース、そして全体的なビットコインの動きが、ETHの値動きに引き続き影響するため、それらを確認してください。
#Etherum
#ETH
#CryptoNews
#BinanceSquare #CryptoMarket
91
·
--
[❖Gɪғᴛ](https://www.binance.com/activity/red-packets/RP14113404375978795299817/share?utm_medium=web_share_copy)
イーサリアム・パーペチュアル・コントラクト 2026年 利益戦略
2026年に競合他社に差をつけるための、イーサリアム・パーペチュアル・コントラクトの利益戦略の秘密を解き明かします!プロのトレーダーは、安定してリターンを生み出すためにどんな手法を使っているのでしょうか?
これらの重要な要因を見落としているかもしれません。だからこそ、暗号デリバティブ市場ではトレーダーの90%が失敗してしまうのです。
市場のトレンドを正確に分析し、比類なきリスク管理を行い、先進的なテクニカルツールを使って取引を最適化する方法を学べます。初心者でも経験豊富なトレーダーでも、今日明かされる戦略があなたを助けます。
#etherum #strategy #currecy #binance #bticion
❖Gɪғᴛ
イーサリアム・パーペチュアル・コントラクト 2026年 利益戦略
2026年に競合他社に差をつけるための、イーサリアム・パーペチュアル・コントラクトの利益戦略の秘密を解き明かします!プロのトレーダーは、安定してリターンを生み出すためにどんな手法を使っているのでしょうか?
これらの重要な要因を見落としているかもしれません。だからこそ、暗号デリバティブ市場ではトレーダーの90%が失敗してしまうのです。
市場のトレンドを正確に分析し、比類なきリスク管理を行い、先進的なテクニカルツールを使って取引を最適化する方法を学べます。初心者でも経験豊富なトレーダーでも、今日明かされる戦略があなたを助けます。
#etherum #strategy #currecy #binance #bticion
1
118

·
--
ブリッシュ
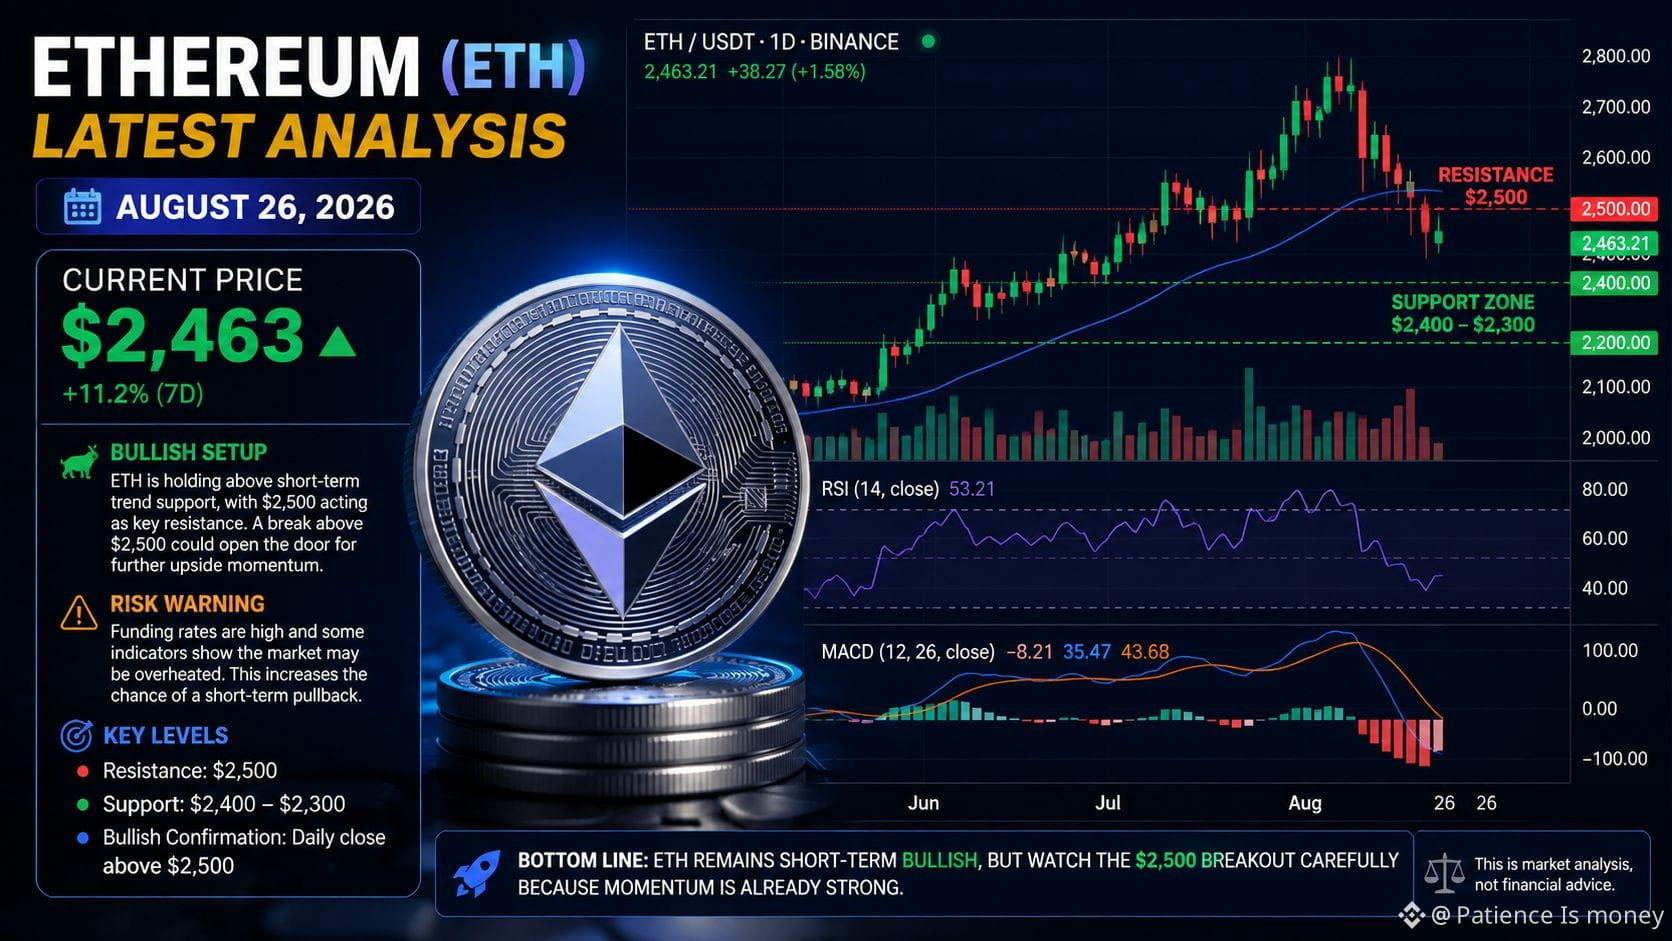
🔹 $ETH は約$2,463で取引されており、過去7日で約11%上昇していて、短期的な勢いは強気です。
📈 強気のセットアップ:$ETH は短期トレンドのサポートの上で推移しており、$2,500が主要なレジスタンスとして機能しています。$2,500を上回る説得力のあるブレイクは、上昇モメンタムをさらに強める可能性があります。
⚠️ リスク:資金調達率(ファンディング・レート)が急上昇しており、一部の指標では市場が過熱しつつあることを示唆しています。これにより、短期的な押し目や利確が起こる可能性が高まります。
🎯 重要水準:
• レジスタンス:$2,500
• サポート:$2,400〜$2,300
• 強い強気の確認:日足で$2,500を上回る終値
結論:$ETH は短期的には強気に見えますが、モメンタムはすでに強いため、トレーダーは$2,500のブレイクに注意して監視すべきです。
⚠️ これは市場分析であり、金融助言ではありません。#XRPRallies44%InAWeek #Etherum
{spot}(ETHUSDT)
🔹 $ETH は約$2,463で取引されており、過去7日で約11%上昇していて、短期的な勢いは強気です。
📈 強気のセットアップ:$ETH は短期トレンドのサポートの上で推移しており、$2,500が主要なレジスタンスとして機能しています。$2,500を上回る説得力のあるブレイクは、上昇モメンタムをさらに強める可能性があります。
⚠️ リスク:資金調達率(ファンディング・レート)が急上昇しており、一部の指標では市場が過熱しつつあることを示唆しています。これにより、短期的な押し目や利確が起こる可能性が高まります。
🎯 重要水準:
• レジスタンス:$2,500
• サポート:$2,400〜$2,300
• 強い強気の確認:日足で$2,500を上回る終値
結論:$ETH は短期的には強気に見えますが、モメンタムはすでに強いため、トレーダーは$2,500のブレイクに注意して監視すべきです。
⚠️ これは市場分析であり、金融助言ではありません。#XRPRallies44%InAWeek #Etherum
1
1
73


·
--
弱気相場
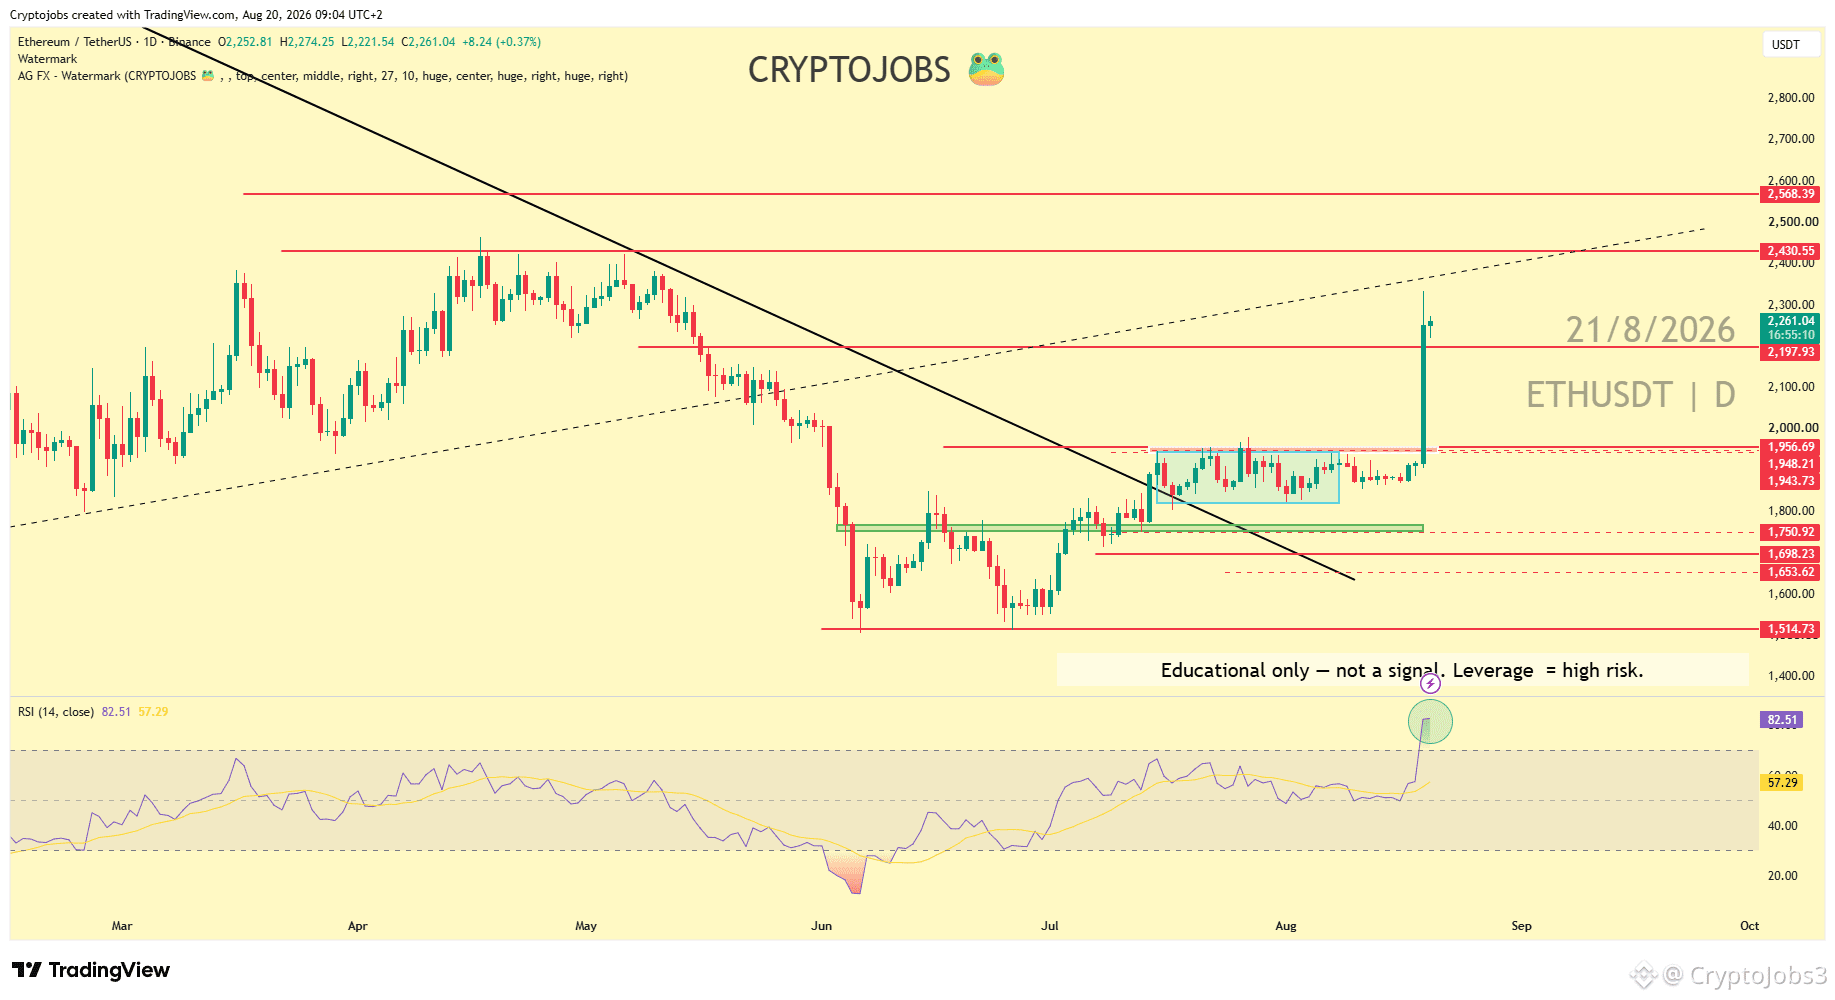
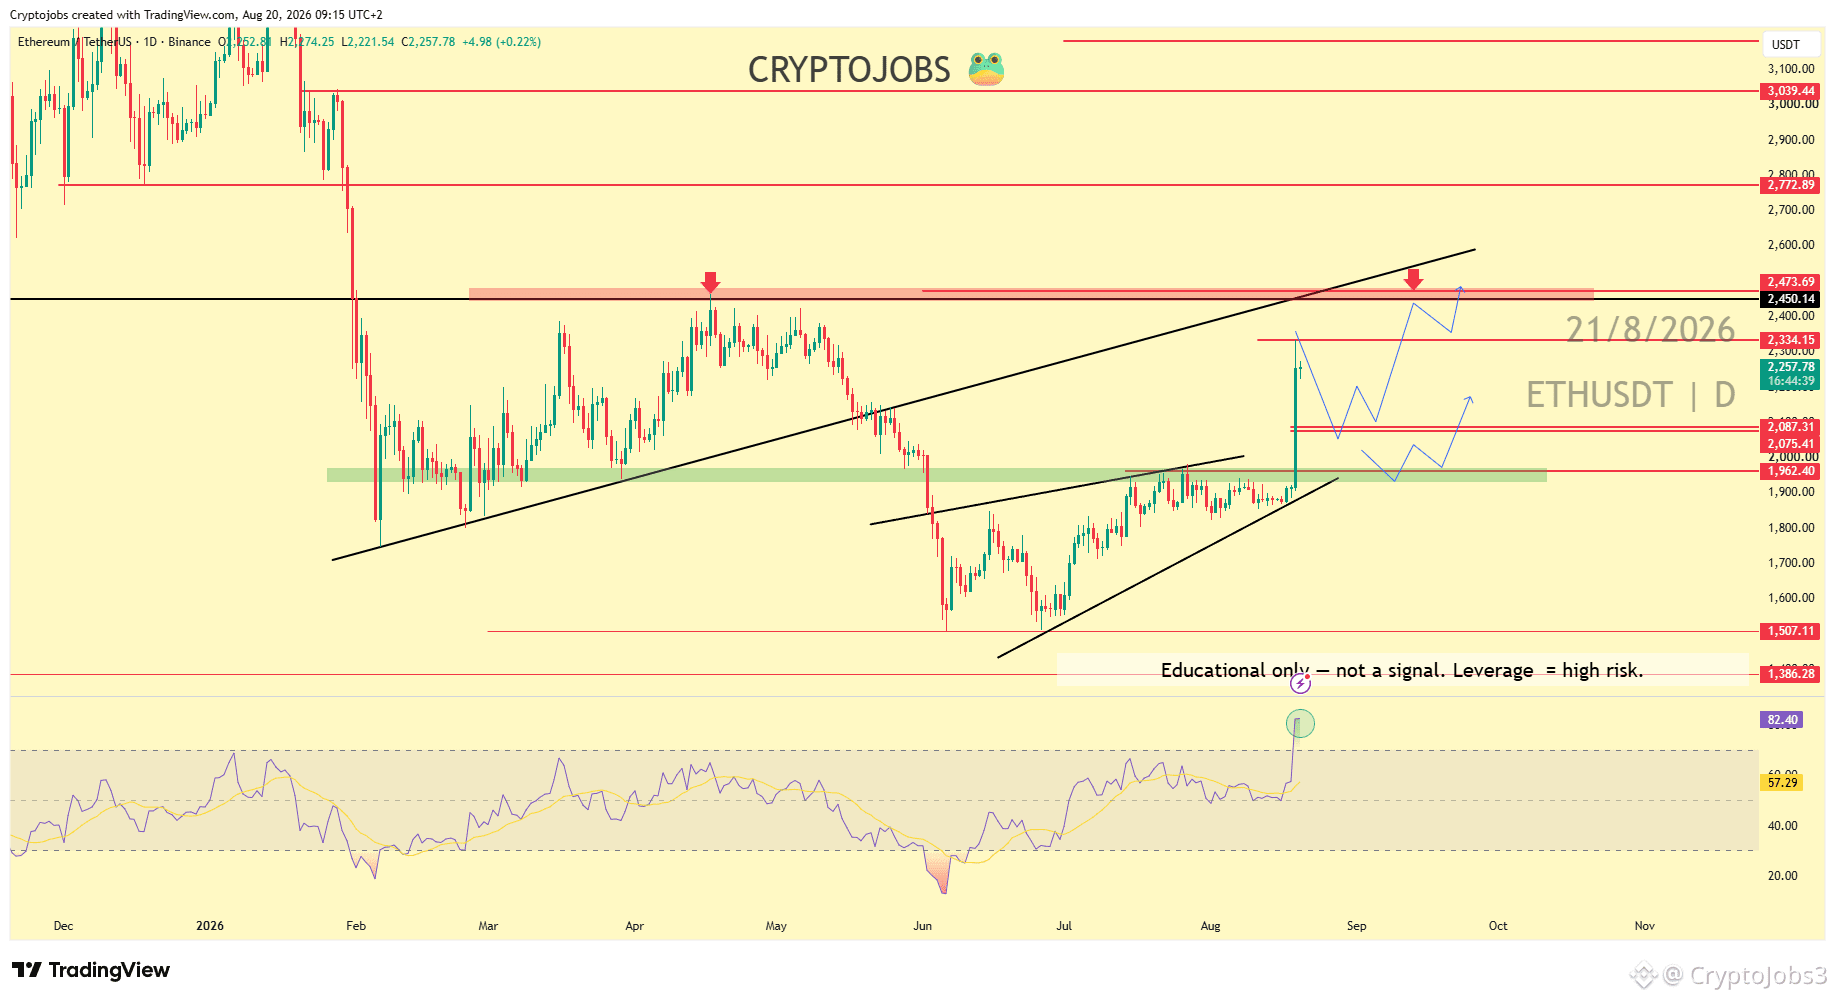
$ETH 1日で+20%のポンピング 😱
ダマシ(ベアトラップ)か、それとも本物のブレイクアウトか?👇🏻
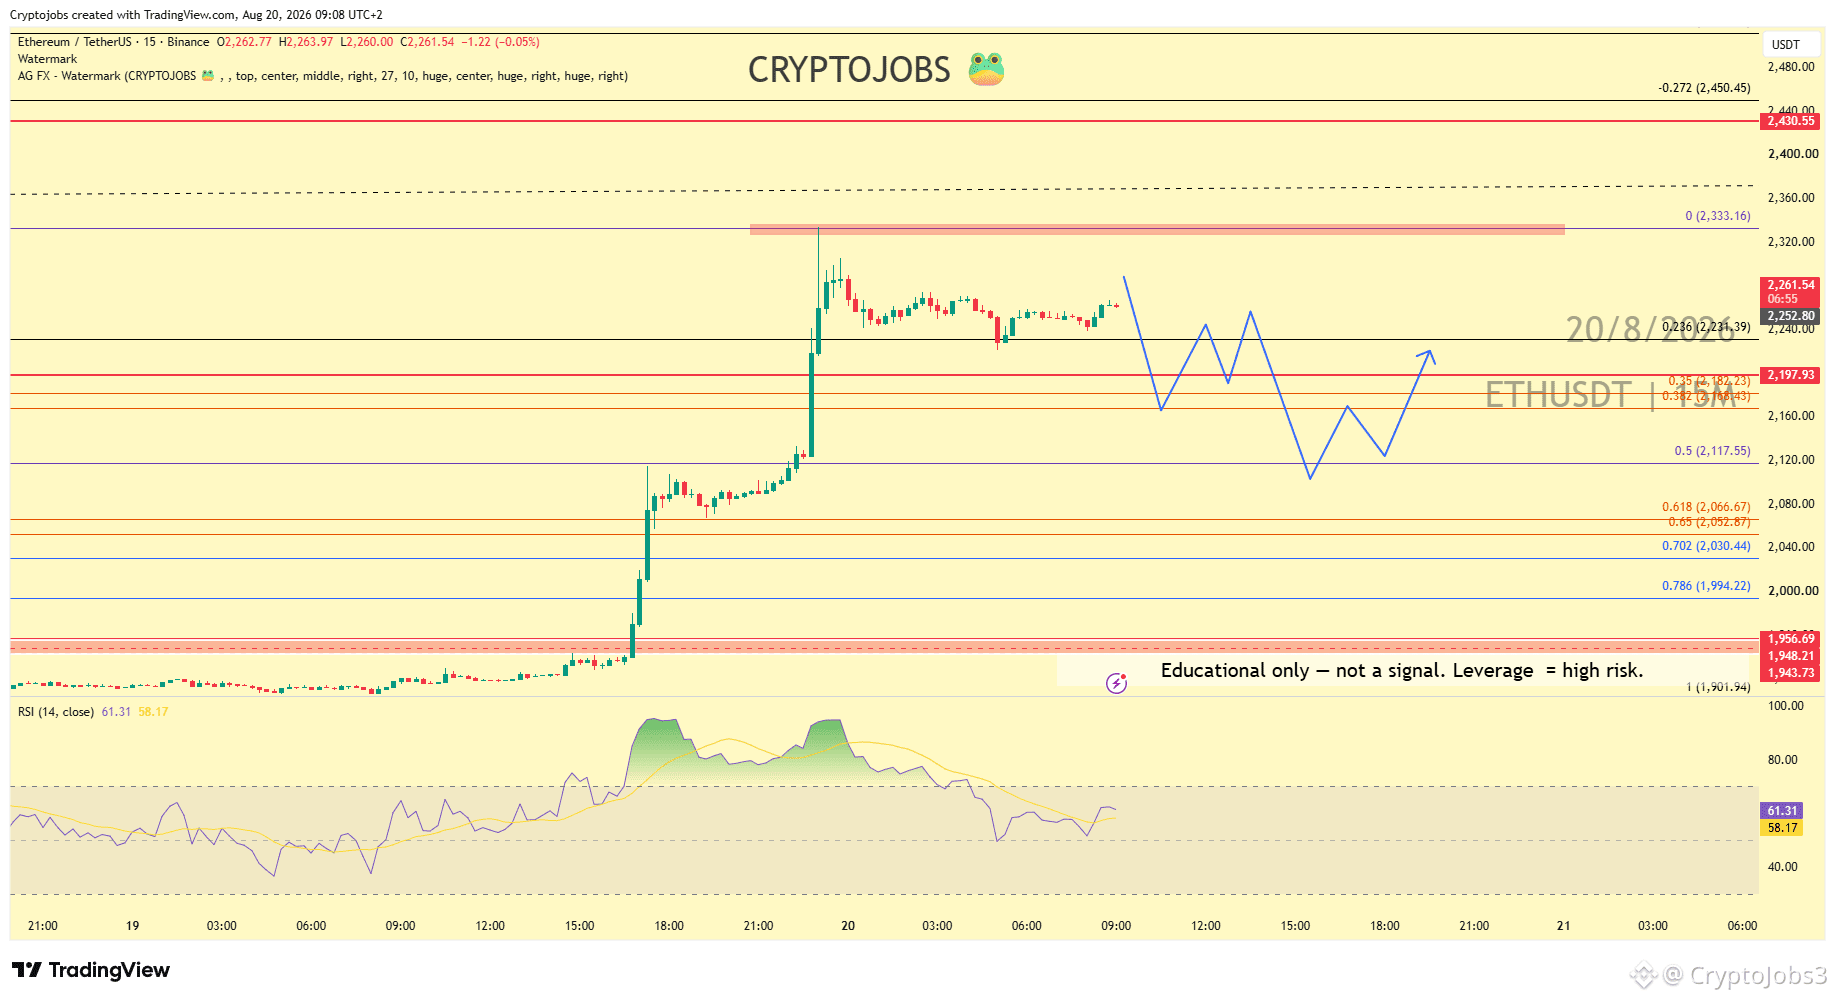
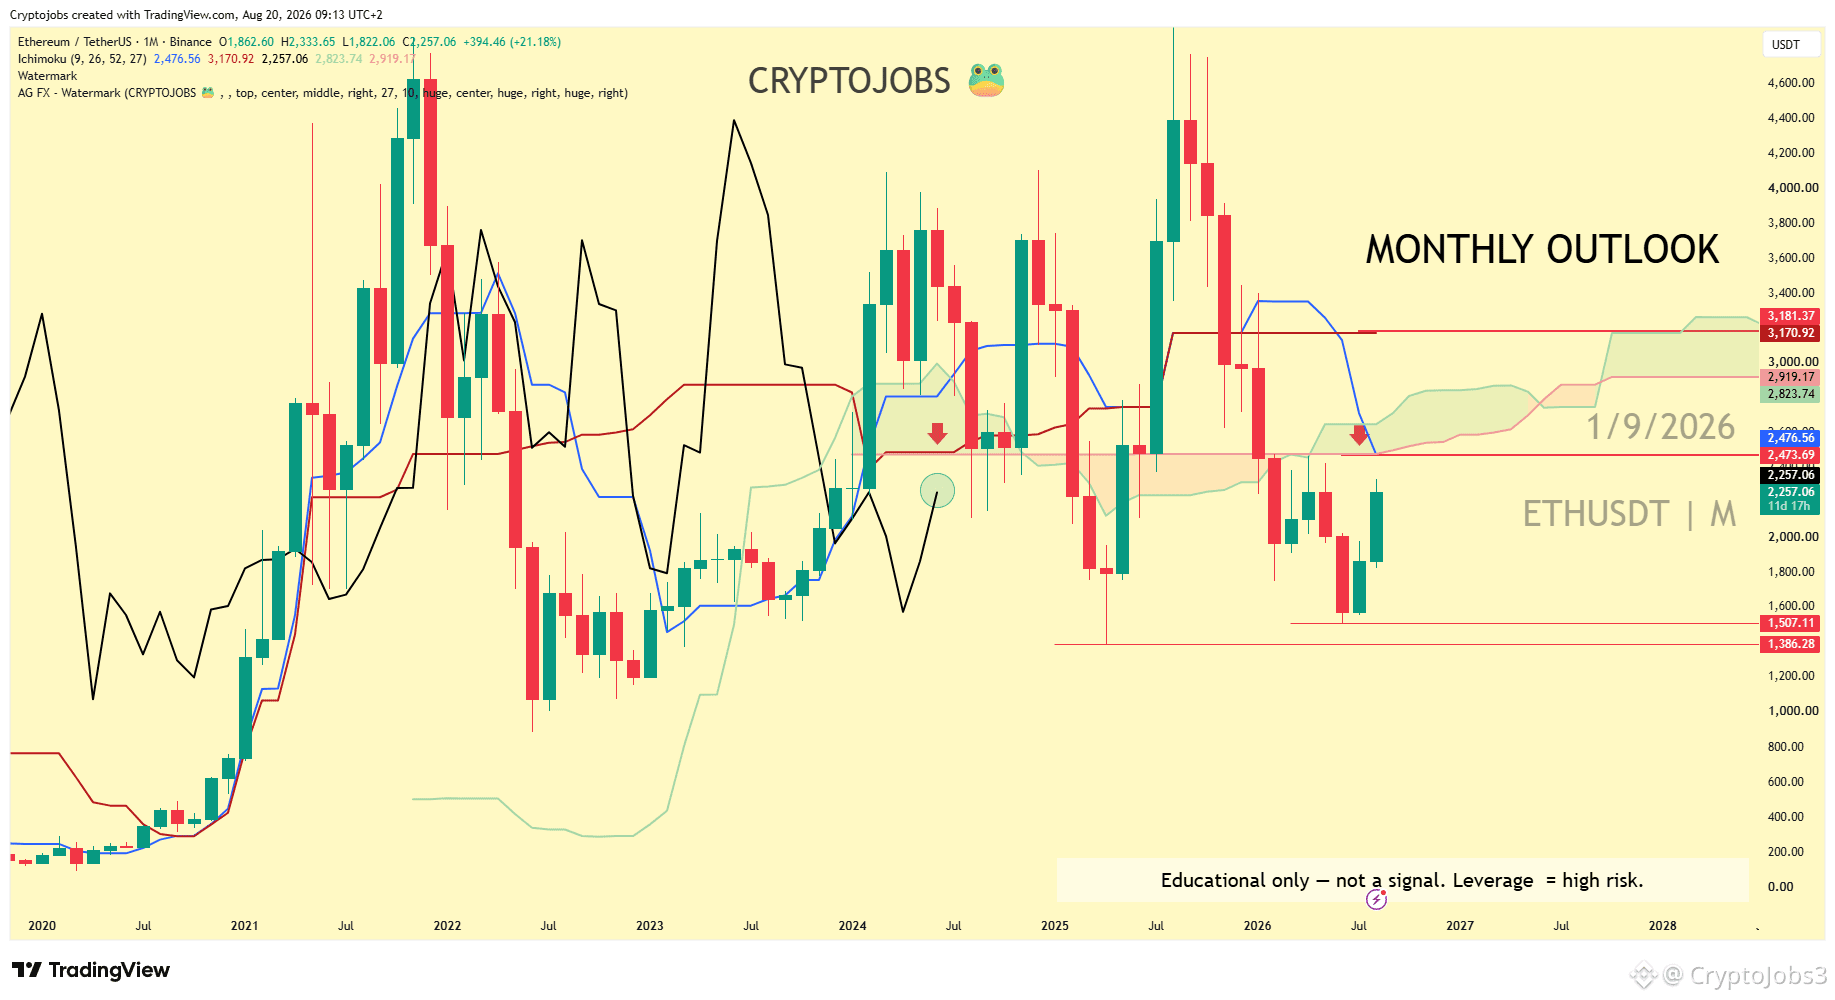
デイリー構造が一気に一目均衡表で強気に反転しました。FOMO(取り残され不安)による個人の急騰が起きているようですが、この動きを確認するために押し目が来ることを想定しています。/この動きを無効化する押し戻しも期待。
強気派は次に $2450 へ押し上げる可能性があります。月次のレジスタンスは $2480 - $2500 - にあります。このゾーンをブレイクできない限り、現時点の強気ムーブはまだ信用しきれません。
それを上抜けすれば、強気トレンドはより大きな波として $3150 - $3200 方向へ進む可能性もあります。
下方向で注目すべき需給ゾーン: $2100 - $2050。
私は現在個人的にはETHをショートしています。現在の高値(HH)付近の約 $2260 でエントリーし、押し目を狙っています 📉
あなたはどう見ていますか?👀
この動きを見ているなら、コメントで教えてください。
#ETH #Etherum
1
822

🚨 最新更新:$BNB $SOL
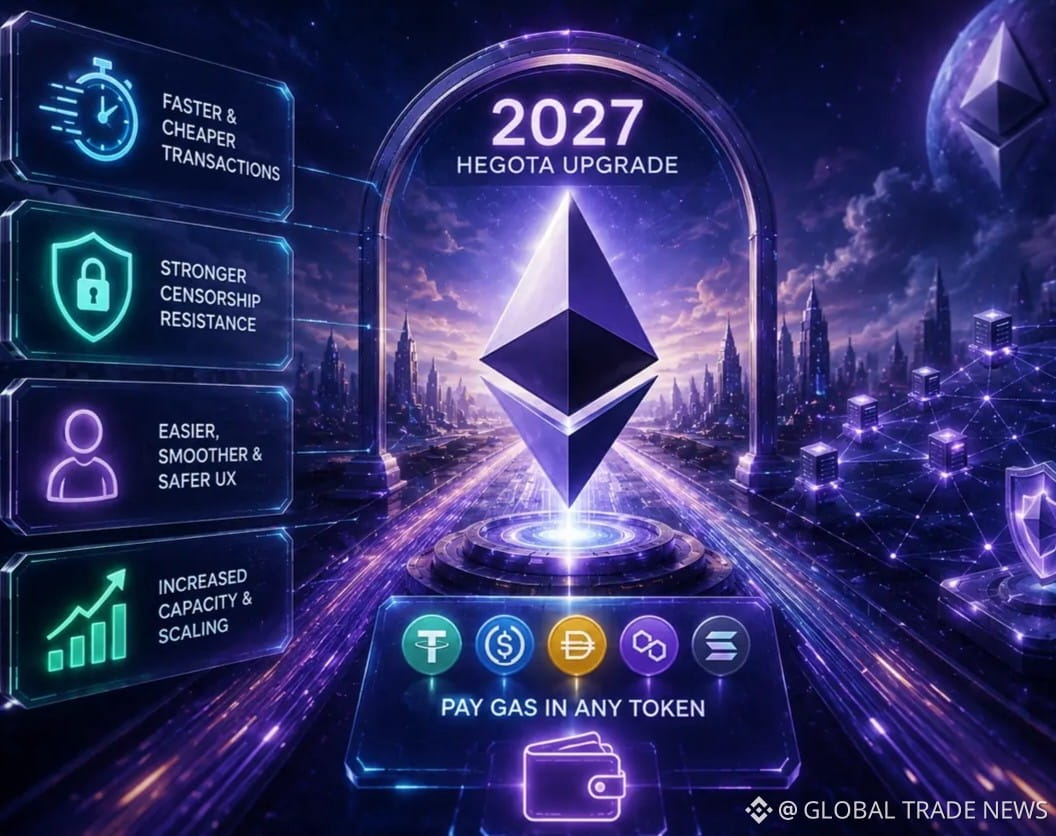
新たに承認されたEIP-8141のアップグレードにより、2027年にイーサリアムはステーブルコインでガス料金を支払えるようにします。
仕組み:ウォレットやアプリが裏側でネットワークに$ETH を支払い、ステーブルコイン残高から相当額が自動的に差し引かれます。
影響:カジュアルユーザーがネイティブのETHを保有する必要がなくなり、実際のETHのネットワーク需要を下げることなく、主要なメインストリーム導入のボトルネックを解消します。
{spot}(ETHUSDT)
{spot}(BNBUSDT)
{spot}(SOLUSDT)
#Etherum
#stablecoin
#IranToSetRestrictedZoneNearHormuz
#IranSaysItHit3USShips3Tankers
🚨 最新更新:$BNB $SOL
新たに承認されたEIP-8141のアップグレードにより、2027年にイーサリアムはステーブルコインでガス料金を支払えるようにします。
仕組み:ウォレットやアプリが裏側でネットワークに$ETH を支払い、ステーブルコイン残高から相当額が自動的に差し引かれます。
影響:カジュアルユーザーがネイティブのETHを保有する必要がなくなり、実際のETHのネットワーク需要を下げることなく、主要なメインストリーム導入のボトルネックを解消します。
#Etherum
#stablecoin
#IranToSetRestrictedZoneNearHormuz
#IranSaysItHit3USShips3Tankers
37

·
--
ブリッシュ
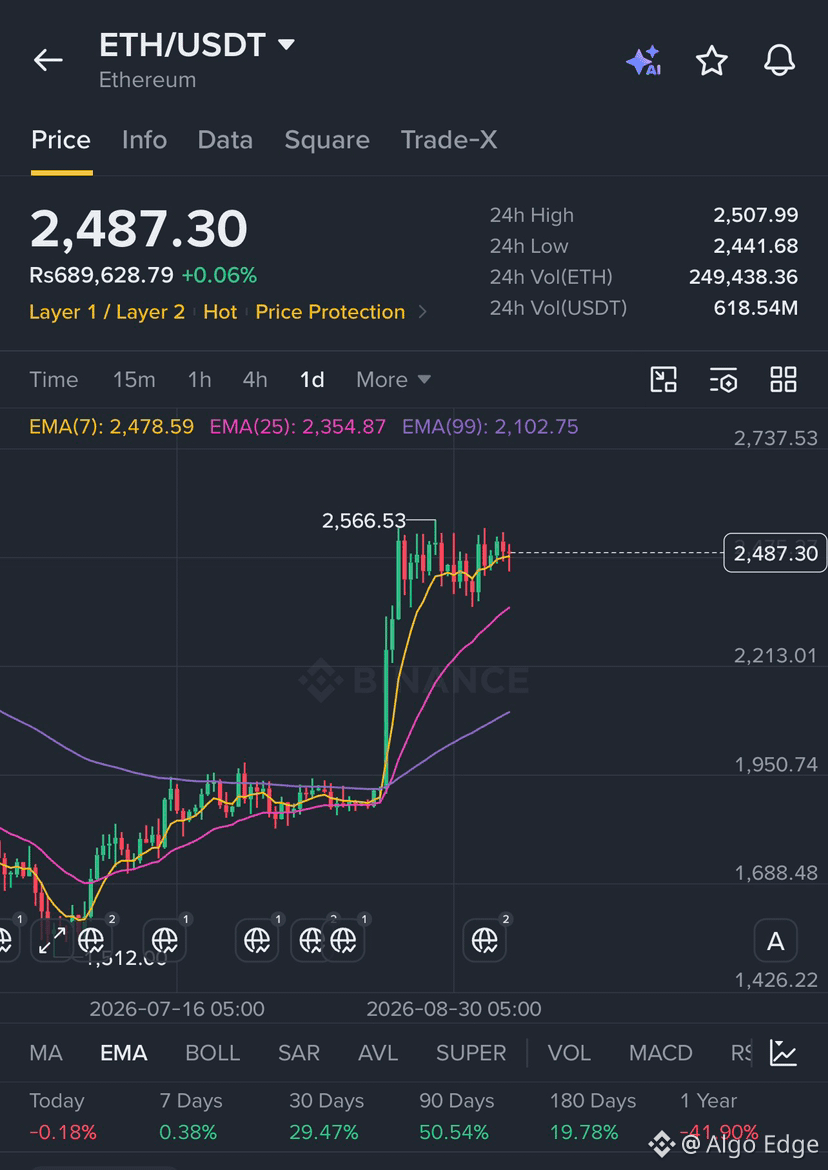
ETH/USDT — $2,550の下で足止め、9月を決める水準はこちら。
イーサリアムは現在およそ$2,500で推移しており、過去24時間で約+4%上昇していますが、それでも週次ではわずかに下落しています。ここ数週間で複数回、$2,550のレジスタンスゾーン($2,542の50週移動平均と一致)で跳ね返されています。つまり、強気(ブル)が突破して越える必要のある壁です。
主要レベル:
• レジスタンス:$2,534 → $2,550
• サポート:$2,438(0.618フィボ、週足)→それを下回ると、$2,334
• RSI 約67.5 — 強気だが、やや過熱気味に接近
見通し:
週足で$2,438を上回って終えることができれば、強気の9月シナリオが生き続けます。目標は、$2,534〜$2,550がようやくブレイクするなら、$2,800〜$2,920です。$2,438を失うと反転し、次の下値目標は$2,220〜$2,334。さらに$2,000も再び視野に入ってきます。
材料:
直近の$2,550へのトライで出来高が薄れていることは、市場が求めているのは「次の失敗ブレイク」ではなく「確認」だというサインです。月末に向けたセンチメント要因として、GlamsterdamアップグレードのSepoliaテストネットフォーク(9月28日)に注目してください。
私の見解:
今はちょうどコイントス級の局面です。$2,438が分岐点(サンドの線)。
それを維持=アルトシーズン継続。
それを失う=痛み。
※これは金融アドバイスではありません — 自分で調べてください(DYOR)。
2,438では強気か弱気か?
$ETH #ETH #Etherum #TechnicalAnalysiss
109

·
--
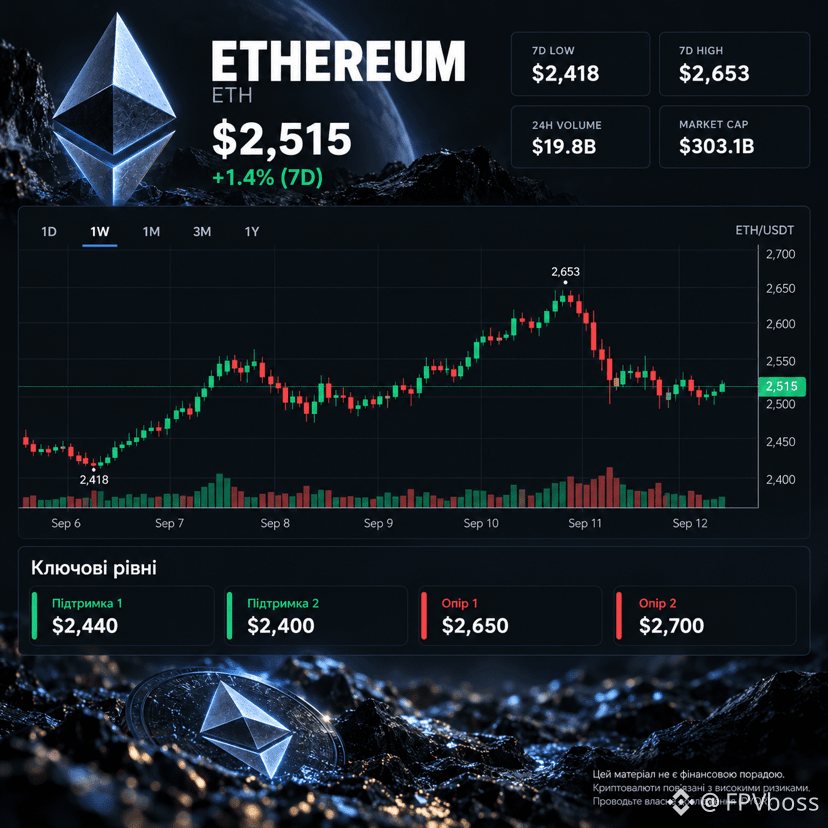
過去7日でイーサリアムは緩やかな上昇を見せましたが、$2,650〜2,660のゾーンをテストした後、調整が始まりました。
ポイント:
* 📈 トレンド:やや強気
* 🟢 サポート:$2,400〜2,440
* 🔴 レジスタンス:$2,650
* 🚀 $2,650を上回ると—$2,800〜3,000への潜在的な動き
* ⚠️ $2,400を下回ると—$2,200〜2,300まで下落するリスク
現在、ETHはレンジ(保ち合い)のゾーンにあるため、$2,400と$2,650に対する価格の反応が最も重要になります。#etherum $ETH
この資料は金融アドバイスではありません。暗号資産には高いリスクが伴います。必ずご自身で調査してください(DYOR)。
ポイント:
* 📈 トレンド:やや強気
* 🟢 サポート:$2,400〜2,440
* 🔴 レジスタンス:$2,650
* 🚀 $2,650を上回ると—$2,800〜3,000への潜在的な動き
* ⚠️ $2,400を下回ると—$2,200〜2,300まで下落するリスク
現在、ETHはレンジ(保ち合い)のゾーンにあるため、$2,400と$2,650に対する価格の反応が最も重要になります。#etherum $ETH
この資料は金融アドバイスではありません。暗号資産には高いリスクが伴います。必ずご自身で調査してください(DYOR)。
1
1
925

·
--
記事
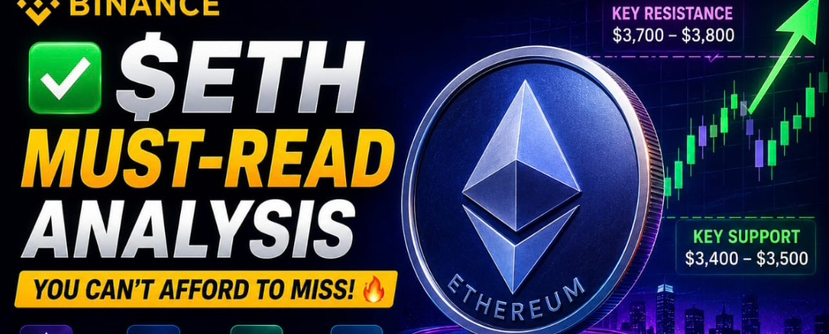
$ETH 必見の分析、見逃せない!イーサリアム($ETH)は再び暗号通貨市場で注目の中心になりつつある。最近の市場の変動の中で強い耐性を示した後、ETHは次の大きな動きを決定する可能性のある重要なレジスタンスレベル付近で取引されている。
なぜイーサリアム $ETH が注目を集めているのか
イーサリアム周辺の強気センチメントの高まりに寄与しているいくつかの要因:
イーサリアムベースの製品に対する機関投資家の関心が高まっている。
分散型金融(DeFi)アプリケーションの継続的な成長。
強いネットワーク活動と増加する取引量。
$ETH 必見の分析、見逃せない!
イーサリアム($ETH )は再び暗号通貨市場で注目の中心になりつつある。最近の市場の変動の中で強い耐性を示した後、ETHは次の大きな動きを決定する可能性のある重要なレジスタンスレベル付近で取引されている。
なぜイーサリアム $ETH が注目を集めているのか
イーサリアム周辺の強気センチメントの高まりに寄与しているいくつかの要因:
イーサリアムベースの製品に対する機関投資家の関心が高まっている。
分散型金融(DeFi)アプリケーションの継続的な成長。
強いネットワーク活動と増加する取引量。
なぜイーサリアム $ETH が注目を集めているのか
イーサリアム周辺の強気センチメントの高まりに寄与しているいくつかの要因:
イーサリアムベースの製品に対する機関投資家の関心が高まっている。
分散型金融(DeFi)アプリケーションの継続的な成長。
強いネットワーク活動と増加する取引量。
90

·
--
イーサリアム 2026年5月
イーサリアムは引き続き機関投資家や開発者コミュニティを惹きつけています。
#Bitmine aが25000を取得し、$ETH が資産に対する信頼を強化しています。その一方で、#ETHPrague はスケーラビリティソリューションやDeFiの革新を強調しています。
イーサリアムは採用と革新を組み合わせ、ブロックチェーンエコシステムの柱であり続けています。
{future}(ETHUSDT)
{future}(BNBUSDT)
{future}(XRPUSDT)
$ETH $BNB
#Etherum #ETH #Blockchain
イーサリアム 2026年5月
イーサリアムは引き続き機関投資家や開発者コミュニティを惹きつけています。
#Bitmine aが25000を取得し、$ETH が資産に対する信頼を強化しています。その一方で、#ETHPrague はスケーラビリティソリューションやDeFiの革新を強調しています。
イーサリアムは採用と革新を組み合わせ、ブロックチェーンエコシステムの柱であり続けています。
$ETH $BNB
#Etherum #ETH #Blockchain
イーサリアムは引き続き機関投資家や開発者コミュニティを惹きつけています。
#Bitmine aが25000を取得し、$ETH が資産に対する信頼を強化しています。その一方で、#ETHPrague はスケーラビリティソリューションやDeFiの革新を強調しています。
イーサリアムは採用と革新を組み合わせ、ブロックチェーンエコシステムの柱であり続けています。
$ETH $BNB
#Etherum #ETH #Blockchain
179

このサイクルでどちらが流動性を支配するのか?⚔️
$ETHが機関投資家の優位性と、従来型DeFiの流動性を維持する一方で、$SOLは小口投資家の取引量、メメコイン、そして取引速度を積み上げ続けています。
📊 考慮すべき主な要因:
Solana:高いスケーラビリティ、低い手数料、そして大規模な採用。
Ethereum:比類のない安全性、ETF、そして継続的なバーン。
今後12か月、ポートフォリオに1つだけ残すなら、どちらを選びますか?👇
#solana #etherum #Crypto #BinanceSqua
$NVDAB
{spot}(ETHUSDT)
{spot}(SOLUSDT)
このサイクルでどちらが流動性を支配するのか?⚔️
$ETHが機関投資家の優位性と、従来型DeFiの流動性を維持する一方で、$SOLは小口投資家の取引量、メメコイン、そして取引速度を積み上げ続けています。
📊 考慮すべき主な要因:
Solana:高いスケーラビリティ、低い手数料、そして大規模な採用。
Ethereum:比類のない安全性、ETF、そして継続的なバーン。
今後12か月、ポートフォリオに1つだけ残すなら、どちらを選びますか?👇
#solana #etherum #Crypto #BinanceSqua
$NVDAB
$ETHが機関投資家の優位性と、従来型DeFiの流動性を維持する一方で、$SOLは小口投資家の取引量、メメコイン、そして取引速度を積み上げ続けています。
📊 考慮すべき主な要因:
Solana:高いスケーラビリティ、低い手数料、そして大規模な採用。
Ethereum:比類のない安全性、ETF、そして継続的なバーン。
今後12か月、ポートフォリオに1つだけ残すなら、どちらを選びますか?👇
#solana #etherum #Crypto #BinanceSqua
$NVDAB
Ethereum
57%
Solana
43%
7 投票 • 投票は終了しました
257

·
--
イーサリアムは今日少しずつフェードアウトしているよ。劇的なクラッシュじゃなくて、静かにじわじわと下がっている感じ。正直言って、これが一番メンタルに来るディップなんだよね。
すべてに疑いを持ち始める。エントリーポイント、リサーチ、直感。ゆっくりとした赤い日がもたらす沈黙は、突然のクラッシュとは全然違う影響を与えるんだ。
でも、誰も大声では言わないことがある。世界を変えたテクノロジーは、どこかで壊れているように見えたってこと。インターネットは見捨てられたし、ビットコインは何度も死んだと宣言された。イーサリアムも同じだよ。
残った人たちは無謀じゃなかった。ただ、他の人たちが忘れた時に自分たちが持っているものを理解していたんだ。
価格は動いたり変わったりするけど、君のビジョンは変わる必要はない。
厳しい一週間が、君が初めてこのテクノロジーを信じた日のことを再定義させてはいけない。📉🙏
#ETH #Etherum #BitcoinTwoMonthLowStocksHitATH #StayTheCourse
{spot}(ETHUSDT)
イーサリアムは今日少しずつフェードアウトしているよ。劇的なクラッシュじゃなくて、静かにじわじわと下がっている感じ。正直言って、これが一番メンタルに来るディップなんだよね。
すべてに疑いを持ち始める。エントリーポイント、リサーチ、直感。ゆっくりとした赤い日がもたらす沈黙は、突然のクラッシュとは全然違う影響を与えるんだ。
でも、誰も大声では言わないことがある。世界を変えたテクノロジーは、どこかで壊れているように見えたってこと。インターネットは見捨てられたし、ビットコインは何度も死んだと宣言された。イーサリアムも同じだよ。
残った人たちは無謀じゃなかった。ただ、他の人たちが忘れた時に自分たちが持っているものを理解していたんだ。
価格は動いたり変わったりするけど、君のビジョンは変わる必要はない。
厳しい一週間が、君が初めてこのテクノロジーを信じた日のことを再定義させてはいけない。📉🙏
#ETH #Etherum #BitcoinTwoMonthLowStocksHitATH #StayTheCourse
2
2
320
$ETH イーサリアム(ETH)分析 — 2026年7月1日
現在価格: 約$1,574
24時間の変化: -1.62%
イーサリアムは明確な下落トレンドにあり、主要な移動平均がすべて価格を上回る形で積み上がっています——7日移動平均は$1,578、20日移動平均は$1,667、50日移動平均は$1,848、200日移動平均は$2,288です。MACDは深いマイナス水準(-74.36)を維持しており、弱気の勢いを裏付けています。
とはいきり、2つの逆シグナルが目立ちます。ストキャスティクス(23/18)は売られ過ぎの領域に深く入りつつあり、%Kが%Dを上抜けています——これは教科書的な早期の反転シグナルです。さらに、ボリンジャー%Bの値0.19は、ETHが下限バンドからわずか約$60上にいることを示しており、**$1,515**付近です。
注目すべき重要水準:
· サポート:$1,548(最初のクッション)→ $1,515(重大な最後の防衛ライン)
· レジスタンス:$1,602 → $1,630(大きな壁)→ $1,667(SMA20、強気/弱気の分岐線)
ファンダメンタル面の逆風は依然として強いです。米上場のスポット型イーサETFは、6月17日以降の純流出が**$345M**。また、シティグループは12か月のETH目標を**$3,175から$2,240へ**引き下げました。月次のネットワーク手数料は、4月の$24.4Mから6月には$10.7Mへ減少しています。
見通し:ETHが$1,515を試す確率は60%で、その後の持続的な回復にはまだ時間がかかりそうです。$1,515をきれいに下抜けると、$1,400〜$1,380までの道が開ける可能性があります。弱気シナリオを変えるのは、日足で$1,667を上抜けることだけです。
{spot}(ETHUSDT)
#ETH #Etherum #Trading
$ETH イーサリアム(ETH)分析 — 2026年7月1日
現在価格: 約$1,574
24時間の変化: -1.62%
イーサリアムは明確な下落トレンドにあり、主要な移動平均がすべて価格を上回る形で積み上がっています——7日移動平均は$1,578、20日移動平均は$1,667、50日移動平均は$1,848、200日移動平均は$2,288です。MACDは深いマイナス水準(-74.36)を維持しており、弱気の勢いを裏付けています。
とはいきり、2つの逆シグナルが目立ちます。ストキャスティクス(23/18)は売られ過ぎの領域に深く入りつつあり、%Kが%Dを上抜けています——これは教科書的な早期の反転シグナルです。さらに、ボリンジャー%Bの値0.19は、ETHが下限バンドからわずか約$60上にいることを示しており、**$1,515**付近です。
注目すべき重要水準:
· サポート:$1,548(最初のクッション)→ $1,515(重大な最後の防衛ライン)
· レジスタンス:$1,602 → $1,630(大きな壁)→ $1,667(SMA20、強気/弱気の分岐線)
ファンダメンタル面の逆風は依然として強いです。米上場のスポット型イーサETFは、6月17日以降の純流出が**$345M**。また、シティグループは12か月のETH目標を**$3,175から$2,240へ**引き下げました。月次のネットワーク手数料は、4月の$24.4Mから6月には$10.7Mへ減少しています。
見通し:ETHが$1,515を試す確率は60%で、その後の持続的な回復にはまだ時間がかかりそうです。$1,515をきれいに下抜けると、$1,400〜$1,380までの道が開ける可能性があります。弱気シナリオを変えるのは、日足で$1,667を上抜けることだけです。
#ETH #Etherum #Trading

98

ログインして、さらにコンテンツを読む
厳選トピックで世界の暗号資産トレーダーの仲間入り
⚡️ 暗号資産に関する最新かつ有益な情報が見つかります。
💬 世界最大の暗号資産取引所から信頼されています。
👍 認証を受けたクリエイターから、有益なインサイトを得られます。
メール / 電話番号
トレンドトピック
1
#BinancePick
閲覧回数 3.1M
152,815人が討論中
2
#EarningsSeason
閲覧回数 5.3M
25,990人が討論中
3
#AnthropicTTMRevenueGrewAbout1200%
閲覧回数 29,072
414人が討論中
4
#AnthropicS1ExpectedToday
閲覧回数 25,714
342人が討論中
5
#SouthKoreaReportedlyWeighsFourthCryptoTaxDelay
閲覧回数 30,183
468人が討論中
6
#FranklinTempletonFilesForTwoDividendToBitcoinETFs
閲覧回数 39,779
538人が討論中
7
#StrategyMSTRSurpassesNasdaqInMarketCap
閲覧回数 30,172
384人が討論中
8
#CanadaProposesStablecoinRedemptionWithin3BusinessDays
閲覧回数 1,320
36人が討論中
9
#ElectrumWalletBugLetRogueServersStealFunds
閲覧回数 30,934
461人が討論中
10
#ArgentineCourtDismissesLIBRACaseAgainstMilei
閲覧回数 46,326
578人が討論中