
#nearanalysis
nearanalysis
閲覧回数 7,204
34人が討論中
注目
最新

記事
翻訳参照
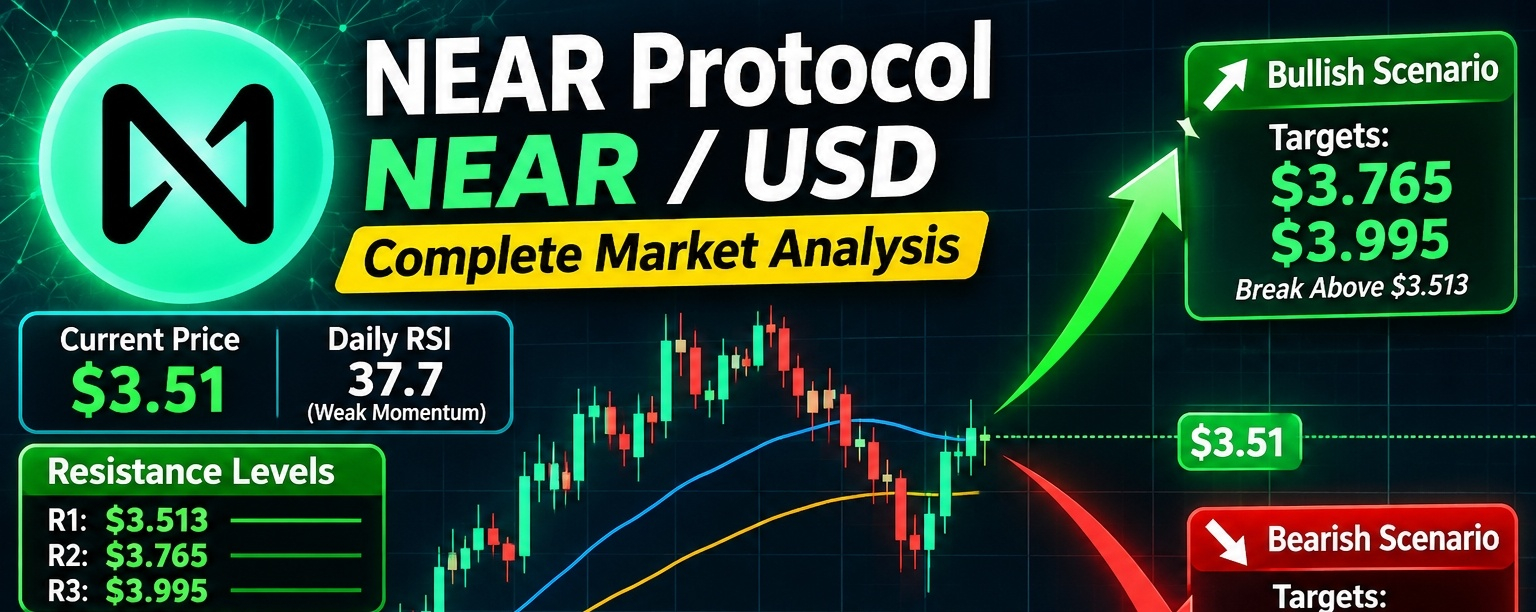
NEAR Protocol (NEAR/USD) – Complete Market Analysis$NEAR Protocol (NEAR/USD) – Complete Market Analysis
### NEAR / USD
Cryptocurrency market analysis
$NEAR Protocol is a Layer-1 blockchain designed for scalability, low transaction costs, and decentralized applications. Its ecosystem also focuses on chain abstraction and AI-related blockchain infrastructure.
{spot}(NEARUSDT)
This analysis covers market direction, technical indicators, support and resistance, bullish and bearish scenarios, and possible trading strategies.
### 1\. Current market overview
November 13, 2026 market data
NEAR reference price
### $3.51
Approximate spot price
Daily RSI
### 37.7
Weak momentum zone
First resistance
### $3.513
First support
### $3.262
Reference figures from November 13 technical data; prices change continuously. COINOTAG +1
### 2\. Technical analysis
RSI (Relative Strength Index)
* Daily RSI: 37.7.
* Weekly RSI: 53.
* Daily momentum is weak.
* Weekly momentum is relatively stronger.
* A recovery above 50 on the daily RSI would improve the bullish outlook.
Moving averages
The technical picture is mixed. Shorter-term averages show some buying signals, while several longer-term averages remain bearish. Investing.com India +1
MACD
The Investing.com indicator snapshot reports a sell signal for MACD. This suggests that bullish momentum has not been firmly established. Investing.com India
### 3\. Important support and resistance levels
Resistance levels
Major resistance 3
$3.995
Resistance 2
$3.765
Immediate resistance
$3.513
Current reference price
### $3.51
Support levels
Immediate support
$3.262
Support 2
$3.057
Major support 3
$2.827
Technical reference levels, not guaranteed price targets. COINOTAG
### 4\. Bullish scenario
If $NEAR breaks above $3.513 and maintains that level with strong trading volume:
* First target: $3.765.
* Second target: $3.995.
* Further upside requires a convincing breakout above $4.00.
A daily candle close above $3.765 would strengthen the bullish structure.
### 5\. Bearish scenario
If NEAR fails to hold its support:
* First downside target: $3.262.
* Second downside target: $3.057.
* Major downside support: $2.827.
A daily close below $3.262 would weaken the recovery setup considerably.
### 6\. Fundamental analysis
NEAR has several important developments:
* Tokenomics: Governance approved a proposal to reduce maximum annual token issuance from 2.5% to 1.6% over 24 months. It still requires further implementation steps. The Block
* NEAR Intents: The protocol is expanding cross-chain transaction infrastructure.
* AI infrastructure: NEAR is positioning itself for AI agents and programmable financial services.
* Buybacks: NEAR's February 2026 fee-switch activation introduced protocol revenue-funded token buybacks. Tokenomics, Stack, and Roadmap
These developments could support long-term demand, but adoption and actual revenue growth must continue.
### 7\. Trading strategy
| Strategy | Entry / confirmation |
| ----------------- | ----------------------------- |
| Aggressive buy | Near $3.26 after confirmation |
| Breakout buy | Above $3.52 |
| Stronger breakout | Above $3.77 |
| Profit target 1 | $3.765 |
| Profit target 2 | $3.995 |
| Risk warning | Daily close below $3.262 |
These are illustrative setups, not guaranteed trades. Use stop-losses and avoid excessive leverage.
### 8\. Overall market outlook
NEAR/USD market assessment
Mixed / cautious
* Short-term: Bearish pressure and volatility.
* Medium-term: Recovery possible above resistance.
* Long-term: Fundamental potential, subject to adoption.
* Key bullish trigger: Break above $3.513.
* Key bearish trigger: Break below $3.262.
My conclusion: NEAR is approaching an important decision area around $3.51. I would avoid chasing a trade without confirmation. Watch $3.513 for a bullish breakout and $3.262 for downside risk.
This is market analysis, not financial advice. Always verify live Binance prices before entering a trade.
Sources for further research
I can also create a professional NEAR/USD trading infographic showing the support, resistance, bullish targets, and bearish targets.
#NEAR🚀🚀🚀 #NEARUSDT #NEARAnalysis #TrendingPredictions
NEAR Protocol (NEAR/USD) – Complete Market Analysis
$NEAR Protocol (NEAR/USD) – Complete Market Analysis
### NEAR / USD
Cryptocurrency market analysis
$NEAR Protocol is a Layer-1 blockchain designed for scalability, low transaction costs, and decentralized applications. Its ecosystem also focuses on chain abstraction and AI-related blockchain infrastructure.
This analysis covers market direction, technical indicators, support and resistance, bullish and bearish scenarios, and possible trading strategies.
### 1\. Current market overview
November 13, 2026 market data
NEAR reference price
### $3.51
Approximate spot price
Daily RSI
### 37.7
Weak momentum zone
First resistance
### $3.513
First support
### $3.262
Reference figures from November 13 technical data; prices change continuously. COINOTAG +1
### 2\. Technical analysis
RSI (Relative Strength Index)
* Daily RSI: 37.7.
* Weekly RSI: 53.
* Daily momentum is weak.
* Weekly momentum is relatively stronger.
* A recovery above 50 on the daily RSI would improve the bullish outlook.
Moving averages
The technical picture is mixed. Shorter-term averages show some buying signals, while several longer-term averages remain bearish. Investing.com India +1
MACD
The Investing.com indicator snapshot reports a sell signal for MACD. This suggests that bullish momentum has not been firmly established. Investing.com India
### 3\. Important support and resistance levels
Resistance levels
Major resistance 3
$3.995
Resistance 2
$3.765
Immediate resistance
$3.513
Current reference price
### $3.51
Support levels
Immediate support
$3.262
Support 2
$3.057
Major support 3
$2.827
Technical reference levels, not guaranteed price targets. COINOTAG
### 4\. Bullish scenario
If $NEAR breaks above $3.513 and maintains that level with strong trading volume:
* First target: $3.765.
* Second target: $3.995.
* Further upside requires a convincing breakout above $4.00.
A daily candle close above $3.765 would strengthen the bullish structure.
### 5\. Bearish scenario
If NEAR fails to hold its support:
* First downside target: $3.262.
* Second downside target: $3.057.
* Major downside support: $2.827.
A daily close below $3.262 would weaken the recovery setup considerably.
### 6\. Fundamental analysis
NEAR has several important developments:
* Tokenomics: Governance approved a proposal to reduce maximum annual token issuance from 2.5% to 1.6% over 24 months. It still requires further implementation steps. The Block
* NEAR Intents: The protocol is expanding cross-chain transaction infrastructure.
* AI infrastructure: NEAR is positioning itself for AI agents and programmable financial services.
* Buybacks: NEAR's February 2026 fee-switch activation introduced protocol revenue-funded token buybacks. Tokenomics, Stack, and Roadmap
These developments could support long-term demand, but adoption and actual revenue growth must continue.
### 7\. Trading strategy
| Strategy | Entry / confirmation |
| ----------------- | ----------------------------- |
| Aggressive buy | Near $3.26 after confirmation |
| Breakout buy | Above $3.52 |
| Stronger breakout | Above $3.77 |
| Profit target 1 | $3.765 |
| Profit target 2 | $3.995 |
| Risk warning | Daily close below $3.262 |
These are illustrative setups, not guaranteed trades. Use stop-losses and avoid excessive leverage.
### 8\. Overall market outlook
NEAR/USD market assessment
Mixed / cautious
* Short-term: Bearish pressure and volatility.
* Medium-term: Recovery possible above resistance.
* Long-term: Fundamental potential, subject to adoption.
* Key bullish trigger: Break above $3.513.
* Key bearish trigger: Break below $3.262.
My conclusion: NEAR is approaching an important decision area around $3.51. I would avoid chasing a trade without confirmation. Watch $3.513 for a bullish breakout and $3.262 for downside risk.
This is market analysis, not financial advice. Always verify live Binance prices before entering a trade.
Sources for further research
I can also create a professional NEAR/USD trading infographic showing the support, resistance, bullish targets, and bearish targets.
#NEAR🚀🚀🚀 #NEARUSDT #NEARAnalysis #TrendingPredictions
### NEAR / USD
Cryptocurrency market analysis
$NEAR Protocol is a Layer-1 blockchain designed for scalability, low transaction costs, and decentralized applications. Its ecosystem also focuses on chain abstraction and AI-related blockchain infrastructure.
This analysis covers market direction, technical indicators, support and resistance, bullish and bearish scenarios, and possible trading strategies.
### 1\. Current market overview
November 13, 2026 market data
NEAR reference price
### $3.51
Approximate spot price
Daily RSI
### 37.7
Weak momentum zone
First resistance
### $3.513
First support
### $3.262
Reference figures from November 13 technical data; prices change continuously. COINOTAG +1
### 2\. Technical analysis
RSI (Relative Strength Index)
* Daily RSI: 37.7.
* Weekly RSI: 53.
* Daily momentum is weak.
* Weekly momentum is relatively stronger.
* A recovery above 50 on the daily RSI would improve the bullish outlook.
Moving averages
The technical picture is mixed. Shorter-term averages show some buying signals, while several longer-term averages remain bearish. Investing.com India +1
MACD
The Investing.com indicator snapshot reports a sell signal for MACD. This suggests that bullish momentum has not been firmly established. Investing.com India
### 3\. Important support and resistance levels
Resistance levels
Major resistance 3
$3.995
Resistance 2
$3.765
Immediate resistance
$3.513
Current reference price
### $3.51
Support levels
Immediate support
$3.262
Support 2
$3.057
Major support 3
$2.827
Technical reference levels, not guaranteed price targets. COINOTAG
### 4\. Bullish scenario
If $NEAR breaks above $3.513 and maintains that level with strong trading volume:
* First target: $3.765.
* Second target: $3.995.
* Further upside requires a convincing breakout above $4.00.
A daily candle close above $3.765 would strengthen the bullish structure.
### 5\. Bearish scenario
If NEAR fails to hold its support:
* First downside target: $3.262.
* Second downside target: $3.057.
* Major downside support: $2.827.
A daily close below $3.262 would weaken the recovery setup considerably.
### 6\. Fundamental analysis
NEAR has several important developments:
* Tokenomics: Governance approved a proposal to reduce maximum annual token issuance from 2.5% to 1.6% over 24 months. It still requires further implementation steps. The Block
* NEAR Intents: The protocol is expanding cross-chain transaction infrastructure.
* AI infrastructure: NEAR is positioning itself for AI agents and programmable financial services.
* Buybacks: NEAR's February 2026 fee-switch activation introduced protocol revenue-funded token buybacks. Tokenomics, Stack, and Roadmap
These developments could support long-term demand, but adoption and actual revenue growth must continue.
### 7\. Trading strategy
| Strategy | Entry / confirmation |
| ----------------- | ----------------------------- |
| Aggressive buy | Near $3.26 after confirmation |
| Breakout buy | Above $3.52 |
| Stronger breakout | Above $3.77 |
| Profit target 1 | $3.765 |
| Profit target 2 | $3.995 |
| Risk warning | Daily close below $3.262 |
These are illustrative setups, not guaranteed trades. Use stop-losses and avoid excessive leverage.
### 8\. Overall market outlook
NEAR/USD market assessment
Mixed / cautious
* Short-term: Bearish pressure and volatility.
* Medium-term: Recovery possible above resistance.
* Long-term: Fundamental potential, subject to adoption.
* Key bullish trigger: Break above $3.513.
* Key bearish trigger: Break below $3.262.
My conclusion: NEAR is approaching an important decision area around $3.51. I would avoid chasing a trade without confirmation. Watch $3.513 for a bullish breakout and $3.262 for downside risk.
This is market analysis, not financial advice. Always verify live Binance prices before entering a trade.
Sources for further research
I can also create a professional NEAR/USD trading infographic showing the support, resistance, bullish targets, and bearish targets.
#NEAR🚀🚀🚀 #NEARUSDT #NEARAnalysis #TrendingPredictions
48

·
--
ブリッシュ
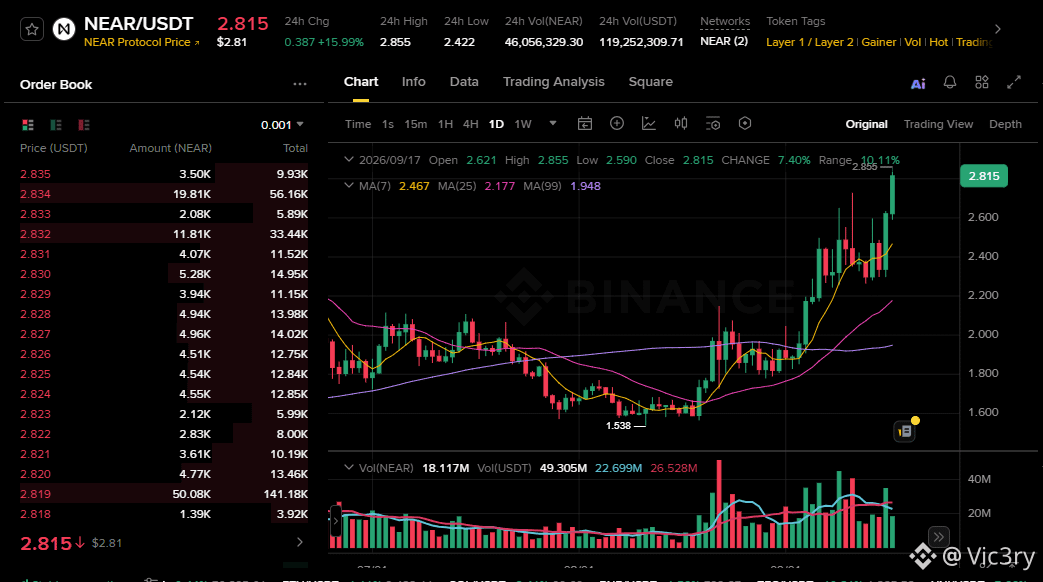
$NEAR 直近で約 $2.33 から $2.70 へ押し上げられ、24Hの出来高は約 $694M です。
この上昇が戻されず、高値付近で浅い押し目を形成し始めるなら、もう一度ブレイクアウトのセットアップが狙えそうです。
反応を見るために $2.50〜$2.60 を注視しています。
買い手がそのあたりを守るなら、次は $2.70、そして $3.00 を見ます。
$2.50 を割るようなら、私はよりきれいなセットアップが出るまで待ちたいです。
$NEAR は今、モメンタムがあります。
今度は、買い手がこの動きを継続(続伸)へつなげられるか確認したいです。👀
{spot}(NEARUSDT)
#NEARAnalysis
$NEAR 直近で約 $2.33 から $2.70 へ押し上げられ、24Hの出来高は約 $694M です。
この上昇が戻されず、高値付近で浅い押し目を形成し始めるなら、もう一度ブレイクアウトのセットアップが狙えそうです。
反応を見るために $2.50〜$2.60 を注視しています。
買い手がそのあたりを守るなら、次は $2.70、そして $3.00 を見ます。
$2.50 を割るようなら、私はよりきれいなセットアップが出るまで待ちたいです。
$NEAR は今、モメンタムがあります。
今度は、買い手がこの動きを継続(続伸)へつなげられるか確認したいです。👀
#NEARAnalysis
この上昇が戻されず、高値付近で浅い押し目を形成し始めるなら、もう一度ブレイクアウトのセットアップが狙えそうです。
反応を見るために $2.50〜$2.60 を注視しています。
買い手がそのあたりを守るなら、次は $2.70、そして $3.00 を見ます。
$2.50 を割るようなら、私はよりきれいなセットアップが出るまで待ちたいです。
$NEAR は今、モメンタムがあります。
今度は、買い手がこの動きを継続(続伸)へつなげられるか確認したいです。👀
#NEARAnalysis
1
38

·
--
ブリッシュ
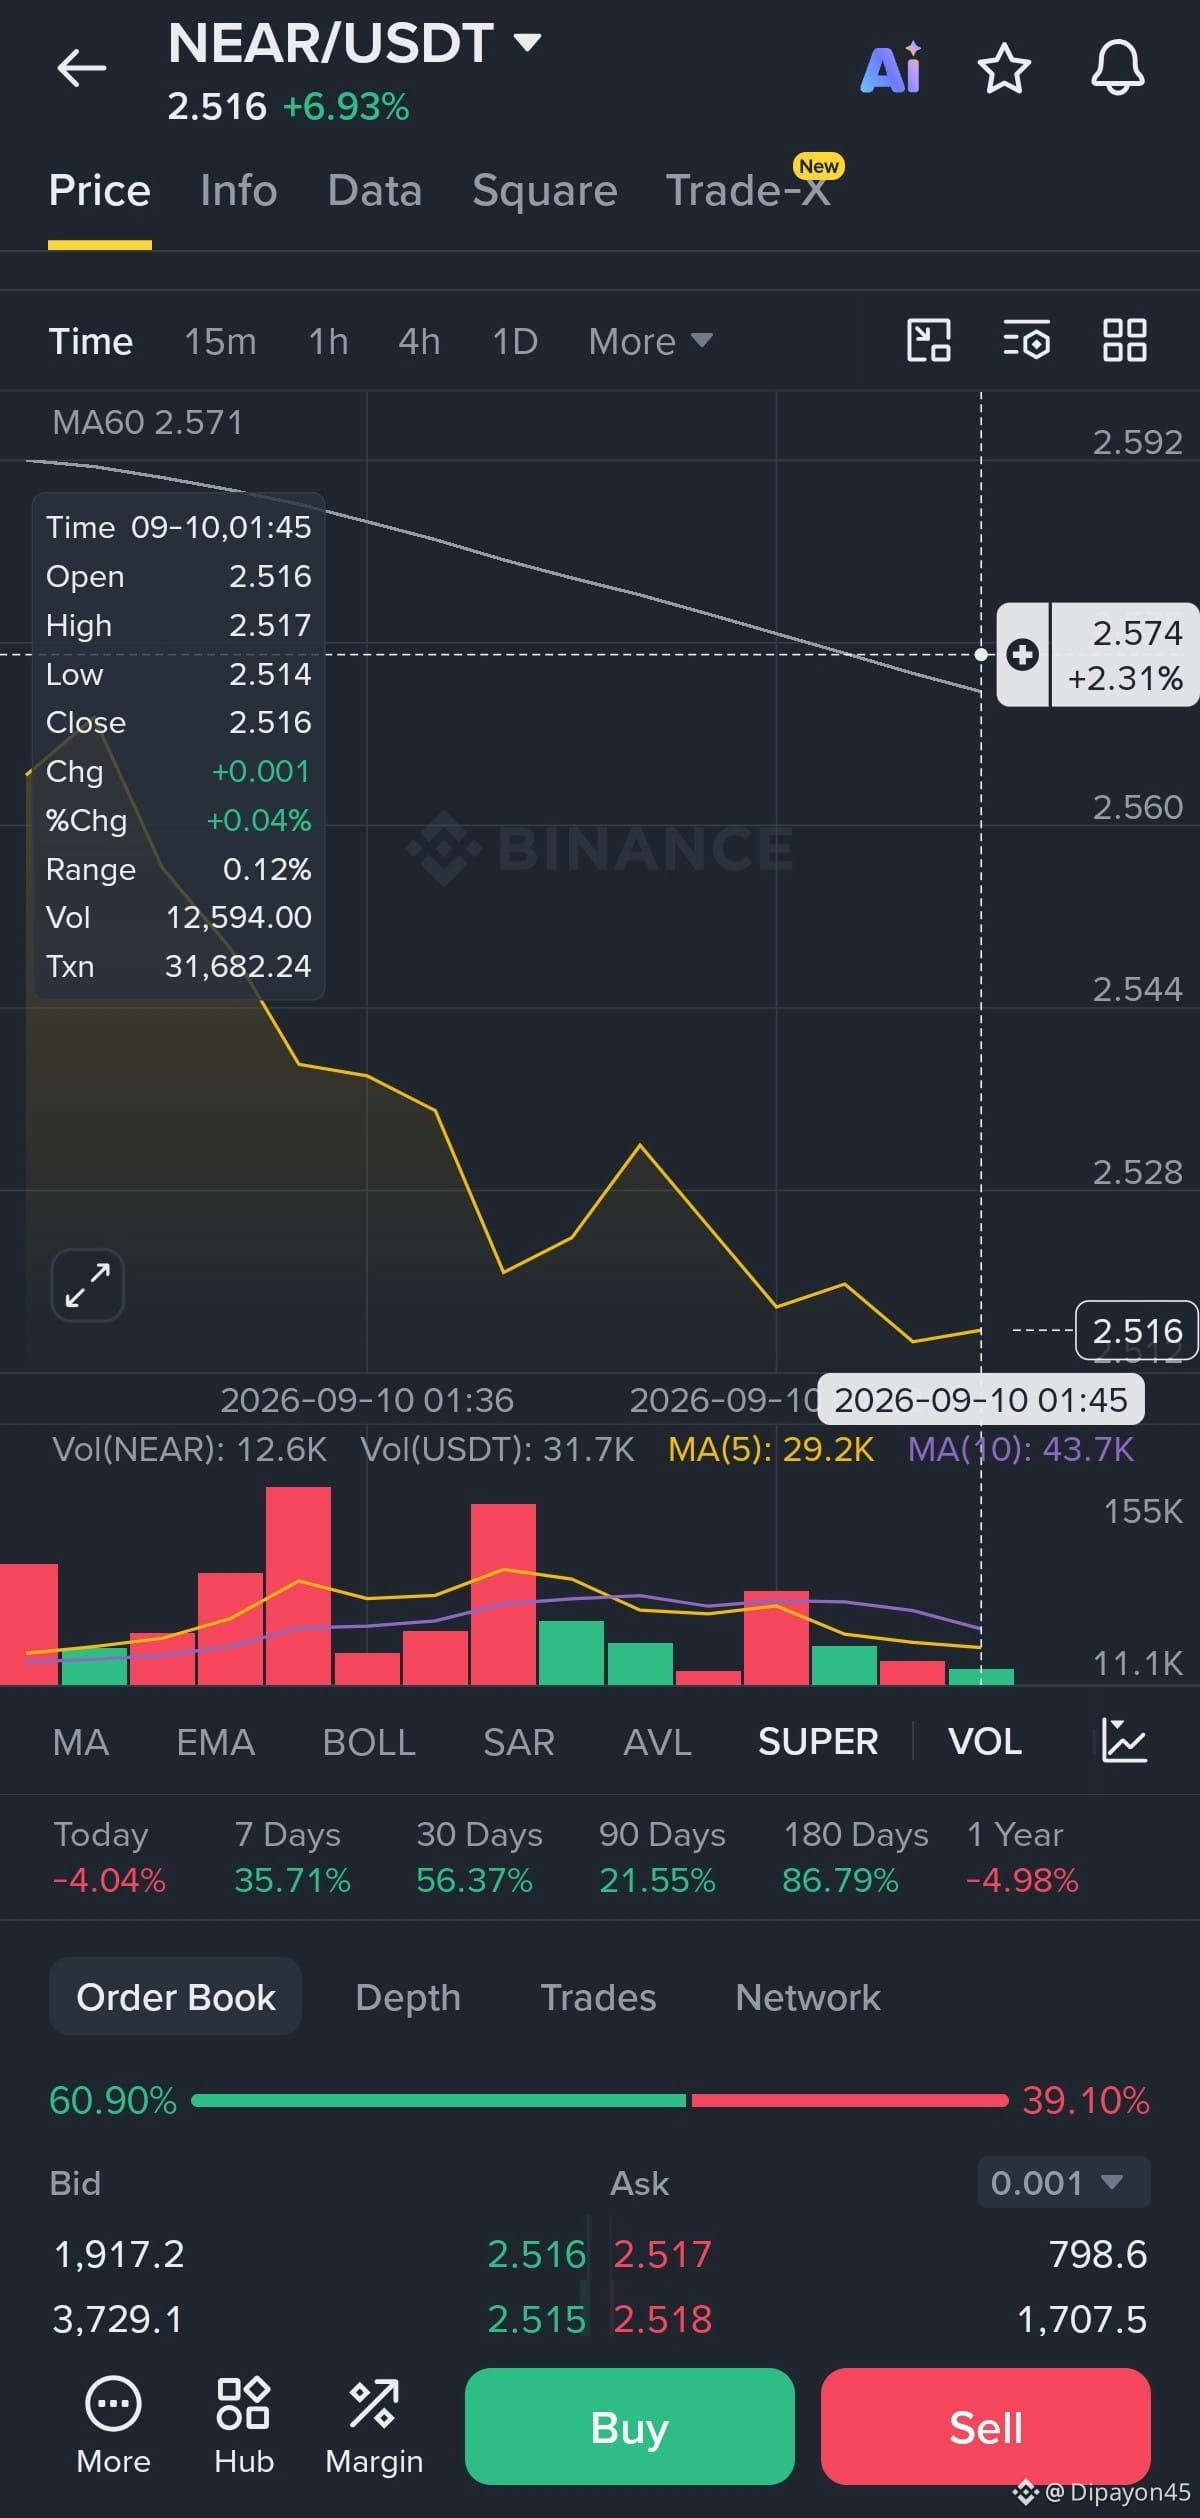
NEAR/USDTは現在2.516 USDTで、+6.93%の上昇を示しています。さらに良いのは、7日で+35.71%、30日で+56.37%、180日で+86.79%と好調なことです。つまり、長期にわたって強いパフォーマンスを見せています。
$NEAR
#NEARAnalysis
{future}(NEARUSDT)
NEAR/USDTは現在2.516 USDTで、+6.93%の上昇を示しています。さらに良いのは、7日で+35.71%、30日で+56.37%、180日で+86.79%と好調なことです。つまり、長期にわたって強いパフォーマンスを見せています。
$NEAR
#NEARAnalysis
$NEAR
#NEARAnalysis
96

·
--
記事
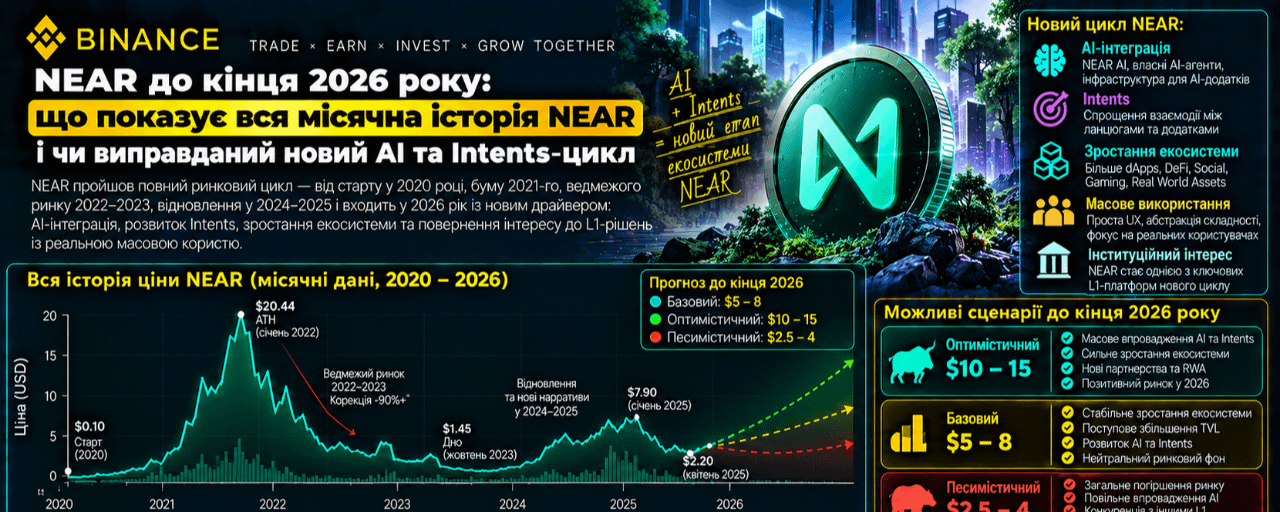
NEAR 2026年末まで:NEARの全月次履歴が示すものと、新しいAIおよびIntentsは妥当なのかNEARは、自身の歴史の中でも最も強い再評価の1つの後、2026年の最終局面に入っています。
9月27日時点で、NEARはおよそ:で取引されています。
$5,0–5,2。
А ще на початку вересня токен коштував близько:
$1,93.
つまり、1か月にも満たない期間でNEARは約:
+150%.
2026年の初めから、結果はすでに:
NEAR 2026年末まで:NEARの全月次履歴が示すものと、新しいAIおよびIntentsは妥当なのか
NEARは、自身の歴史の中でも最も強い再評価の1つの後、2026年の最終局面に入っています。
9月27日時点で、NEARはおよそ:で取引されています。
$5,0–5,2。
А ще на початку вересня токен коштував близько:
$1,93.
つまり、1か月にも満たない期間でNEARは約:
+150%.
2026年の初めから、結果はすでに:
9月27日時点で、NEARはおよそ:で取引されています。
$5,0–5,2。
А ще на початку вересня токен коштував близько:
$1,93.
つまり、1か月にも満たない期間でNEARは約:
+150%.
2026年の初めから、結果はすでに:
2
1.7k
ログインして、さらにコンテンツを読む
厳選トピックで世界の暗号資産トレーダーの仲間入り
⚡️ 暗号資産に関する最新かつ有益な情報が見つかります。
💬 世界最大の暗号資産取引所から信頼されています。
👍 認証を受けたクリエイターから、有益なインサイトを得られます。
メール / 電話番号
トレンドトピック
1
#USPPIMissMayEaseBTCPressure
閲覧回数 14,208
441人が討論中
2
#BitcoinCoreDisclosesTorTrafficVulnerability
閲覧回数 3,533
183人が討論中
3
#WhatWillDriveCryptoandStocks’NextRebound?
閲覧回数 110,682
1,380人が討論中
4
#BitcoinBreaksBelow200WeekMovingAverage
閲覧回数 26,604
364人が討論中
5
#SpaceXTeslaMergerTalksWouldCombine30220BTC
閲覧回数 9,300
189人が討論中
6
#Anthropic’s6xIPODemandSignalsPotentialRecordRaise
閲覧回数 36,503
628人が討論中
7
#USCryptoETFsLose$1.48BInFiveDays
閲覧回数 1,699
38人が討論中
8
#KoreaDigitalAssetBasicActFinalDraftExpectedEarlyJanuary
閲覧回数 3,304
19人が討論中
9
#RippleRLUSDMarketCapSurpassesPayPalPYUSD
閲覧回数 5,027
109人が討論中
10
#JaneStreetNearlyOctuplesFidelityBitcoinETFHoldings
閲覧回数 13,455
221人が討論中