
#dot
dot
閲覧回数 20.7M
29,866人が討論中
注目
最新

·
--
本人確認中

trade hodl coin:
Dot đang nhắm giá 0,75-0,78 ko biết có điều chỉnh tiếp 0,47 hay ko ( tuỳ thuộc thị trường,nhưng 075-078 là chắc chắn
1
1
721

·
--
ブリッシュ
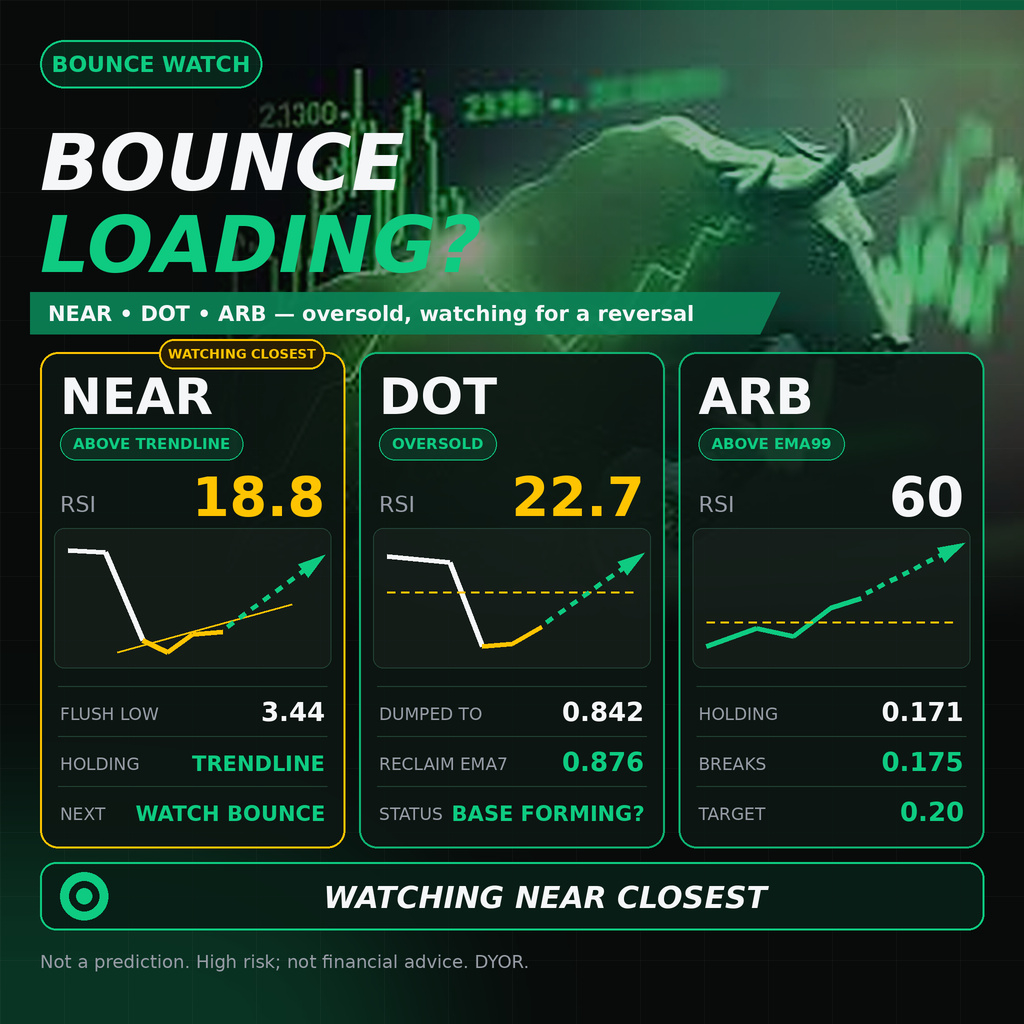
🔥 街には血が流れている。反発が近づいている 👀 #ARB #DOT #NEAR
$NEAR — RSIを見て。18.8だ。完全な投げ売りだ。3.44まで下落したが、トレンドラインを上回っている。反発すれば、激しい動きになる。
{future}(NEARUSDT)
$DOT — 0.842まで急落したが、すでに底を形成しつつある。RSIは22.7。大幅な売られすぎだ。0.876(EMA7)を一度上抜ければ、ショートスクイーズが始まる。
{future}(DOTUSDT)
$ARB — 3つの中で最も強い。0.171を維持し、すでにEMA99を上回っている。RSIは60。0.175を突破すれば、0.20まで戻す。
{future}(ARBUSDT)
個人投資家は底値でパニック売りしている。賢い資金はここで買い集めている。
ここでは#NEAR に最も注目。RSI 18はショート勢にとって時限爆弾だ。
#CryptoDropbit
🔥 街には血が流れている。反発が近づいている 👀 #ARB #DOT #NEAR
$NEAR — RSIを見て。18.8だ。完全な投げ売りだ。3.44まで下落したが、トレンドラインを上回っている。反発すれば、激しい動きになる。
$DOT — 0.842まで急落したが、すでに底を形成しつつある。RSIは22.7。大幅な売られすぎだ。0.876(EMA7)を一度上抜ければ、ショートスクイーズが始まる。
$ARB — 3つの中で最も強い。0.171を維持し、すでにEMA99を上回っている。RSIは60。0.175を突破すれば、0.20まで戻す。
個人投資家は底値でパニック売りしている。賢い資金はここで買い集めている。
ここでは#NEAR に最も注目。RSI 18はショート勢にとって時限爆弾だ。
#CryptoDropbit
$NEAR — RSIを見て。18.8だ。完全な投げ売りだ。3.44まで下落したが、トレンドラインを上回っている。反発すれば、激しい動きになる。
$DOT — 0.842まで急落したが、すでに底を形成しつつある。RSIは22.7。大幅な売られすぎだ。0.876(EMA7)を一度上抜ければ、ショートスクイーズが始まる。
$ARB — 3つの中で最も強い。0.171を維持し、すでにEMA99を上回っている。RSIは60。0.175を突破すれば、0.20まで戻す。
個人投資家は底値でパニック売りしている。賢い資金はここで買い集めている。
ここでは#NEAR に最も注目。RSI 18はショート勢にとって時限爆弾だ。
#CryptoDropbit
CamAnh10tu:
Chart looks bullish
5
7
3.2k


·
--
ブリッシュ
翻訳参照
$DOT to $10 is realistic 🫰🎀
.
Recovering to ten dollars through structural growth.
.
The Polkadot roadmap targets a sustained bull run to $10, beginning with the structural defense of the $1.00 parity base, followed by the adoption of core infrastructure upgrades like the JAM protocol to drive developer traction, and culminating in the overcoming of mid-range resistance zones and realization of peak cycle liquidity to achieve full-scale market cap expansion.
#PolkaDOT @PolkadotNetwork #DOT
{spot}(DOTUSDT)
$DOT to $10 is realistic 🫰🎀
.
Recovering to ten dollars through structural growth.
.
The Polkadot roadmap targets a sustained bull run to $10, beginning with the structural defense of the $1.00 parity base, followed by the adoption of core infrastructure upgrades like the JAM protocol to drive developer traction, and culminating in the overcoming of mid-range resistance zones and realization of peak cycle liquidity to achieve full-scale market cap expansion.
#PolkaDOT @Polkadot Network #DOT
.
Recovering to ten dollars through structural growth.
.
The Polkadot roadmap targets a sustained bull run to $10, beginning with the structural defense of the $1.00 parity base, followed by the adoption of core infrastructure upgrades like the JAM protocol to drive developer traction, and culminating in the overcoming of mid-range resistance zones and realization of peak cycle liquidity to achieve full-scale market cap expansion.
#PolkaDOT @Polkadot Network #DOT
1
86

·
--
翻訳参照
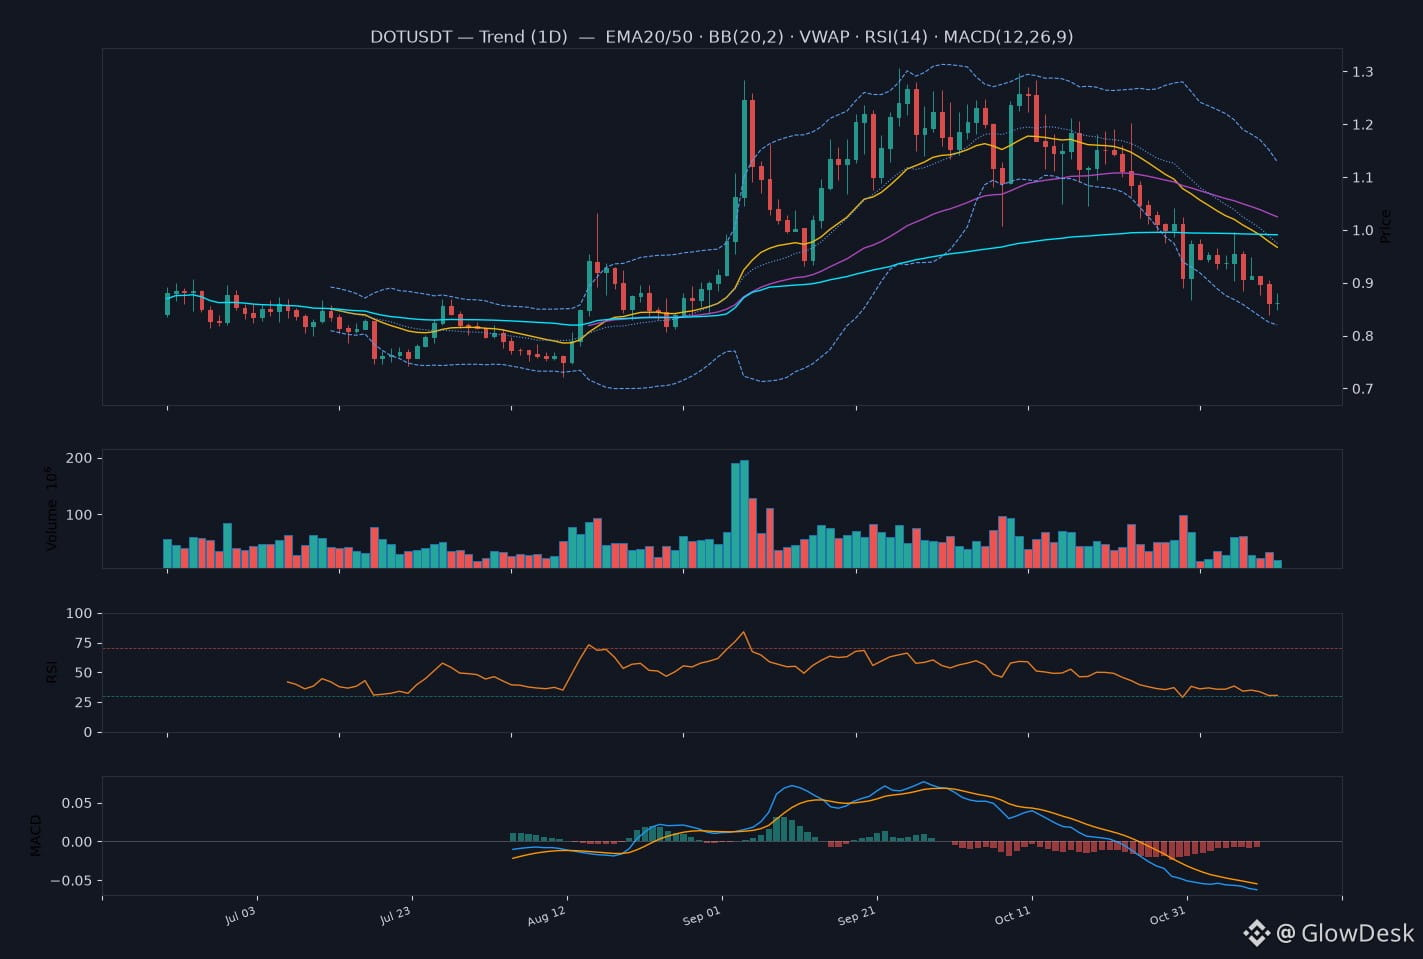
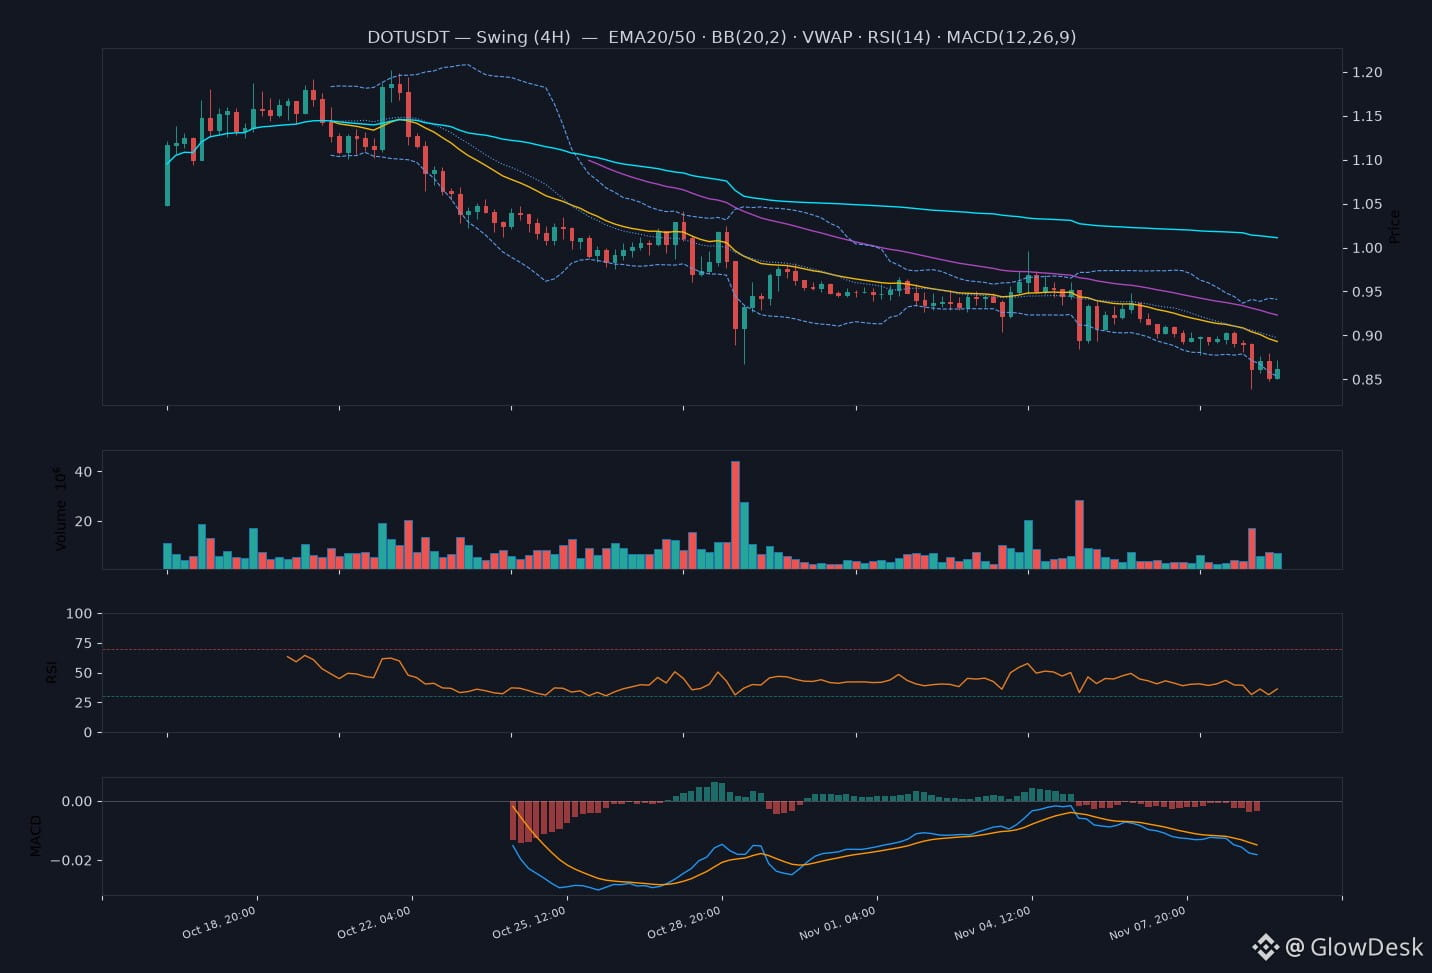
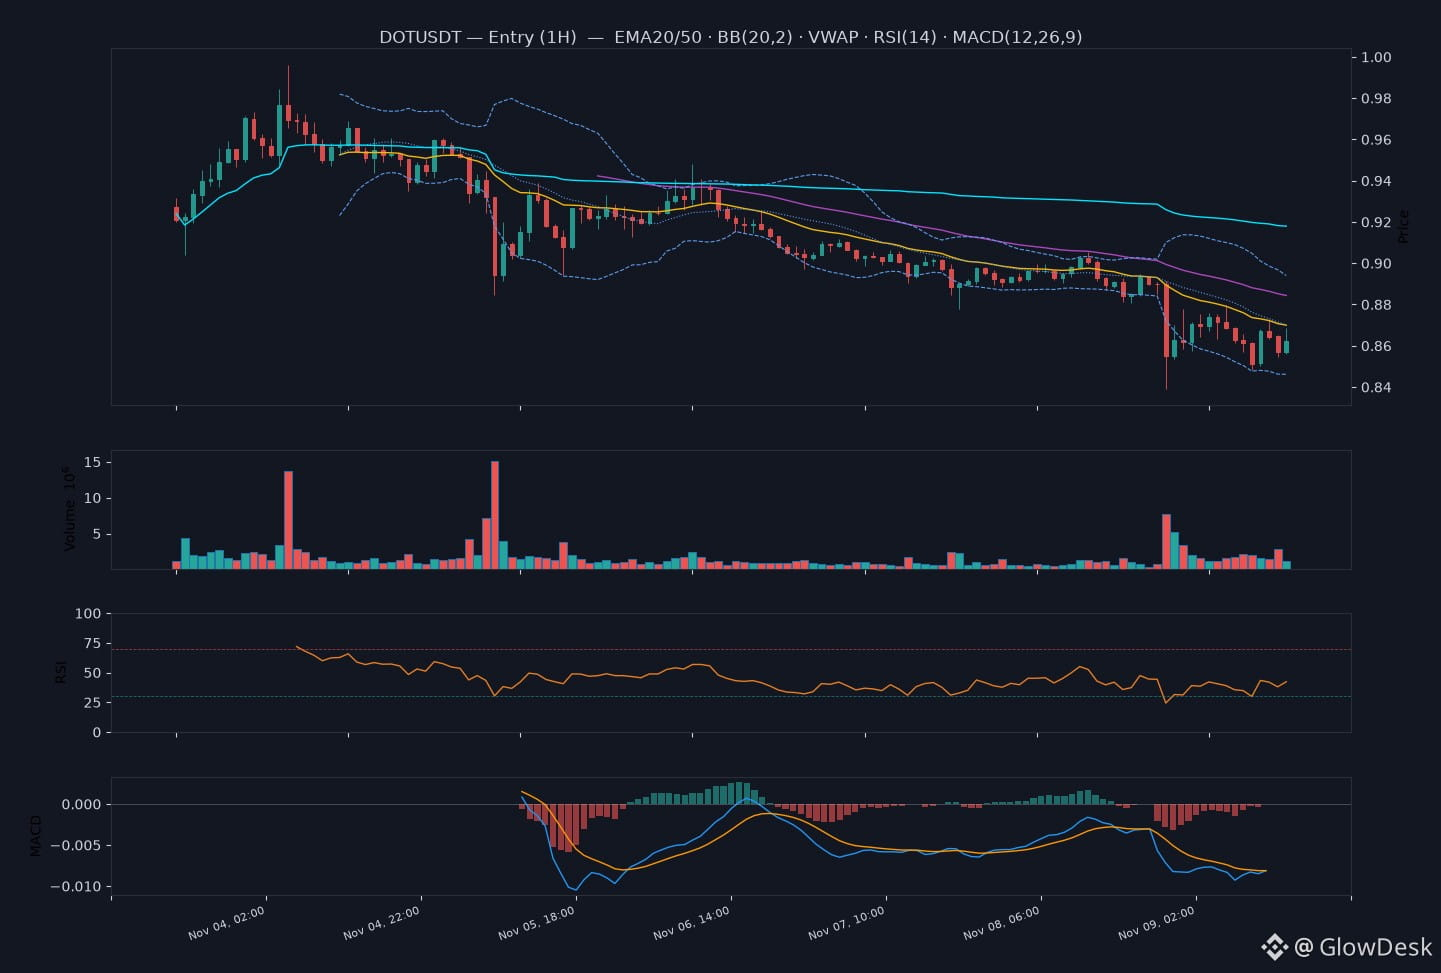
🔴 $DOT — SHORT
📍 Entry 0.862
🛑 Stop 0.881091 (-2.21%)
🎯 TP1 0.854364 (+0.89%)
⚖️ R:R 3.8 · продолжение
🧠 На всех трех таймфреймах фиксируются понижающиеся максимумы и минимумы, цена находится ниже падающих EMA20/50, а отскок на 1H неоднократно упирался в зону ниже 1h:R:1. Стоп размещен выше этой зоны примерно на 1.7 ATR входа, TP1 стоит чуть раньше 1d:S:1 около 3.2 ATR, а 1d:S:2 расположен ниже для остатка позиции. Триггер — откат от 0.8725 и медвежье закрытие свечи в 10:00, хотя текущая цена немного отскочила от этого закрытия.
📊 Графики 1D / 4H / 1H приложены.
#dot #crypto #signals
🔴 $DOT — SHORT
📍 Entry 0.862
🛑 Stop 0.881091 (-2.21%)
🎯 TP1 0.854364 (+0.89%)
⚖️ R:R 3.8 · продолжение
🧠 На всех трех таймфреймах фиксируются понижающиеся максимумы и минимумы, цена находится ниже падающих EMA20/50, а отскок на 1H неоднократно упирался в зону ниже 1h:R:1. Стоп размещен выше этой зоны примерно на 1.7 ATR входа, TP1 стоит чуть раньше 1d:S:1 около 3.2 ATR, а 1d:S:2 расположен ниже для остатка позиции. Триггер — откат от 0.8725 и медвежье закрытие свечи в 10:00, хотя текущая цена немного отскочила от этого закрытия.
📊 Графики 1D / 4H / 1H приложены.
#dot #crypto #signals
📍 Entry 0.862
🛑 Stop 0.881091 (-2.21%)
🎯 TP1 0.854364 (+0.89%)
⚖️ R:R 3.8 · продолжение
🧠 На всех трех таймфреймах фиксируются понижающиеся максимумы и минимумы, цена находится ниже падающих EMA20/50, а отскок на 1H неоднократно упирался в зону ниже 1h:R:1. Стоп размещен выше этой зоны примерно на 1.7 ATR входа, TP1 стоит чуть раньше 1d:S:1 около 3.2 ATR, а 1d:S:2 расположен ниже для остатка позиции. Триггер — откат от 0.8725 и медвежье закрытие свечи в 10:00, хотя текущая цена немного отскочила от этого закрытия.
📊 Графики 1D / 4H / 1H приложены.
#dot #crypto #signals
MAdnan919:
😁
1
134

·
--
翻訳参照
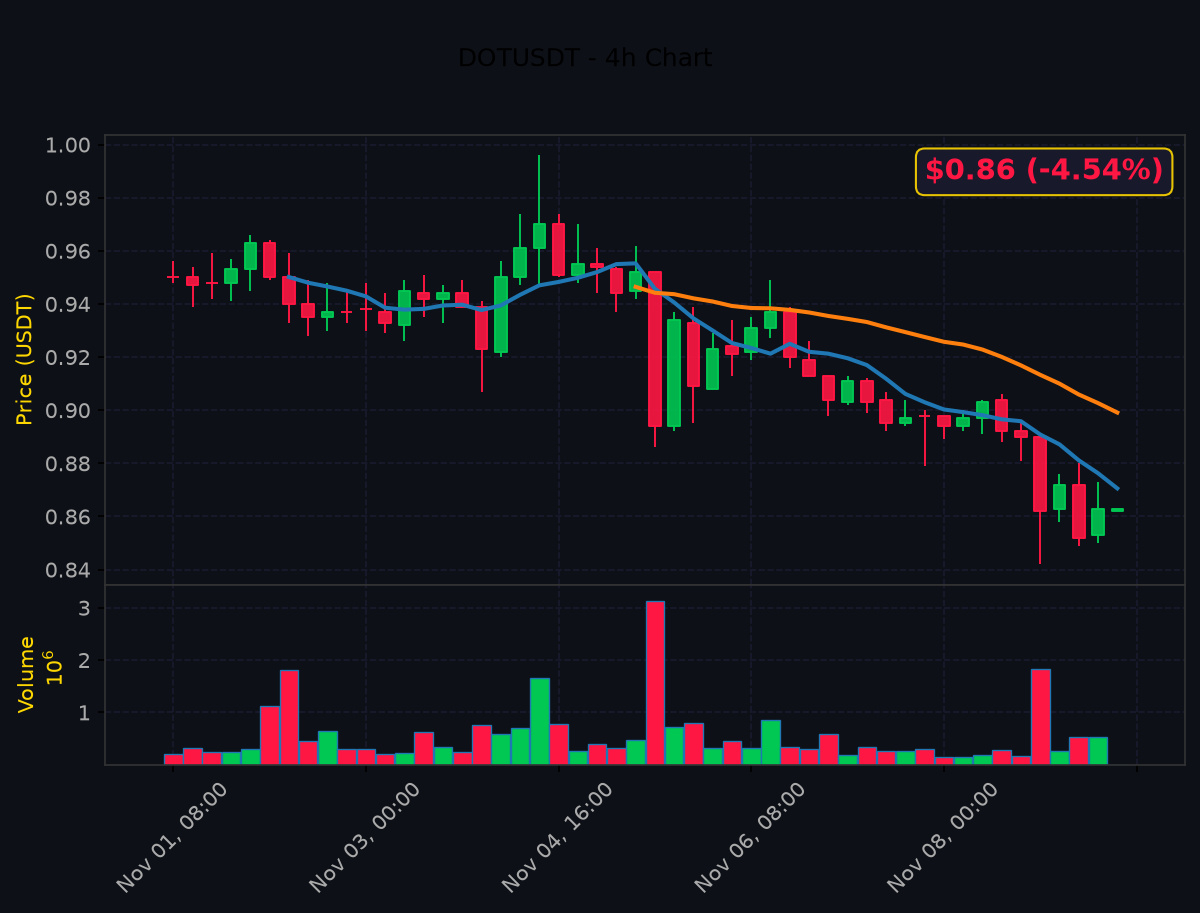
🔥 DOT getting crushed — -4.54% drop. Capitulation or buying opportunity?
📊 $DOT — Full Technical Breakdown
💹 Price Action:
• Entry: $0.86 (-4.54% 24h)
• Support: $0.84 | Resistance: $0.91
• Pivot: $0.87
📈 Momentum:
• RSI(14): 28.9 — oversold - reversal opportunity
• MACD bearish crossover, histogram negative - selling pressure
🔗 MA Structure:
• EMA20: $0.89 | EMA50: $0.91
• Bearish alignment: Price < EMA20 < EMA50. Every rally is a sell.
🎯 Actionable Setup:
• Bias: NEUTRAL
• Target 1: $0.91 | Target 2: $0.93
• Stop: $0.83
• R:R = 1:1.1
🔥 Long or short? Drop your thesis below 👇
$DOT $ATOM
#DOT #TechnicalAnalysis #CryptoTrading #PriceAction
🔥 DOT getting crushed — -4.54% drop. Capitulation or buying opportunity?
📊 $DOT — Full Technical Breakdown
💹 Price Action:
• Entry: $0.86 (-4.54% 24h)
• Support: $0.84 | Resistance: $0.91
• Pivot: $0.87
📈 Momentum:
• RSI(14): 28.9 — oversold - reversal opportunity
• MACD bearish crossover, histogram negative - selling pressure
🔗 MA Structure:
• EMA20: $0.89 | EMA50: $0.91
• Bearish alignment: Price < EMA20 < EMA50. Every rally is a sell.
🎯 Actionable Setup:
• Bias: NEUTRAL
• Target 1: $0.91 | Target 2: $0.93
• Stop: $0.83
• R:R = 1:1.1
🔥 Long or short? Drop your thesis below 👇
$DOT $ATOM
#DOT #TechnicalAnalysis #CryptoTrading #PriceAction
📊 $DOT — Full Technical Breakdown
💹 Price Action:
• Entry: $0.86 (-4.54% 24h)
• Support: $0.84 | Resistance: $0.91
• Pivot: $0.87
📈 Momentum:
• RSI(14): 28.9 — oversold - reversal opportunity
• MACD bearish crossover, histogram negative - selling pressure
🔗 MA Structure:
• EMA20: $0.89 | EMA50: $0.91
• Bearish alignment: Price < EMA20 < EMA50. Every rally is a sell.
🎯 Actionable Setup:
• Bias: NEUTRAL
• Target 1: $0.91 | Target 2: $0.93
• Stop: $0.83
• R:R = 1:1.1
🔥 Long or short? Drop your thesis below 👇
$DOT $ATOM
#DOT #TechnicalAnalysis #CryptoTrading #PriceAction
1

·
--
翻訳参照
$DOT looks ready to go up from here
Stop loss is cheap at $0.84200
Entry zone 0.85871 to 0.86782
Stop 0.84293
Targets 0.90061 then 0.92368 then 0.95829
Distance to last 1h swing low is only 2.8 percent
Sitting inside the zone as I type this
Tap $DOT to buy
Last 7 days of my calls, 27 hit target and 67 hit stop
Taking it or watching it
#DOT #TradingSignals
$DOT looks ready to go up from here
Stop loss is cheap at $0.84200
Entry zone 0.85871 to 0.86782
Stop 0.84293
Targets 0.90061 then 0.92368 then 0.95829
Distance to last 1h swing low is only 2.8 percent
Sitting inside the zone as I type this
Tap $DOT to buy
Last 7 days of my calls, 27 hit target and 67 hit stop
Taking it or watching it
#DOT #TradingSignals
Stop loss is cheap at $0.84200
Entry zone 0.85871 to 0.86782
Stop 0.84293
Targets 0.90061 then 0.92368 then 0.95829
Distance to last 1h swing low is only 2.8 percent
Sitting inside the zone as I type this
Tap $DOT to buy
Last 7 days of my calls, 27 hit target and 67 hit stop
Taking it or watching it
#DOT #TradingSignals
3

翻訳参照
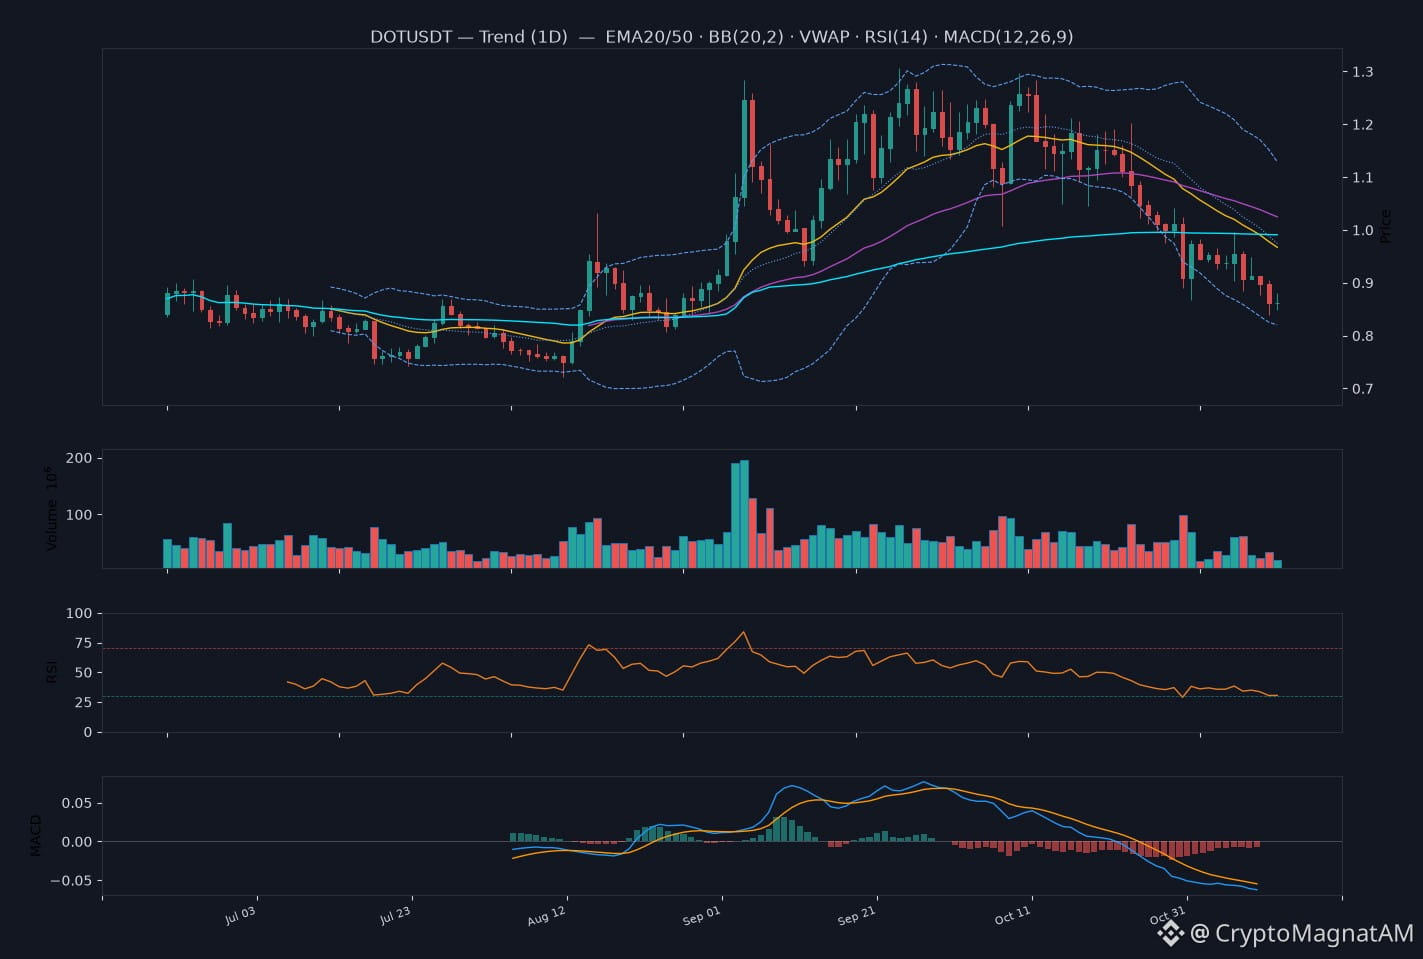
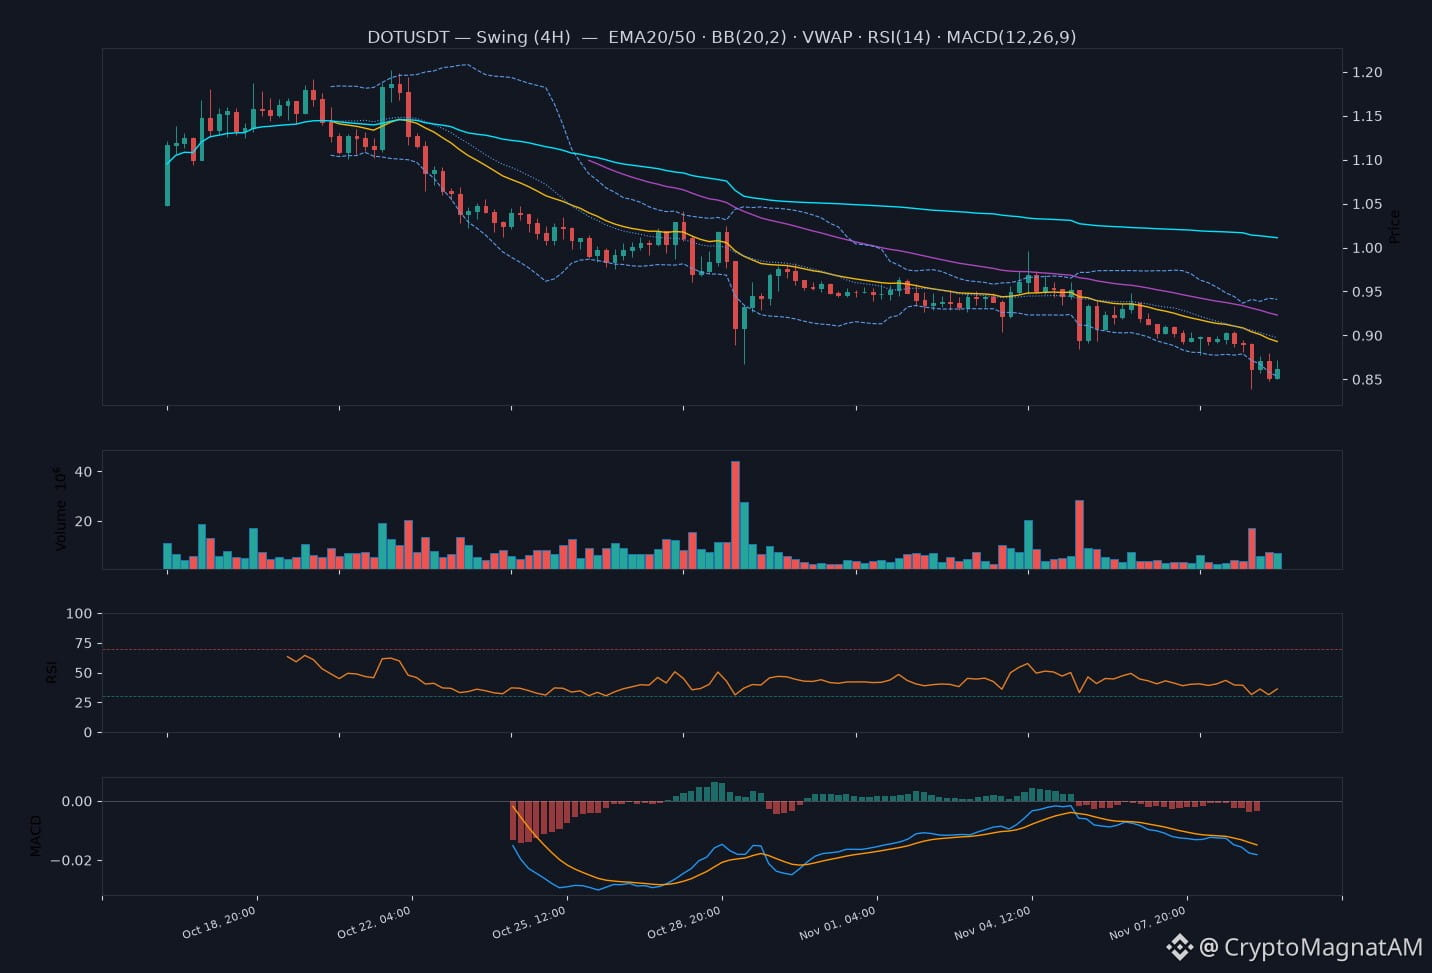
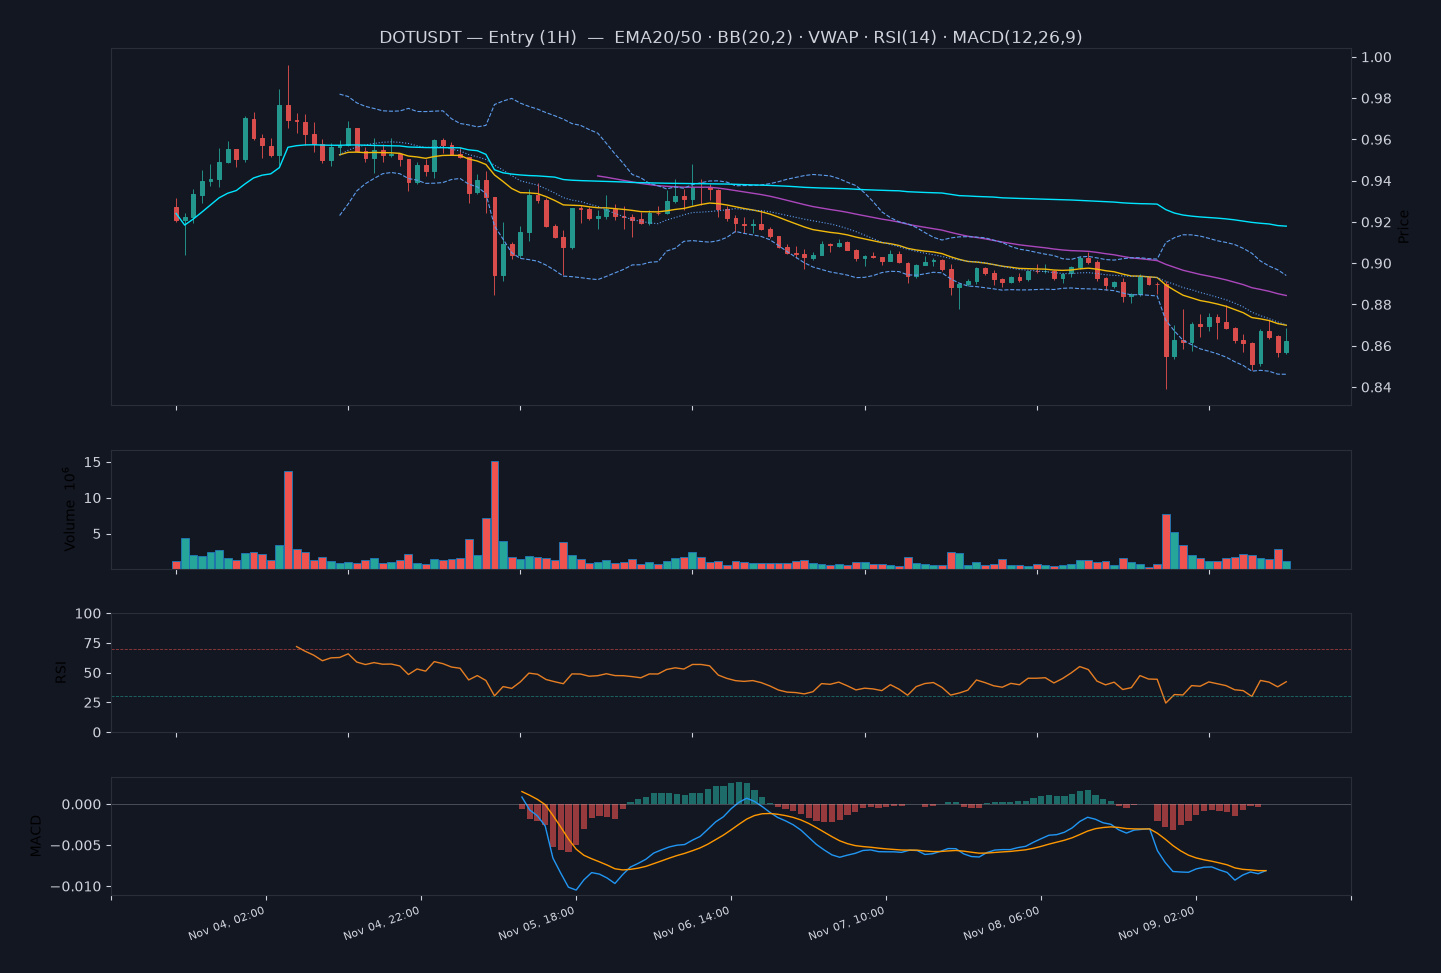
🔴 $DOT — SHORT
📍 Entry 0.862
🛑 Stop 0.881091 (-2.21%)
🎯 TP1 0.854364 (+0.89%)
⚖️ R:R 3.8 · continuation
🧠 All three timeframes print lower highs and lower lows with price below falling EMA20/50, and the 1h bounce has been capped repeatedly under 1h:R:1. The stop sits above that zone at about 1.7 entry ATR, and TP1 front-runs 1d:S:1 at about 3.2 ATR, with 1d:S:2 below for the runner. The trigger is the rejection from 0.8725 and the bearish 10:00 close, though the live price has bounced off that close.
📊 1D / 4H / 1H charts attached.
#dot #crypto #signals
🔴 $DOT — SHORT
📍 Entry 0.862
🛑 Stop 0.881091 (-2.21%)
🎯 TP1 0.854364 (+0.89%)
⚖️ R:R 3.8 · continuation
🧠 All three timeframes print lower highs and lower lows with price below falling EMA20/50, and the 1h bounce has been capped repeatedly under 1h:R:1. The stop sits above that zone at about 1.7 entry ATR, and TP1 front-runs 1d:S:1 at about 3.2 ATR, with 1d:S:2 below for the runner. The trigger is the rejection from 0.8725 and the bearish 10:00 close, though the live price has bounced off that close.
📊 1D / 4H / 1H charts attached.
#dot #crypto #signals
📍 Entry 0.862
🛑 Stop 0.881091 (-2.21%)
🎯 TP1 0.854364 (+0.89%)
⚖️ R:R 3.8 · continuation
🧠 All three timeframes print lower highs and lower lows with price below falling EMA20/50, and the 1h bounce has been capped repeatedly under 1h:R:1. The stop sits above that zone at about 1.7 entry ATR, and TP1 front-runs 1d:S:1 at about 3.2 ATR, with 1d:S:2 below for the runner. The trigger is the rejection from 0.8725 and the bearish 10:00 close, though the live price has bounced off that close.
📊 1D / 4H / 1H charts attached.
#dot #crypto #signals
MAdnan919:
😀
1
116

·
--
🦈 $DOT 個人投資家が高値で騒ぎ始めるのを待つ間、静かに蓄積が進んでいる!💥
エントリー:1.45 ⚡
目標:60.00 🚀
個人投資家のセンチメントが完全に停滞する中、賢明な資金は流動性の空白地帯で着実にポジションを構築しています。🔍 群衆がレジスタンス付近で確証を求める一方、機関投資家の足跡は歴史的な底値圏にしっかりと刻まれています。📊
高揚感に包まれた拡大局面で勢いを追いかける人と、構造を見極めて動く人を分けるのは忍耐です。💡 機関投資家の買い集めに合わせてポジションを取っていますか?それとも、直近の高値で買うのを待っていますか?👇
⚠️ 金融アドバイスではありません。常にリスクを管理してください。🛡️
🏷️ #DOT #SmartMoney #Accumulation #MarketStructure #Crypto
🔥 💎
🦈 $DOT 個人投資家が高値で騒ぎ始めるのを待つ間、静かに蓄積が進んでいる!💥
エントリー:1.45 ⚡
目標:60.00 🚀
個人投資家のセンチメントが完全に停滞する中、賢明な資金は流動性の空白地帯で着実にポジションを構築しています。🔍 群衆がレジスタンス付近で確証を求める一方、機関投資家の足跡は歴史的な底値圏にしっかりと刻まれています。📊
高揚感に包まれた拡大局面で勢いを追いかける人と、構造を見極めて動く人を分けるのは忍耐です。💡 機関投資家の買い集めに合わせてポジションを取っていますか?それとも、直近の高値で買うのを待っていますか?👇
⚠️ 金融アドバイスではありません。常にリスクを管理してください。🛡️
🏷️ #DOT #SmartMoney #Accumulation #MarketStructure #Crypto
🔥 💎
エントリー:1.45 ⚡
目標:60.00 🚀
個人投資家のセンチメントが完全に停滞する中、賢明な資金は流動性の空白地帯で着実にポジションを構築しています。🔍 群衆がレジスタンス付近で確証を求める一方、機関投資家の足跡は歴史的な底値圏にしっかりと刻まれています。📊
高揚感に包まれた拡大局面で勢いを追いかける人と、構造を見極めて動く人を分けるのは忍耐です。💡 機関投資家の買い集めに合わせてポジションを取っていますか?それとも、直近の高値で買うのを待っていますか?👇
⚠️ 金融アドバイスではありません。常にリスクを管理してください。🛡️
🏷️ #DOT #SmartMoney #Accumulation #MarketStructure #Crypto
🔥 💎

18

·
--
翻訳参照
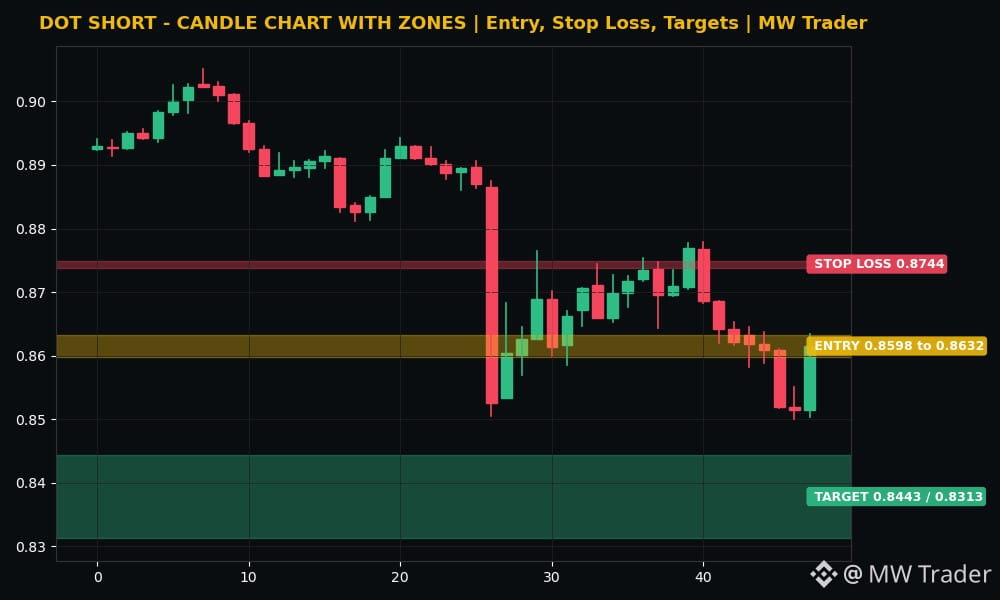
$DOT #DOT 📉
Direction: SHORT
Entry zone: 0.8598 to 0.8632
Stop loss: 0.8744
Target 1: 0.8443
Target 2: 0.8313
Polkadot is trading near 0.861481 dollars, down 2.96 percent in 24 hours, inside a range of 0.850001 to 0.905095 dollars, and the recent closes show sellers pressing every bounce, 0.861893, then 0.860892, then 0.851974, then 0.851357, then 0.861481. 🔴 My reading is that DOT is drifting lower with the whole altcoin market and has no reason to bounce while Bitcoin is stuck below 75,000 dollars, because altcoins follow Bitcoin and Bitcoin has not found its floor yet. A short from the current zone, with a stop above 0.8744, targets 0.8443 first and then 0.8313 if sellers push toward the range low. A move above 0.8744 kills the idea without debate.
Futures trading is risky. Trade small, use a stop loss, and do your own research. This is my reading, not a guaranteed signal.
Does Polkadot fall to 0.8443 first, or break above 0.8744? 🤔
Follow for more trades.
#Polkadot #Crypto #FuturesTrading #TradingSignals
$DOT #DOT 📉
Direction: SHORT
Entry zone: 0.8598 to 0.8632
Stop loss: 0.8744
Target 1: 0.8443
Target 2: 0.8313
Polkadot is trading near 0.861481 dollars, down 2.96 percent in 24 hours, inside a range of 0.850001 to 0.905095 dollars, and the recent closes show sellers pressing every bounce, 0.861893, then 0.860892, then 0.851974, then 0.851357, then 0.861481. 🔴 My reading is that DOT is drifting lower with the whole altcoin market and has no reason to bounce while Bitcoin is stuck below 75,000 dollars, because altcoins follow Bitcoin and Bitcoin has not found its floor yet. A short from the current zone, with a stop above 0.8744, targets 0.8443 first and then 0.8313 if sellers push toward the range low. A move above 0.8744 kills the idea without debate.
Futures trading is risky. Trade small, use a stop loss, and do your own research. This is my reading, not a guaranteed signal.
Does Polkadot fall to 0.8443 first, or break above 0.8744? 🤔
Follow for more trades.
#Polkadot #Crypto #FuturesTrading #TradingSignals
Direction: SHORT
Entry zone: 0.8598 to 0.8632
Stop loss: 0.8744
Target 1: 0.8443
Target 2: 0.8313
Polkadot is trading near 0.861481 dollars, down 2.96 percent in 24 hours, inside a range of 0.850001 to 0.905095 dollars, and the recent closes show sellers pressing every bounce, 0.861893, then 0.860892, then 0.851974, then 0.851357, then 0.861481. 🔴 My reading is that DOT is drifting lower with the whole altcoin market and has no reason to bounce while Bitcoin is stuck below 75,000 dollars, because altcoins follow Bitcoin and Bitcoin has not found its floor yet. A short from the current zone, with a stop above 0.8744, targets 0.8443 first and then 0.8313 if sellers push toward the range low. A move above 0.8744 kills the idea without debate.
Futures trading is risky. Trade small, use a stop loss, and do your own research. This is my reading, not a guaranteed signal.
Does Polkadot fall to 0.8443 first, or break above 0.8744? 🤔
Follow for more trades.
#Polkadot #Crypto #FuturesTrading #TradingSignals
4

·
--
弱気相場
翻訳参照
$DOT ready for a massive bounce! 📈🔥
Buyers are stepping in heavy at this support level. Catch the move before the breakout. 🚀
#DOT #CryptoTrading #BinanceSquare
{future}(DOTUSDT)
$DOT ready for a massive bounce! 📈🔥
Buyers are stepping in heavy at this support level. Catch the move before the breakout. 🚀
#DOT #CryptoTrading #BinanceSquare
Buyers are stepping in heavy at this support level. Catch the move before the breakout. 🚀
#DOT #CryptoTrading #BinanceSquare
125

·
--
翻訳参照
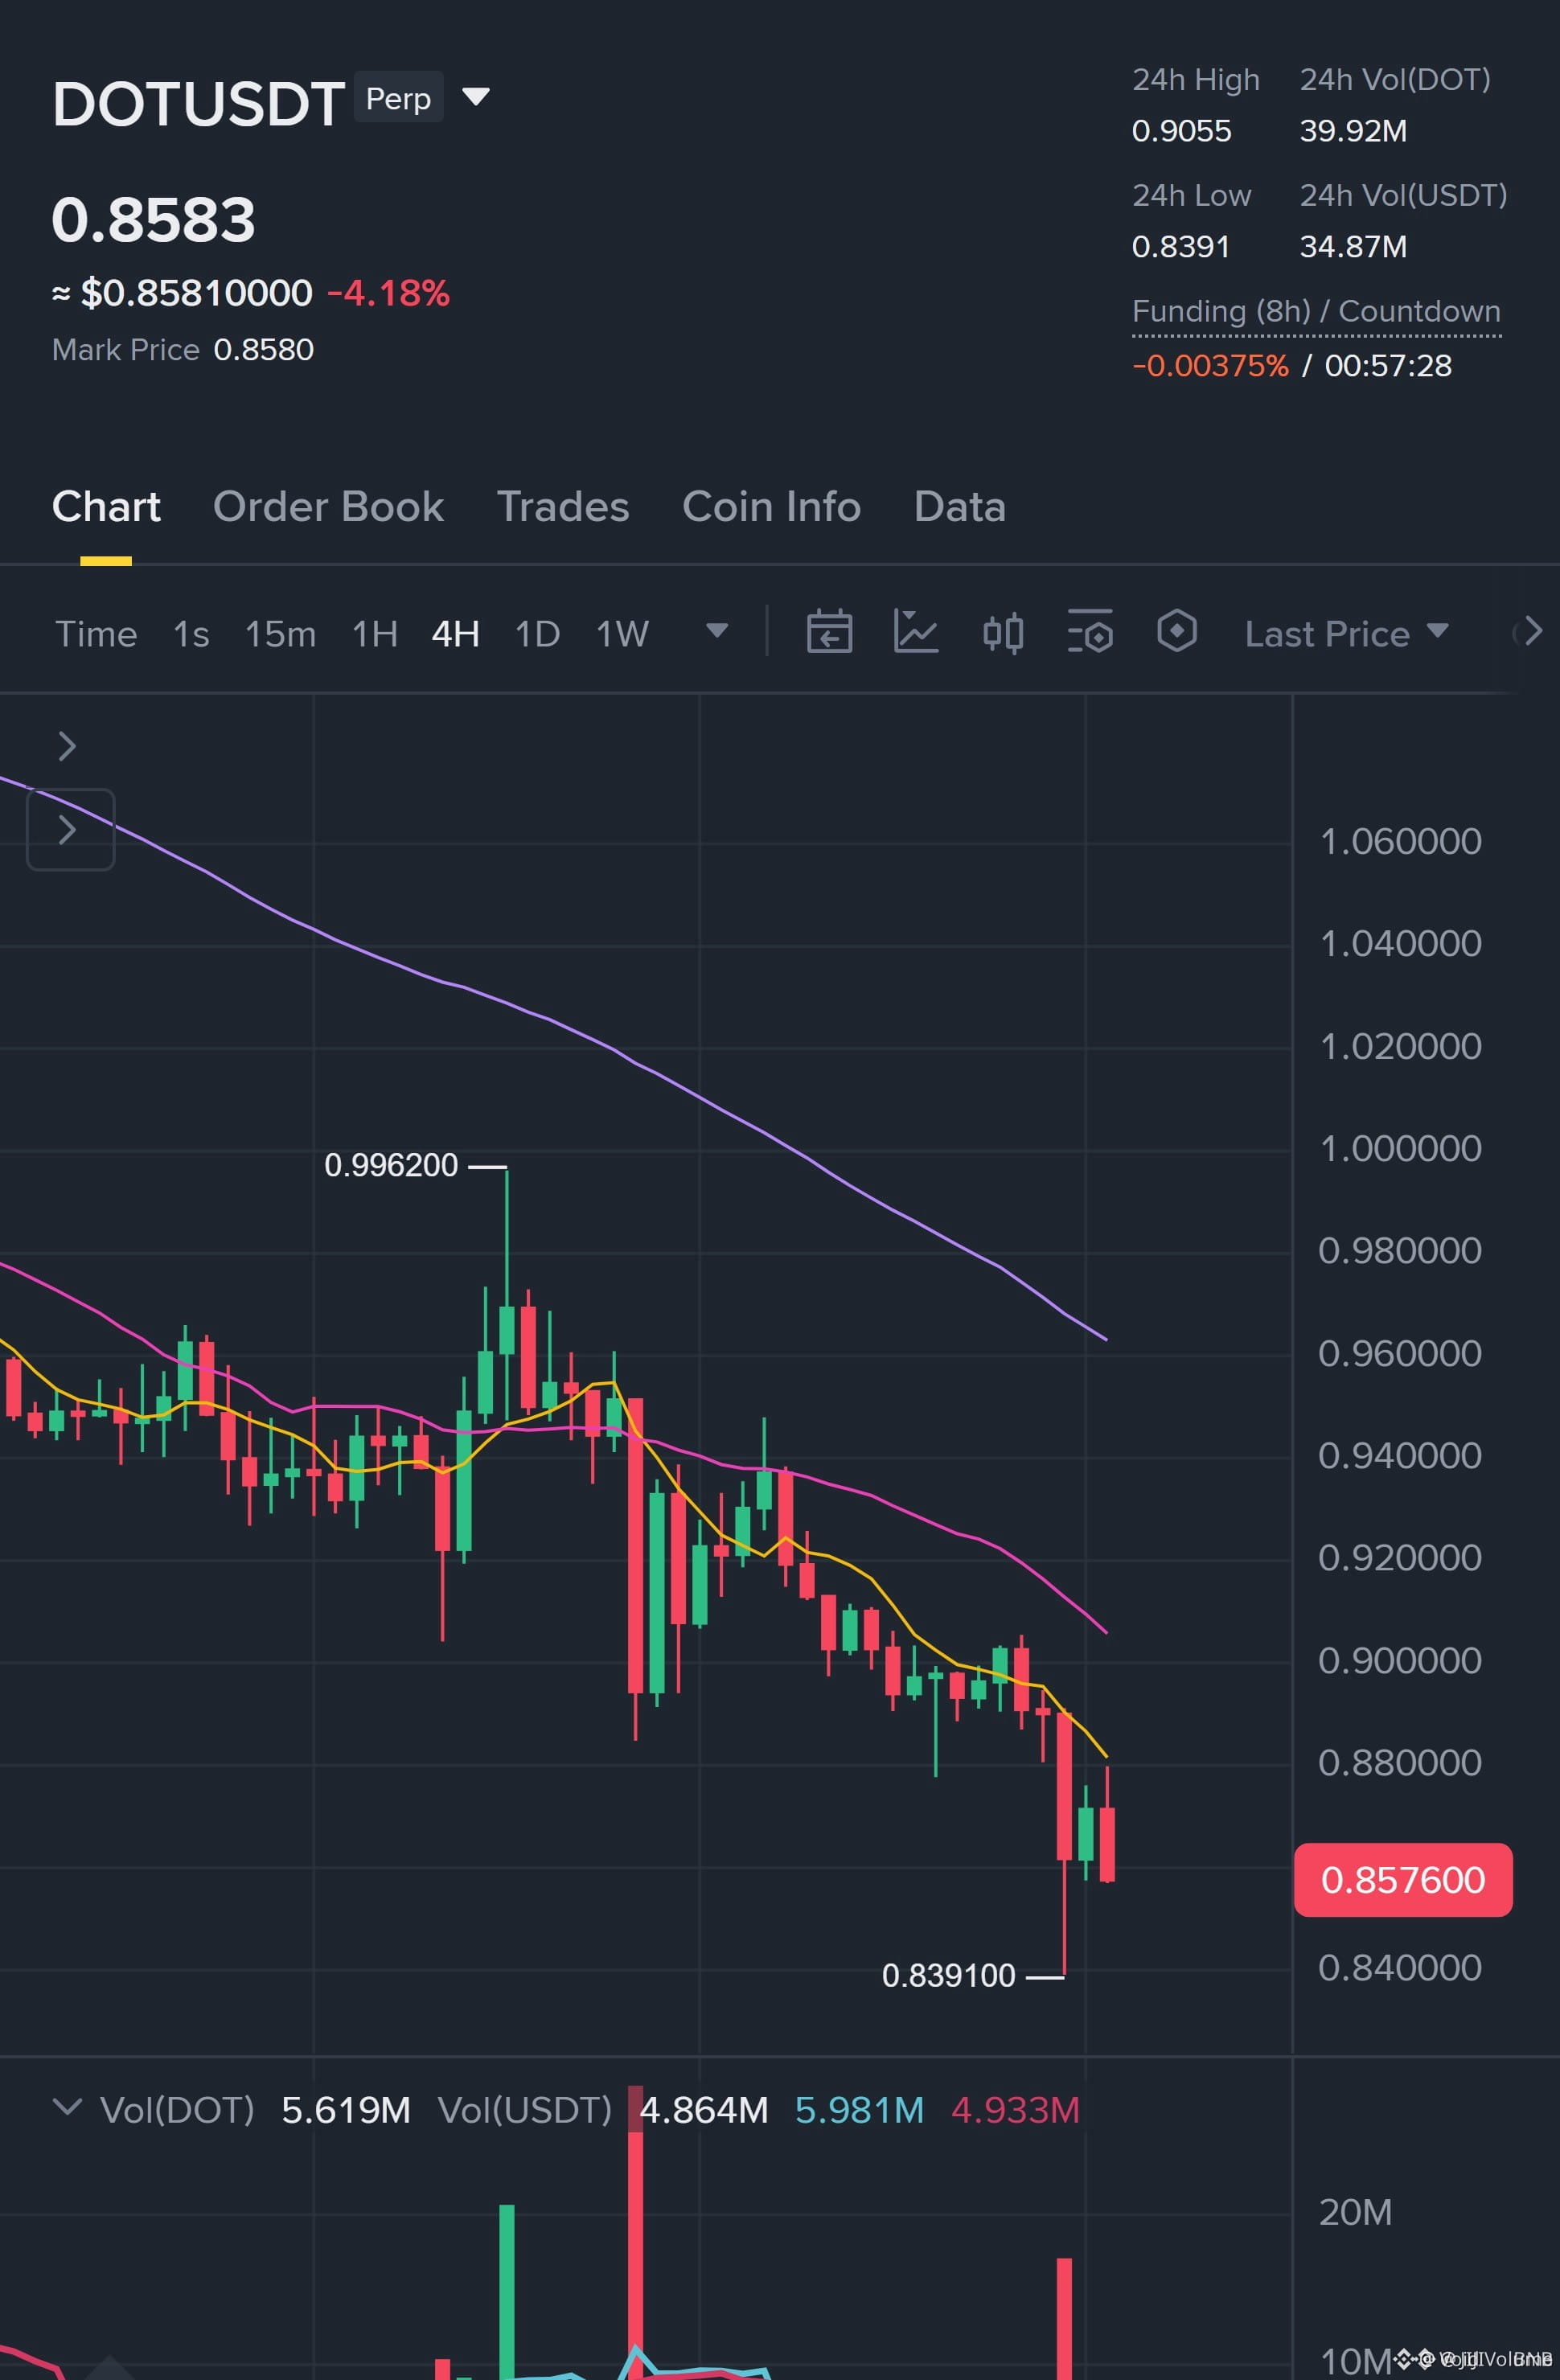
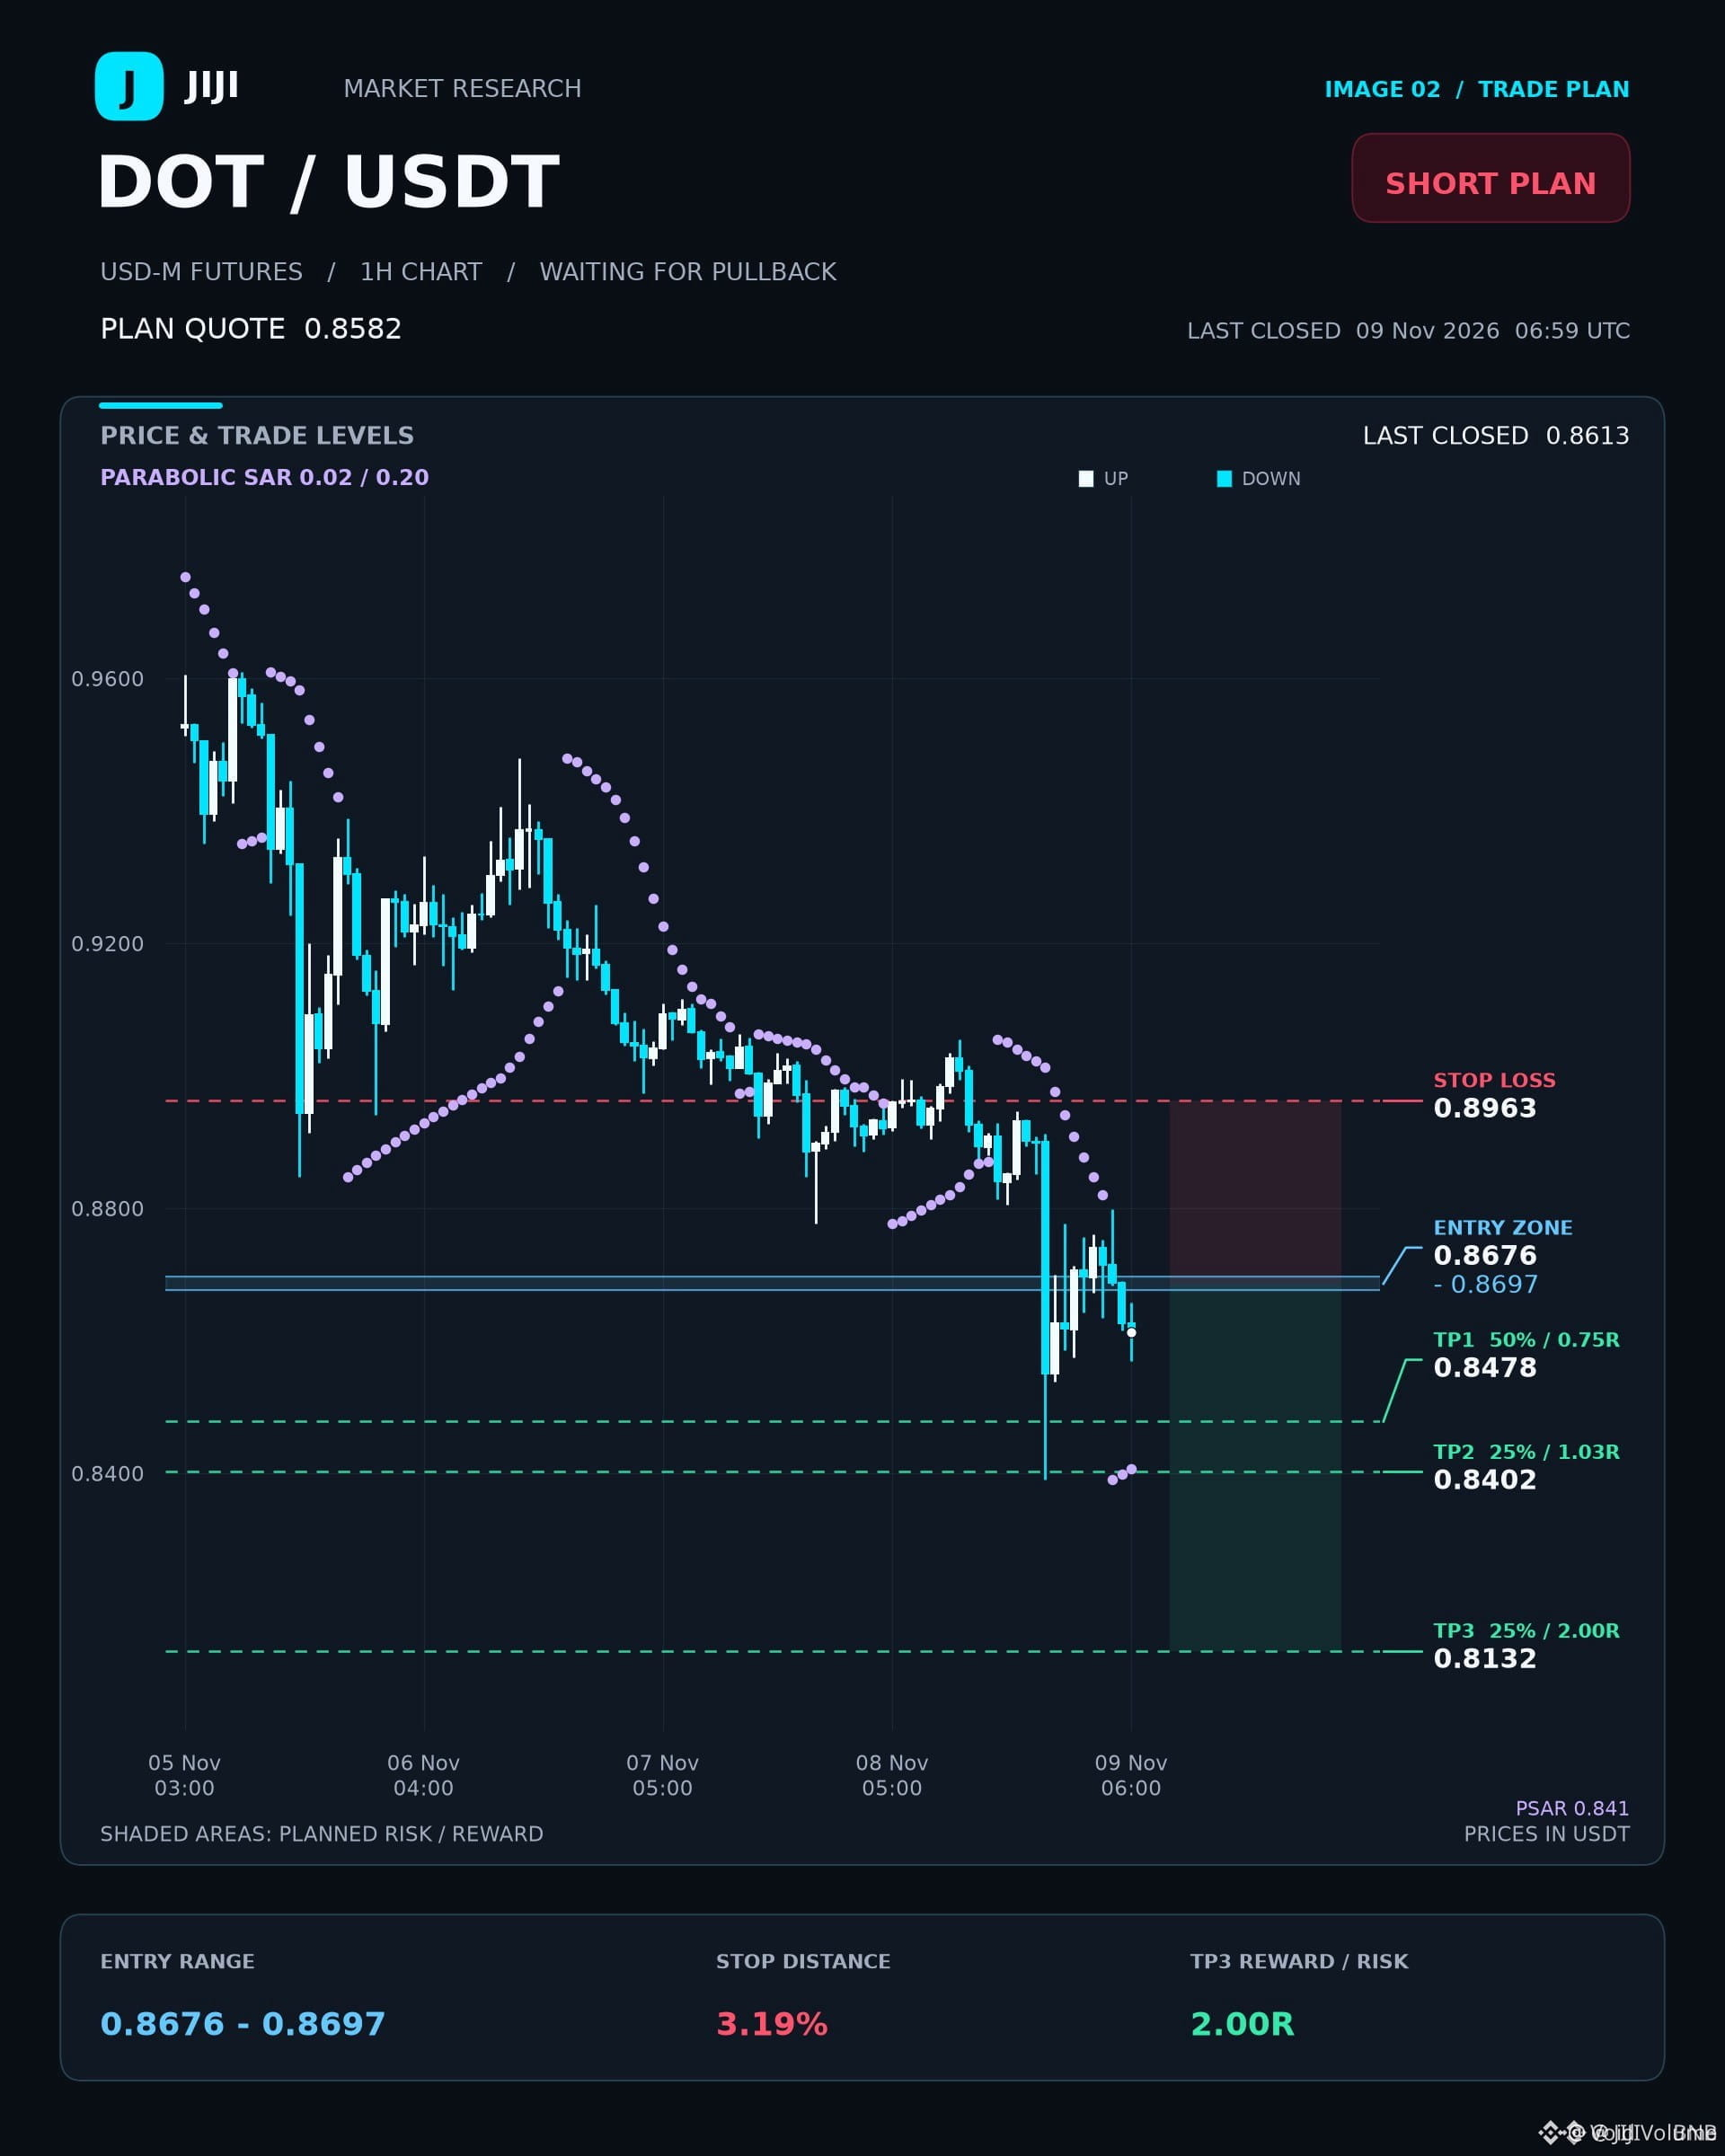
BEARISH EMA STACK ON $DOT SIGNALS A HIGH-PROBABILITY SHORT PULLBACK SETUP 📉 🐻
Entry: 0.8676 ⚡
Target: 0.8402 🚀
Stop Loss: 0.8963 ⚠️
Price action on $DOT is currently respecting a clean 4h bearish EMA stack with the 1h RSI hovering near 34.8, confirming strong downward momentum. Institutional order flow favors continuation lower as long as resistance holds firm. 📊
We are waiting for a clean pullback into the premium zone before executing shorts, keeping a close eye on the ADX reading of 27.0 for trend strength. ⚡
Are you positioning for this downside continuation or waiting for support at 0.8391 to react? 💬 👇
⚠️ Not financial advice. Always manage your risk. 🛡️
🏷️ #DOT #ShortSetup #CryptoFutures #MarketStructure
📉 🦈
BEARISH EMA STACK ON $DOT SIGNALS A HIGH-PROBABILITY SHORT PULLBACK SETUP 📉 🐻
Entry: 0.8676 ⚡
Target: 0.8402 🚀
Stop Loss: 0.8963 ⚠️
Price action on $DOT is currently respecting a clean 4h bearish EMA stack with the 1h RSI hovering near 34.8, confirming strong downward momentum. Institutional order flow favors continuation lower as long as resistance holds firm. 📊
We are waiting for a clean pullback into the premium zone before executing shorts, keeping a close eye on the ADX reading of 27.0 for trend strength. ⚡
Are you positioning for this downside continuation or waiting for support at 0.8391 to react? 💬 👇
⚠️ Not financial advice. Always manage your risk. 🛡️
🏷️ #DOT #ShortSetup #CryptoFutures #MarketStructure
📉 🦈
Entry: 0.8676 ⚡
Target: 0.8402 🚀
Stop Loss: 0.8963 ⚠️
Price action on $DOT is currently respecting a clean 4h bearish EMA stack with the 1h RSI hovering near 34.8, confirming strong downward momentum. Institutional order flow favors continuation lower as long as resistance holds firm. 📊
We are waiting for a clean pullback into the premium zone before executing shorts, keeping a close eye on the ADX reading of 27.0 for trend strength. ⚡
Are you positioning for this downside continuation or waiting for support at 0.8391 to react? 💬 👇
⚠️ Not financial advice. Always manage your risk. 🛡️
🏷️ #DOT #ShortSetup #CryptoFutures #MarketStructure
📉 🦈
6

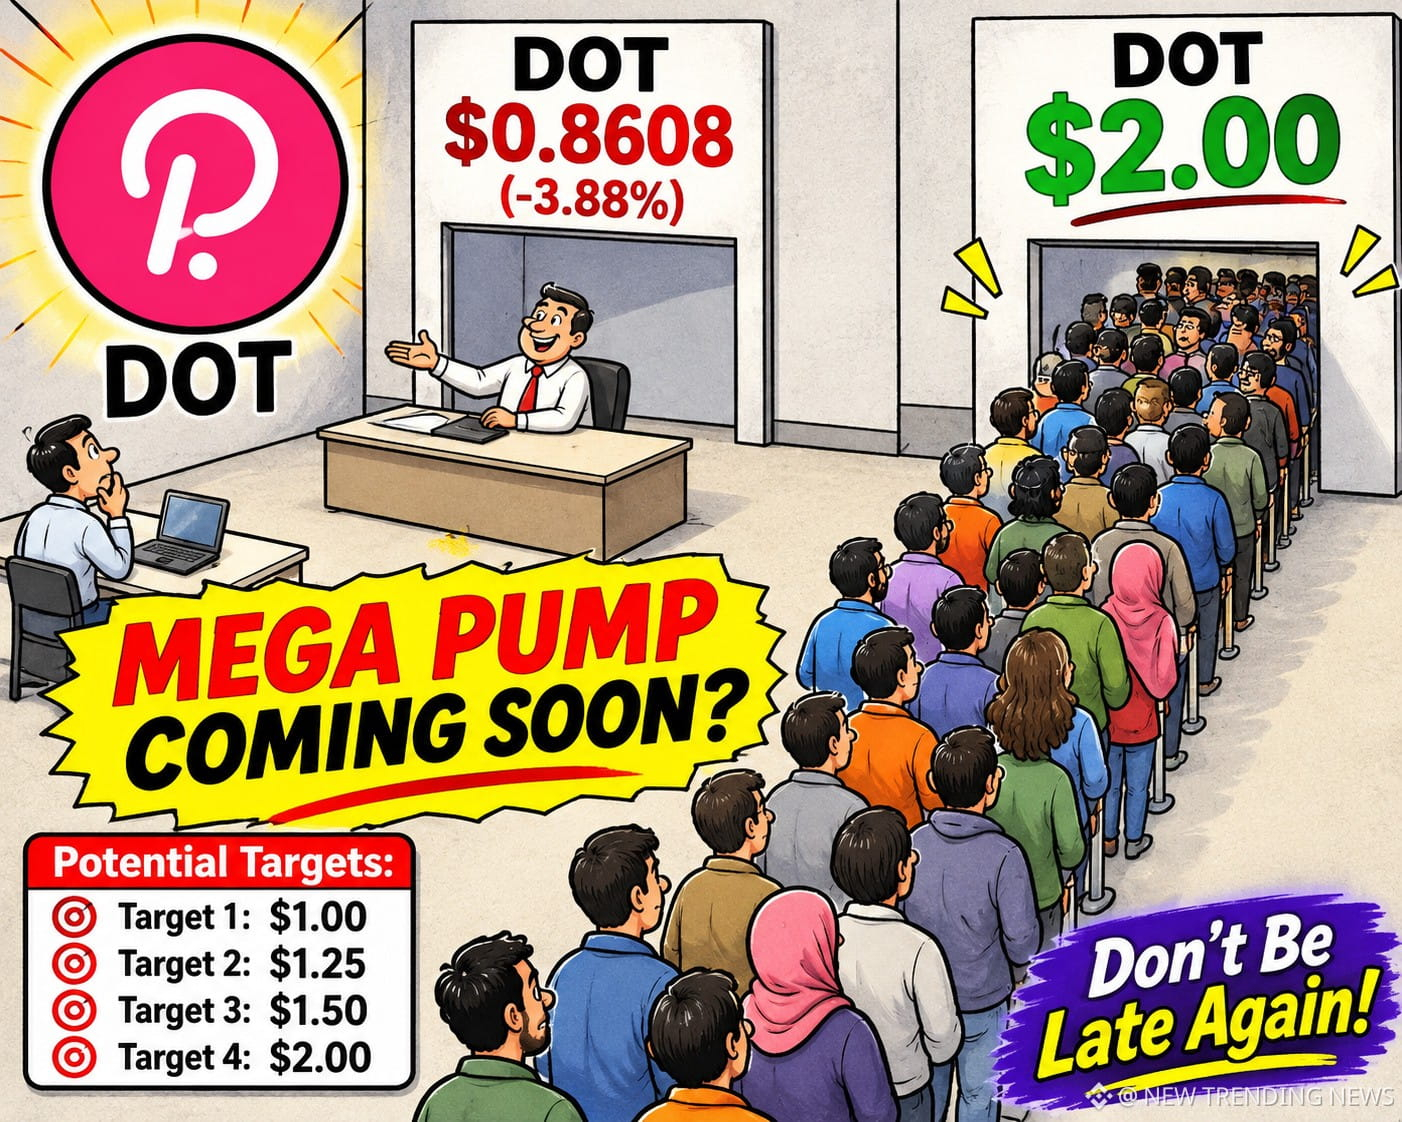

🎯 $DOT 15分 注文フローロードマップ:サポートを守る大口投資家 — 注目のトレード設定!
今、$DOT の動きを注視しています。相場は不安定ですが、注文フローを見ると、この下値水準では興味深い買い支えが見られます。反発を期待していますが、流動性狩りに巻き込まれないよう、テクニカル上の無効化ポイントを意識する必要があります。
💡 トレーダー向け具体的な提案:
• 最適なエントリーゾーン:$6.85
• 利確目標1(TP1):$6.92(+1.0% | 一部利確してSLをトレール)
• 利確目標2(TP2):$7.04(+2.8% | マクロ目線の最終目標)
• ロングの下限(強気シナリオの無効化水準):$6.72
• ショートの下限(下落時の急落目標):$6.63
• リスクリワード比:1 : 1.80
⚠️ 急激な踏み上げ・罠に関する重要警告:
このサポート水準をしっかり見ておきましょう。明確に下抜けた場合、ロングのロスカットが連鎖し、さらに下の流動性の薄い水準まで一気に向かう可能性があります。逆に、このサポートを維持できれば、遅れてショートした人たちは強く踏み上げられるでしょう。ローソク足を追いかけず、リテストか流動性狩りを待ちましょう。
ここでポジションを段階的に増やしますか?それとも流動性を取りに行く動きを待ちますか?コメントで話し合いましょう。
⚠️ 注意:これは教育目的のチャート分析であり、金融アドバイスではありません(NFA)。暗号資産取引には高いリスクが伴います。必ずご自身で調査してください(DYOR)。
#DOT #DYOR #CryptoEducation #BinanceSquare
🎯 $DOT 15分 注文フローロードマップ:サポートを守る大口投資家 — 注目のトレード設定!
今、$DOT の動きを注視しています。相場は不安定ですが、注文フローを見ると、この下値水準では興味深い買い支えが見られます。反発を期待していますが、流動性狩りに巻き込まれないよう、テクニカル上の無効化ポイントを意識する必要があります。
💡 トレーダー向け具体的な提案:
• 最適なエントリーゾーン:$6.85
• 利確目標1(TP1):$6.92(+1.0% | 一部利確してSLをトレール)
• 利確目標2(TP2):$7.04(+2.8% | マクロ目線の最終目標)
• ロングの下限(強気シナリオの無効化水準):$6.72
• ショートの下限(下落時の急落目標):$6.63
• リスクリワード比:1 : 1.80
⚠️ 急激な踏み上げ・罠に関する重要警告:
このサポート水準をしっかり見ておきましょう。明確に下抜けた場合、ロングのロスカットが連鎖し、さらに下の流動性の薄い水準まで一気に向かう可能性があります。逆に、このサポートを維持できれば、遅れてショートした人たちは強く踏み上げられるでしょう。ローソク足を追いかけず、リテストか流動性狩りを待ちましょう。
ここでポジションを段階的に増やしますか?それとも流動性を取りに行く動きを待ちますか?コメントで話し合いましょう。
⚠️ 注意:これは教育目的のチャート分析であり、金融アドバイスではありません(NFA)。暗号資産取引には高いリスクが伴います。必ずご自身で調査してください(DYOR)。
#DOT #DYOR #CryptoEducation #BinanceSquare
今、$DOT の動きを注視しています。相場は不安定ですが、注文フローを見ると、この下値水準では興味深い買い支えが見られます。反発を期待していますが、流動性狩りに巻き込まれないよう、テクニカル上の無効化ポイントを意識する必要があります。
💡 トレーダー向け具体的な提案:
• 最適なエントリーゾーン:$6.85
• 利確目標1(TP1):$6.92(+1.0% | 一部利確してSLをトレール)
• 利確目標2(TP2):$7.04(+2.8% | マクロ目線の最終目標)
• ロングの下限(強気シナリオの無効化水準):$6.72
• ショートの下限(下落時の急落目標):$6.63
• リスクリワード比:1 : 1.80
⚠️ 急激な踏み上げ・罠に関する重要警告:
このサポート水準をしっかり見ておきましょう。明確に下抜けた場合、ロングのロスカットが連鎖し、さらに下の流動性の薄い水準まで一気に向かう可能性があります。逆に、このサポートを維持できれば、遅れてショートした人たちは強く踏み上げられるでしょう。ローソク足を追いかけず、リテストか流動性狩りを待ちましょう。
ここでポジションを段階的に増やしますか?それとも流動性を取りに行く動きを待ちますか?コメントで話し合いましょう。
⚠️ 注意:これは教育目的のチャート分析であり、金融アドバイスではありません(NFA)。暗号資産取引には高いリスクが伴います。必ずご自身で調査してください(DYOR)。
#DOT #DYOR #CryptoEducation #BinanceSquare
4

·
--
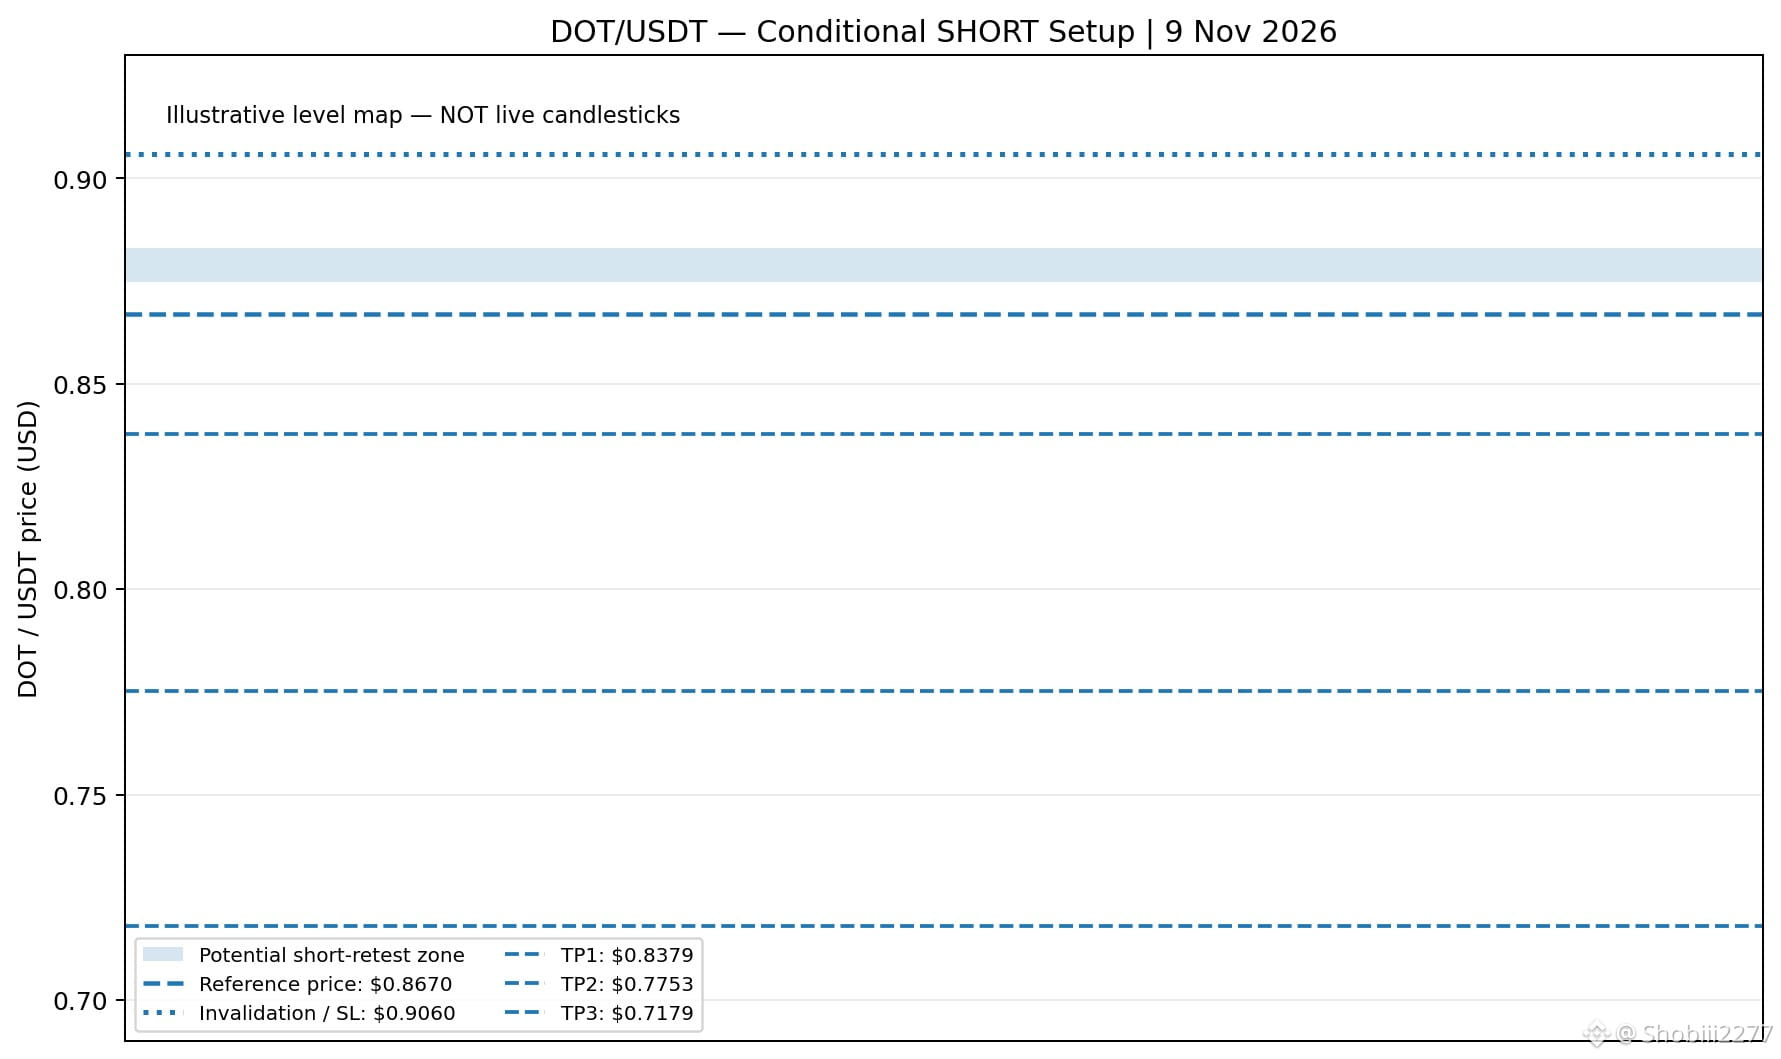
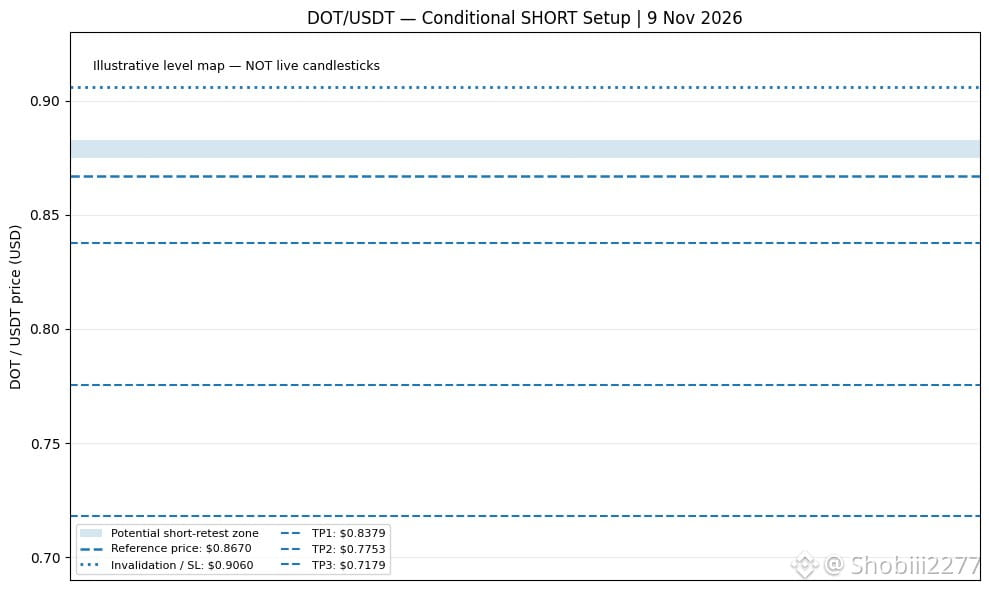
🚨 DOT/USDT — 強い確信度の弱気セットアップ 🔻
複数の時間足でトレンドは下向きです。
📉 4時間足 RSI: 33.8
📉 日足 RSI: 31.4
📉 週足 RSI: 39.6
ショートエントリー: $0.8748 – $0.8830
損切り: $0.9060
🎯 利確1: $0.8379
🎯 利確2: $0.7753
🎯 利確3: $0.7179
⚠️ エントリー前に、弱気の反落とその確認を待ちましょう。根拠のないエントリーは禁物です。
市場で報われるのは、FOMOではなく忍耐です。リスクを管理し、賢く取引しましょう。
#DOT #Polkadot #Altcoins #CryptoTrading #BinanceSquare
🚨 DOT/USDT — 強い確信度の弱気セットアップ 🔻
複数の時間足でトレンドは下向きです。
📉 4時間足 RSI: 33.8
📉 日足 RSI: 31.4
📉 週足 RSI: 39.6
ショートエントリー: $0.8748 – $0.8830
損切り: $0.9060
🎯 利確1: $0.8379
🎯 利確2: $0.7753
🎯 利確3: $0.7179
⚠️ エントリー前に、弱気の反落とその確認を待ちましょう。根拠のないエントリーは禁物です。
市場で報われるのは、FOMOではなく忍耐です。リスクを管理し、賢く取引しましょう。
#DOT #Polkadot #Altcoins #CryptoTrading #BinanceSquare
複数の時間足でトレンドは下向きです。
📉 4時間足 RSI: 33.8
📉 日足 RSI: 31.4
📉 週足 RSI: 39.6
ショートエントリー: $0.8748 – $0.8830
損切り: $0.9060
🎯 利確1: $0.8379
🎯 利確2: $0.7753
🎯 利確3: $0.7179
⚠️ エントリー前に、弱気の反落とその確認を待ちましょう。根拠のないエントリーは禁物です。
市場で報われるのは、FOMOではなく忍耐です。リスクを管理し、賢く取引しましょう。
#DOT #Polkadot #Altcoins #CryptoTrading #BinanceSquare
117

·
--
翻訳参照
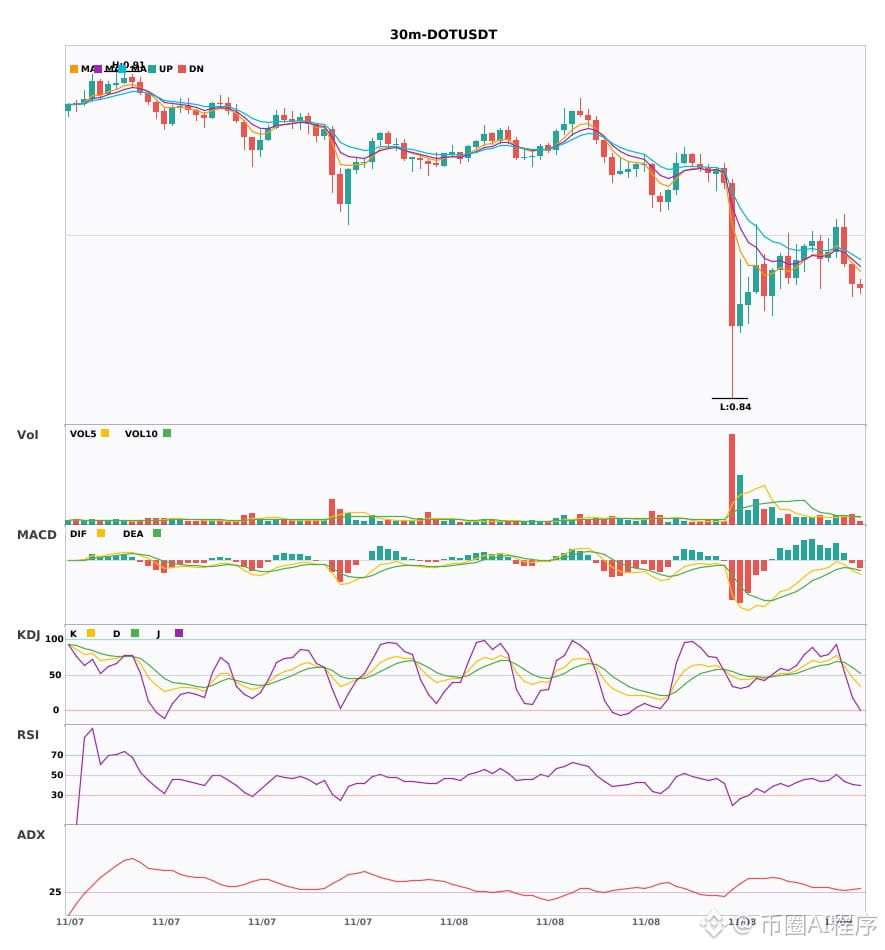
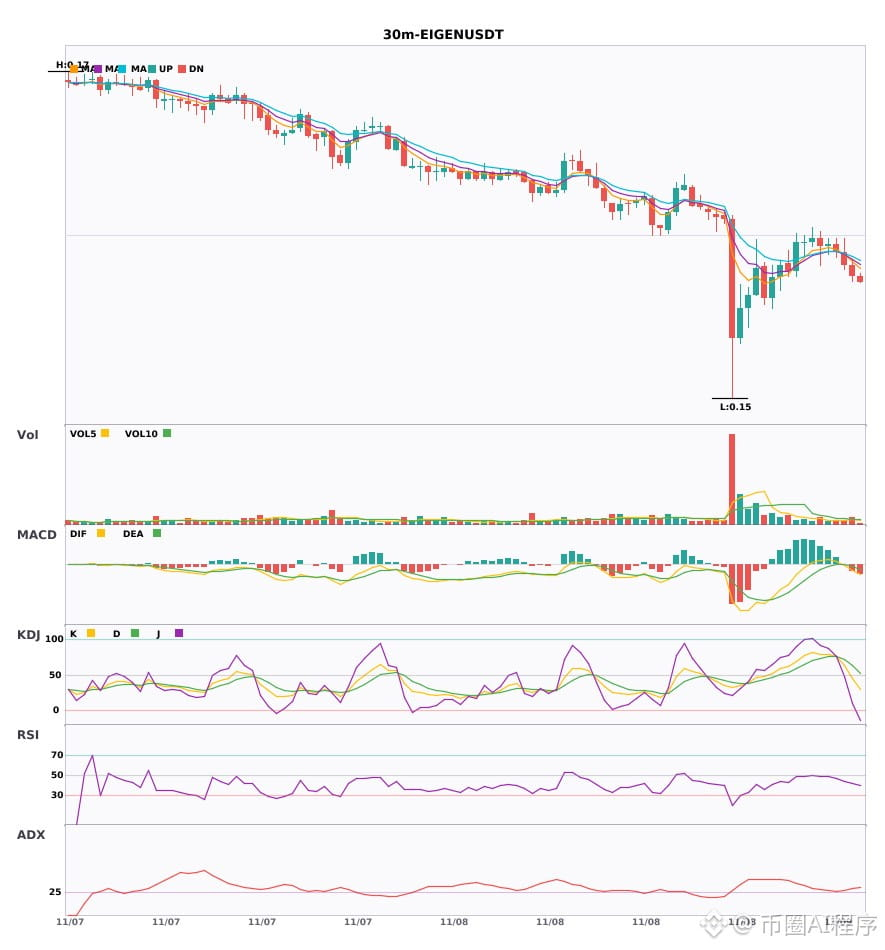
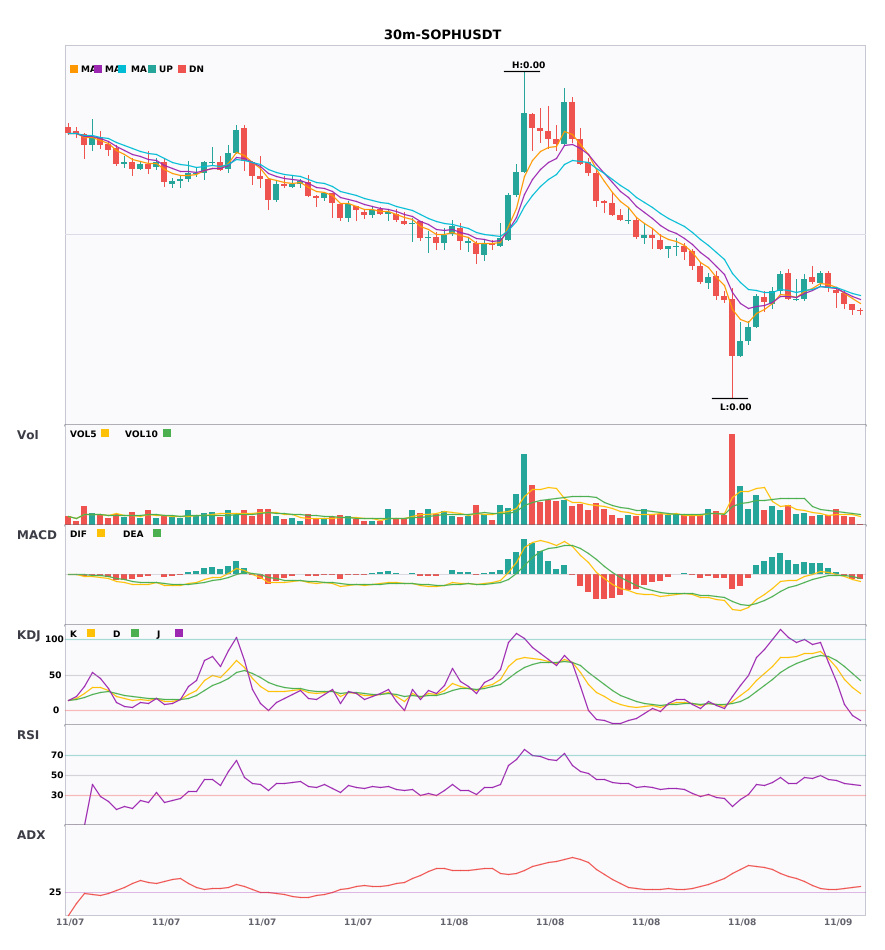
多周期共振:$DOT / $EIGEN / $SOPH 30分钟走弱,4小时空头趋势确认🔥
════════════════════
🟢 $DOT 30分钟 空头信号
⚠️技术面:4小时空头共振确认 | 30分钟入场 MACD零下死叉,空头加速 | EMA5下穿EMA8,短期转空 | 量能正常(1.3倍)
════════════════════
🟢 $EIGEN 30分钟 空头信号
⚠️技术面:4小时空头共振确认 | 30分钟入场 MACD空头运行,趋势偏弱,动能增强 | EMA5下穿EMA8,短期转空 | 量能正常(1.3倍)
════════════════════
🟢 $SOPH 30分钟 空头信号
⚠️技术面:4小时空头共振确认 | 30分钟入场 MACD零下死叉,空头加速 | EMA5下穿EMA8,短期转空 | 量能正常(1.2倍)
════════════════════
🔔 关注获取第一手行情异动 🔔
#多周期共振 #DOT #EIGEN #SOPH
📌 交易时注意k线形态是否符合
多周期共振:$DOT / $EIGEN / $SOPH 30分钟走弱,4小时空头趋势确认🔥
════════════════════
🟢 $DOT 30分钟 空头信号
⚠️技术面:4小时空头共振确认 | 30分钟入场 MACD零下死叉,空头加速 | EMA5下穿EMA8,短期转空 | 量能正常(1.3倍)
════════════════════
🟢 $EIGEN 30分钟 空头信号
⚠️技术面:4小时空头共振确认 | 30分钟入场 MACD空头运行,趋势偏弱,动能增强 | EMA5下穿EMA8,短期转空 | 量能正常(1.3倍)
════════════════════
🟢 $SOPH 30分钟 空头信号
⚠️技术面:4小时空头共振确认 | 30分钟入场 MACD零下死叉,空头加速 | EMA5下穿EMA8,短期转空 | 量能正常(1.2倍)
════════════════════
🔔 关注获取第一手行情异动 🔔
#多周期共振 #DOT #EIGEN #SOPH
📌 交易时注意k线形态是否符合
════════════════════
🟢 $DOT 30分钟 空头信号
⚠️技术面:4小时空头共振确认 | 30分钟入场 MACD零下死叉,空头加速 | EMA5下穿EMA8,短期转空 | 量能正常(1.3倍)
════════════════════
🟢 $EIGEN 30分钟 空头信号
⚠️技术面:4小时空头共振确认 | 30分钟入场 MACD空头运行,趋势偏弱,动能增强 | EMA5下穿EMA8,短期转空 | 量能正常(1.3倍)
════════════════════
🟢 $SOPH 30分钟 空头信号
⚠️技术面:4小时空头共振确认 | 30分钟入场 MACD零下死叉,空头加速 | EMA5下穿EMA8,短期转空 | 量能正常(1.2倍)
════════════════════
🔔 关注获取第一手行情异动 🔔
#多周期共振 #DOT #EIGEN #SOPH
📌 交易时注意k线形态是否符合
8

·
--
翻訳参照
“Web3”这个词,最早是谁提出来的?
Polkadot 的设计是让中继链集中提供安全,平行链专注自己的业务逻辑,不同的链之间可以传递消息。
这个圈子最贵的不是手续费,是不懂规则交的学费。
放进去的资金尽量只用亏了也不影响生活的那部分。
$DOT 0.864(-3.57%)
#DOT
“Web3”这个词,最早是谁提出来的?
Polkadot 的设计是让中继链集中提供安全,平行链专注自己的业务逻辑,不同的链之间可以传递消息。
这个圈子最贵的不是手续费,是不懂规则交的学费。
放进去的资金尽量只用亏了也不影响生活的那部分。
$DOT 0.864(-3.57%)
#DOT
Polkadot 的设计是让中继链集中提供安全,平行链专注自己的业务逻辑,不同的链之间可以传递消息。
这个圈子最贵的不是手续费,是不懂规则交的学费。
放进去的资金尽量只用亏了也不影响生活的那部分。
$DOT 0.864(-3.57%)
#DOT
243

翻訳参照
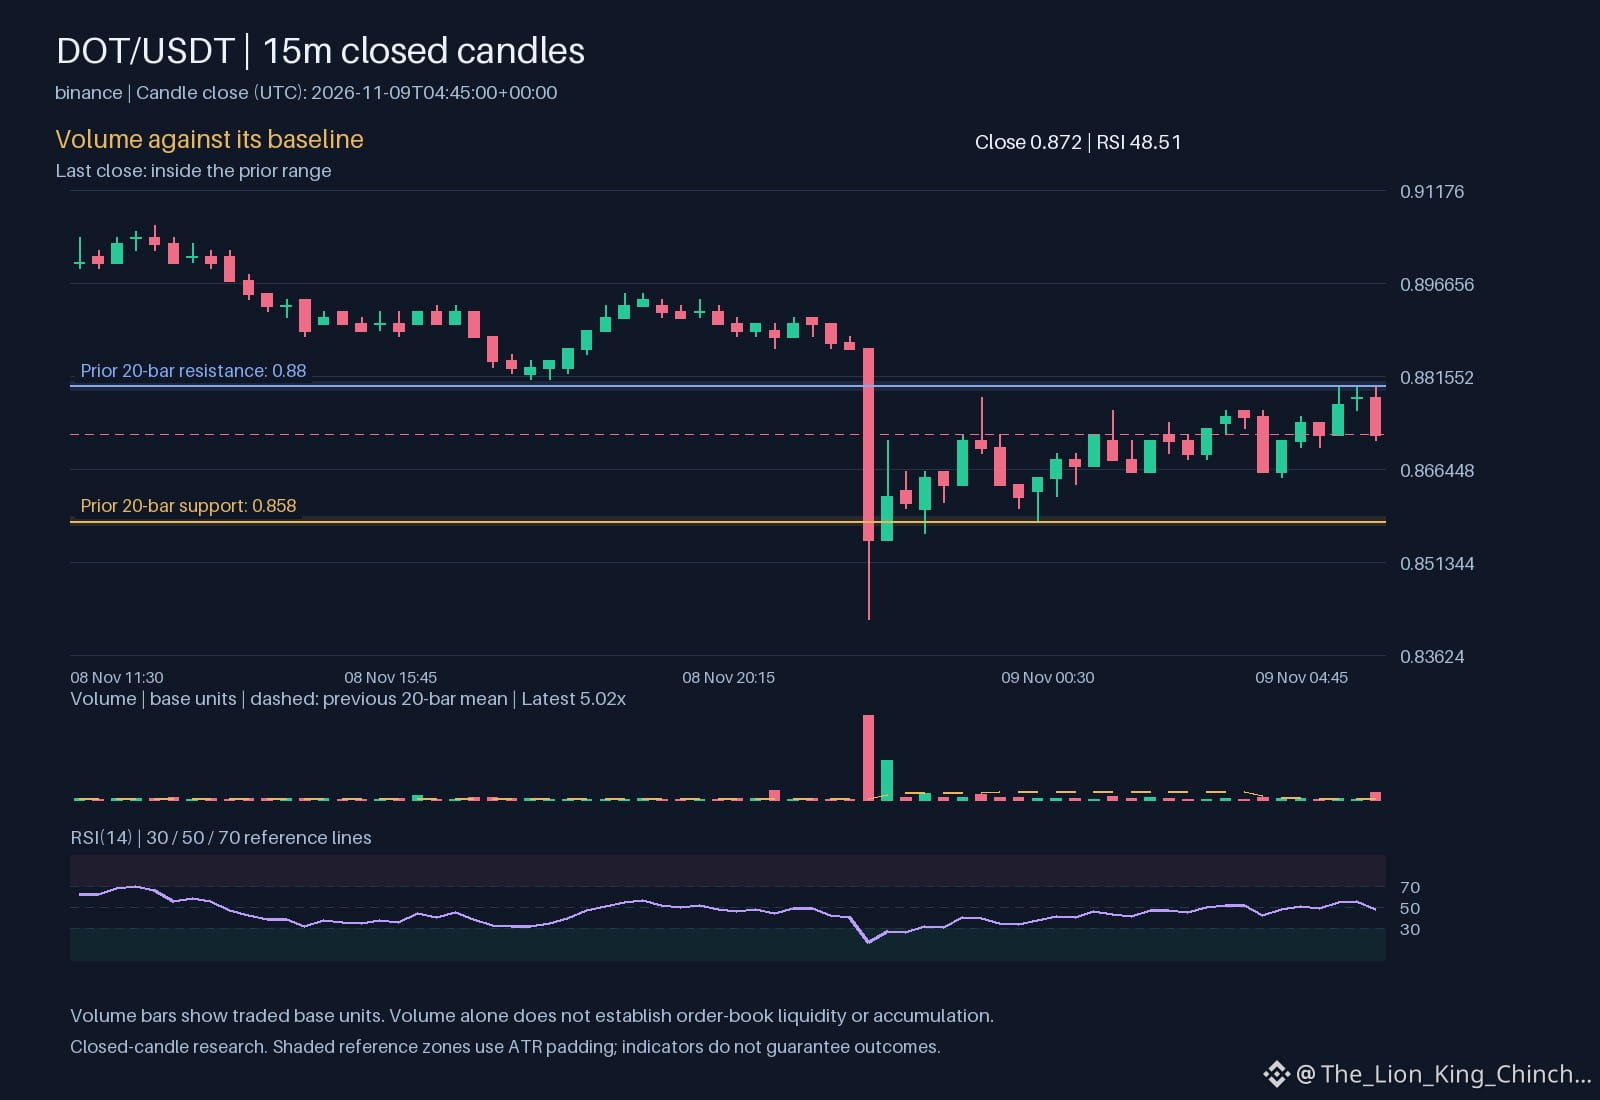
$DOT Volume Clues
Why does above baseline volume appear with a downward hourly direction? This specific combination invites a detective to ask whether sellers are forcing the price down or if a corrective phase is clearing out weak hands. The recorded relative volume is 5.0178. This metric suggests activity exceeds the usual daily baseline. However, volume alone does not confirm intent. It measures effort, not conviction.
Competing readings of the same move
One interpretation is distribution. Large holders may be selling into strength, causing the hourly drift down. The alternative is accumulation. Smart money might be buying the dip while retail panic drives the hourly direction down. The price sits at 0.872. The moving averages show 0.872659 and 0.876985. These levels act as dynamic support or resistance. If 0.872 holds above the lower average, the accumulation theory gains weight. If it breaks below, distribution looks more likely.
What would change the interpretation
A clean close above 0.88 would weaken the distribution view. It would show buyers absorbed all sell orders. Conversely, a patient retest of 0.858 without breaking it would support the accumulation idea. A break below that level would confirm the downward pressure. The RSI at 48.5136 provides context on momentum. A low value hints at oversold conditions, while a high value suggests overbought territory. The ATR at 0.0060802 measures volatility. Higher values mean wider swings, making any single candle less significant. The MACD at -0.000358085 against its signal line -0.00151683 offers a momentum check. A flip in either direction would change the short-term bias. Until a clear price action signal appears, both scenarios remain possible. The market waits for the next decisive move to reveal who is in charge.
Probabilistic market research, not a recommendation or guaranteed return.
What would convince you: a clean close or a patient retest?
#DOT
$DOT Volume Clues
Why does above baseline volume appear with a downward hourly direction? This specific combination invites a detective to ask whether sellers are forcing the price down or if a corrective phase is clearing out weak hands. The recorded relative volume is 5.0178. This metric suggests activity exceeds the usual daily baseline. However, volume alone does not confirm intent. It measures effort, not conviction.
Competing readings of the same move
One interpretation is distribution. Large holders may be selling into strength, causing the hourly drift down. The alternative is accumulation. Smart money might be buying the dip while retail panic drives the hourly direction down. The price sits at 0.872. The moving averages show 0.872659 and 0.876985. These levels act as dynamic support or resistance. If 0.872 holds above the lower average, the accumulation theory gains weight. If it breaks below, distribution looks more likely.
What would change the interpretation
A clean close above 0.88 would weaken the distribution view. It would show buyers absorbed all sell orders. Conversely, a patient retest of 0.858 without breaking it would support the accumulation idea. A break below that level would confirm the downward pressure. The RSI at 48.5136 provides context on momentum. A low value hints at oversold conditions, while a high value suggests overbought territory. The ATR at 0.0060802 measures volatility. Higher values mean wider swings, making any single candle less significant. The MACD at -0.000358085 against its signal line -0.00151683 offers a momentum check. A flip in either direction would change the short-term bias. Until a clear price action signal appears, both scenarios remain possible. The market waits for the next decisive move to reveal who is in charge.
Probabilistic market research, not a recommendation or guaranteed return.
What would convince you: a clean close or a patient retest?
#DOT
Why does above baseline volume appear with a downward hourly direction? This specific combination invites a detective to ask whether sellers are forcing the price down or if a corrective phase is clearing out weak hands. The recorded relative volume is 5.0178. This metric suggests activity exceeds the usual daily baseline. However, volume alone does not confirm intent. It measures effort, not conviction.
Competing readings of the same move
One interpretation is distribution. Large holders may be selling into strength, causing the hourly drift down. The alternative is accumulation. Smart money might be buying the dip while retail panic drives the hourly direction down. The price sits at 0.872. The moving averages show 0.872659 and 0.876985. These levels act as dynamic support or resistance. If 0.872 holds above the lower average, the accumulation theory gains weight. If it breaks below, distribution looks more likely.
What would change the interpretation
A clean close above 0.88 would weaken the distribution view. It would show buyers absorbed all sell orders. Conversely, a patient retest of 0.858 without breaking it would support the accumulation idea. A break below that level would confirm the downward pressure. The RSI at 48.5136 provides context on momentum. A low value hints at oversold conditions, while a high value suggests overbought territory. The ATR at 0.0060802 measures volatility. Higher values mean wider swings, making any single candle less significant. The MACD at -0.000358085 against its signal line -0.00151683 offers a momentum check. A flip in either direction would change the short-term bias. Until a clear price action signal appears, both scenarios remain possible. The market waits for the next decisive move to reveal who is in charge.
Probabilistic market research, not a recommendation or guaranteed return.
What would convince you: a clean close or a patient retest?
#DOT
27

·
--
暗号資産ミニ講座📚 Gavin Wood
「Web3」という言葉は、一般にGavin Woodが2014年に提唱したとされています。
Gavin WoodはParity Technologies(2015年)とWeb3 Foundation(2017年)を共同創設しました。
今日の授業に宿題はありませんが、市場から抜き打ちチェックが入ります。
$DOT は、Gavin Woodが主導して創設したPolkadotネットワークのネイティブトークンです。
#DOT
NFA、DYOR。
暗号資産ミニ講座📚 Gavin Wood
「Web3」という言葉は、一般にGavin Woodが2014年に提唱したとされています。
Gavin WoodはParity Technologies(2015年)とWeb3 Foundation(2017年)を共同創設しました。
今日の授業に宿題はありませんが、市場から抜き打ちチェックが入ります。
$DOT は、Gavin Woodが主導して創設したPolkadotネットワークのネイティブトークンです。
#DOT
NFA、DYOR。
「Web3」という言葉は、一般にGavin Woodが2014年に提唱したとされています。
Gavin WoodはParity Technologies(2015年)とWeb3 Foundation(2017年)を共同創設しました。
今日の授業に宿題はありませんが、市場から抜き打ちチェックが入ります。
$DOT は、Gavin Woodが主導して創設したPolkadotネットワークのネイティブトークンです。
#DOT
NFA、DYOR。
31

·
--
翻訳参照
“Web3”这个词,最早是谁提出来的?
我的理解:Polkadot 的思路是让中继链集中提供安全,平行链各自专注自己的业务逻辑,不同的链之间可以传递消息。
Gavin Wood 提出了合约编程语言 Solidity,还参与了这门语言的早期开发。
我的做法:看一条公链,不要只看创始人的名气,还要看生态实际的使用情况。
$DOT 就是 Polkadot 的原生代币,能用于质押和治理投票。
#DOT
市场变化很快,别急着下结论。
“Web3”这个词,最早是谁提出来的?
我的理解:Polkadot 的思路是让中继链集中提供安全,平行链各自专注自己的业务逻辑,不同的链之间可以传递消息。
Gavin Wood 提出了合约编程语言 Solidity,还参与了这门语言的早期开发。
我的做法:看一条公链,不要只看创始人的名气,还要看生态实际的使用情况。
$DOT 就是 Polkadot 的原生代币,能用于质押和治理投票。
#DOT
市场变化很快,别急着下结论。
我的理解:Polkadot 的思路是让中继链集中提供安全,平行链各自专注自己的业务逻辑,不同的链之间可以传递消息。
Gavin Wood 提出了合约编程语言 Solidity,还参与了这门语言的早期开发。
我的做法:看一条公链,不要只看创始人的名气,还要看生态实际的使用情况。
$DOT 就是 Polkadot 的原生代币,能用于质押和治理投票。
#DOT
市场变化很快,别急着下结论。
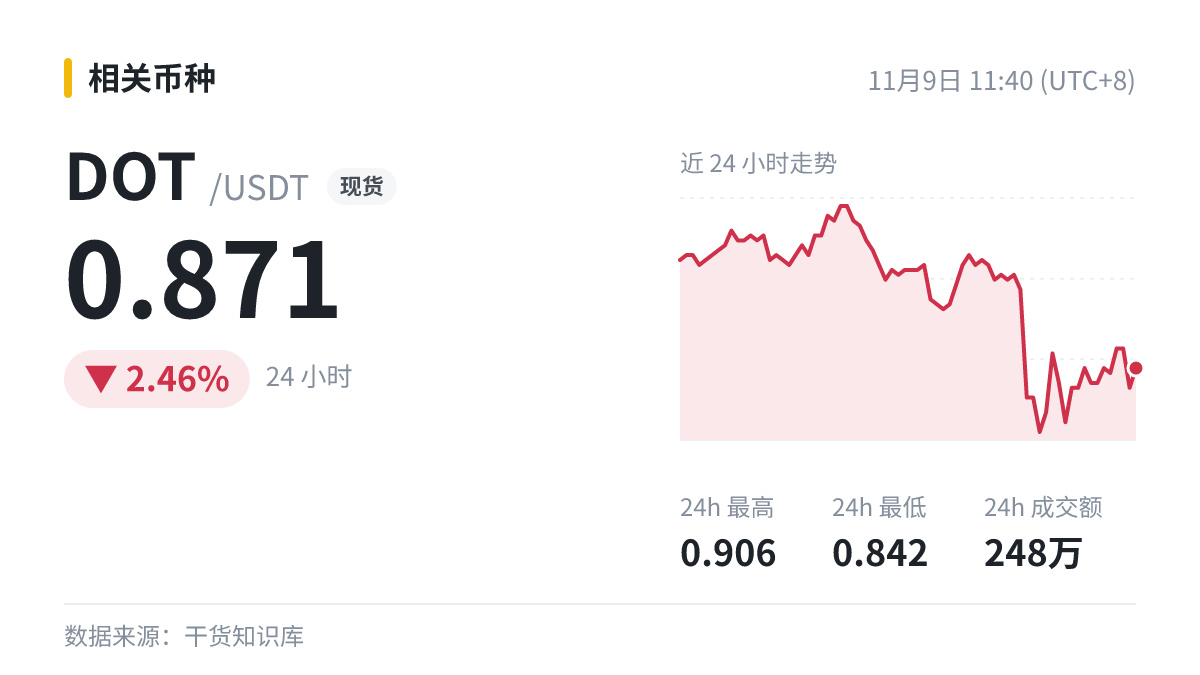
31

·
--
翻訳参照
说说 Gavin Wood。
“Web3”这个说法一般被认为是 Gavin Wood 在 2014 年提出的。
老实说,这一点我也是后来才懂:研究一条公链,别只看创始人的名气,更要看生态实际的使用情况。
$DOT 是 Gavin Wood 牵头创立的 Polkadot 网络的原生代币。
投入量力而行,给自己留好退路。
#DOT
说说 Gavin Wood。
“Web3”这个说法一般被认为是 Gavin Wood 在 2014 年提出的。
老实说,这一点我也是后来才懂:研究一条公链,别只看创始人的名气,更要看生态实际的使用情况。
$DOT 是 Gavin Wood 牵头创立的 Polkadot 网络的原生代币。
投入量力而行,给自己留好退路。
#DOT
“Web3”这个说法一般被认为是 Gavin Wood 在 2014 年提出的。
老实说,这一点我也是后来才懂:研究一条公链,别只看创始人的名气,更要看生态实际的使用情况。
$DOT 是 Gavin Wood 牵头创立的 Polkadot 网络的原生代币。
投入量力而行,给自己留好退路。
#DOT
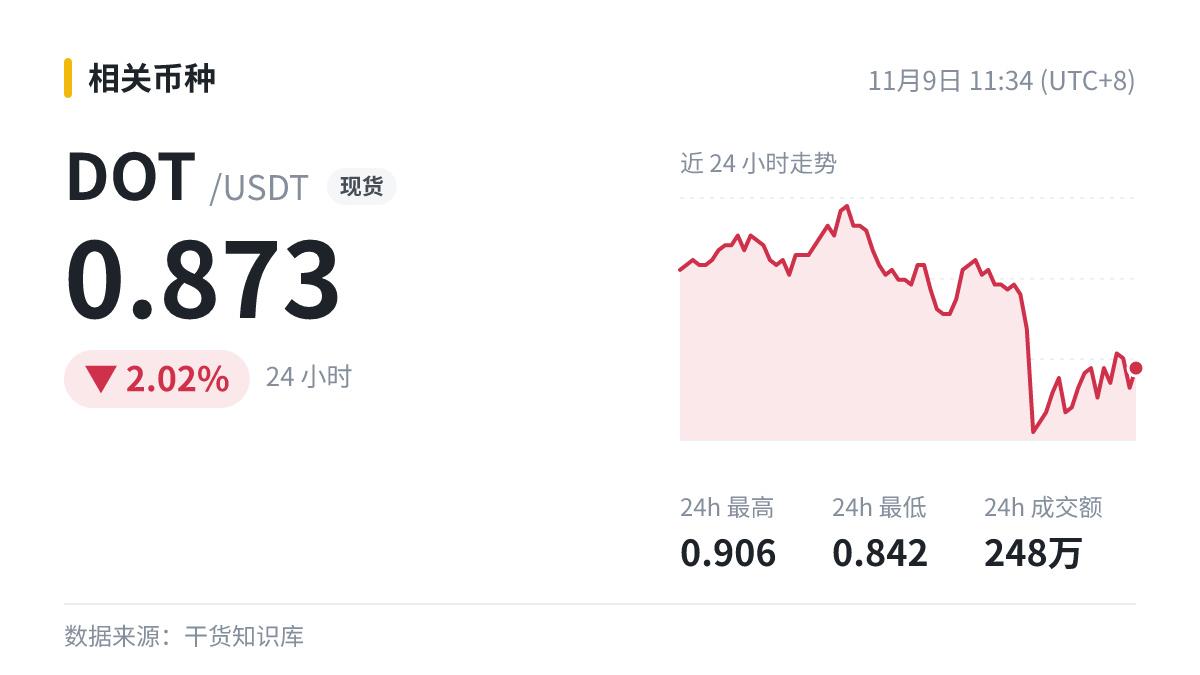
30
ログインして、さらにコンテンツを読む
厳選トピックで世界の暗号資産トレーダーの仲間入り
⚡️ 暗号資産に関する最新かつ有益な情報が見つかります。
💬 世界最大の暗号資産取引所から信頼されています。
👍 認証を受けたクリエイターから、有益なインサイトを得られます。
メール / 電話番号
トレンドトピック
1
#NvidiaInvestigatesAfterHuang’sAffairApology
閲覧回数 79,583
864人が討論中
2
#BitcoinFiveWeeklyLosses
閲覧回数 99,084
1,315人が討論中
3
#AIChipSlumpNasdaq
閲覧回数 50,215
803人が討論中
4
#CPITestsDecemberRateOutlook
閲覧回数 530,248
2,236人が討論中
5
#AnthropicRejectsIPODelayValuationinQuestion
閲覧回数 5,961
120人が討論中
6
#CryptoLiquidationsReach$1.16BIn24Hours
閲覧回数 0
0人が討論中
7
#EUInstitutionsInviteIndustryToSetTokenizedSecuritiesStandards
閲覧回数 0
0人が討論中
8
#ChinaCACListsFiveIssuesAffectingBlockchainFilings
閲覧回数 291
10人が討論中
9
#UKBanksCanNowApplyToConductCryptoAssetBusiness
閲覧回数 384
7人が討論中
10
#AmundiAdds$72.3MInStrategyShares
閲覧回数 264
7人が討論中