
#200weekma
200weekma
閲覧回数 171
8人が討論中
注目
最新

·
--
記事
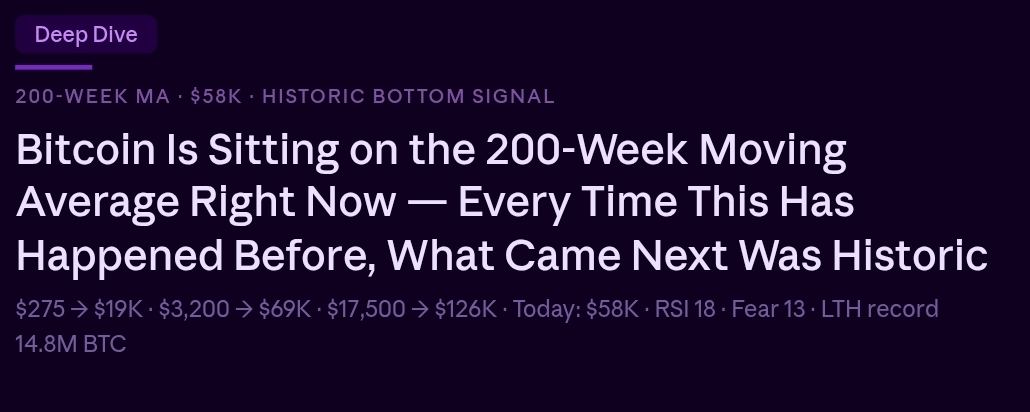
ビットコインは今、200週移動平均の上にあります——これが起きるたびに、毎回すべて今の暗号資産界で「最も重要なチャート」を1つだけ挙げるなら、それは何かを保証するからではなく、ビットコイン15年の歴史におけるどのテクニカル指標よりも一貫した実績を持っているからです。
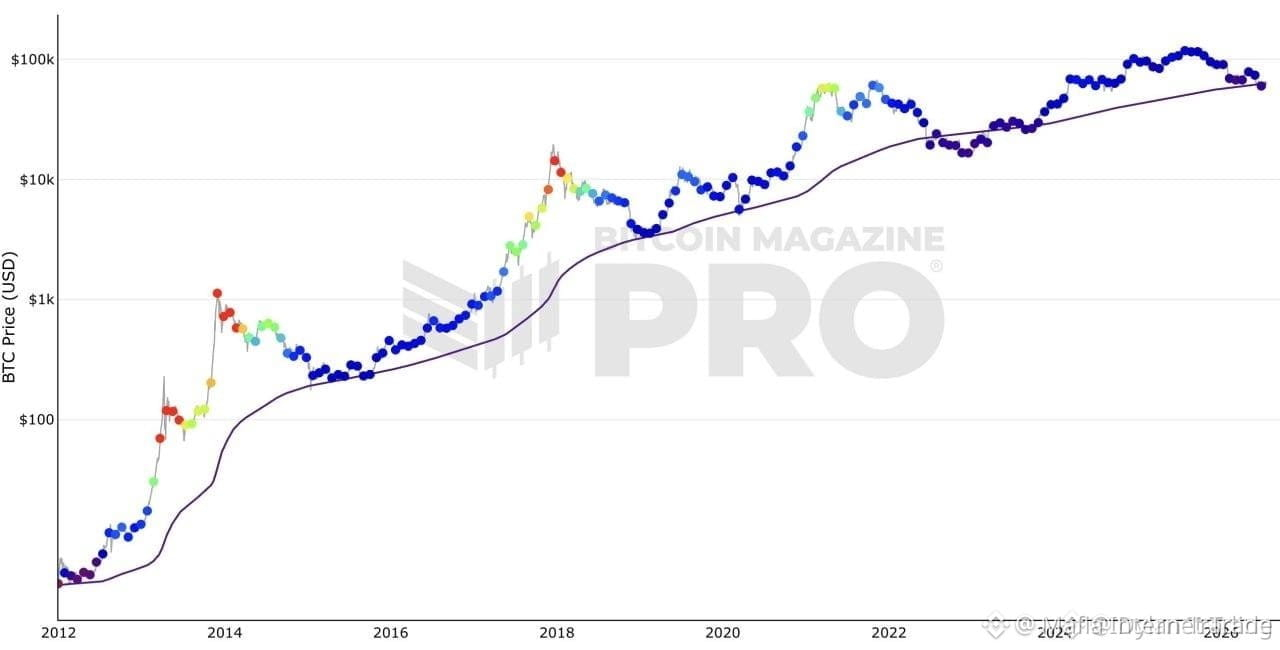
200週移動平均——直近200週間におけるビットコインの終値の単純平均で、およそ4年分に相当します。2015年以降、主要なビットコインのベアマーケットのたびに、マクロ的な底を示してきました。
2015年にビットコインは200週MAを$275でタッチし、その後2017年に$19,000まで反発しました。
ビットコインは今、200週移動平均の上にあります——これが起きるたびに、毎回すべて
今の暗号資産界で「最も重要なチャート」を1つだけ挙げるなら、それは何かを保証するからではなく、ビットコイン15年の歴史におけるどのテクニカル指標よりも一貫した実績を持っているからです。
200週移動平均——直近200週間におけるビットコインの終値の単純平均で、およそ4年分に相当します。2015年以降、主要なビットコインのベアマーケットのたびに、マクロ的な底を示してきました。
2015年にビットコインは200週MAを$275でタッチし、その後2017年に$19,000まで反発しました。
200週移動平均——直近200週間におけるビットコインの終値の単純平均で、およそ4年分に相当します。2015年以降、主要なビットコインのベアマーケットのたびに、マクロ的な底を示してきました。
2015年にビットコインは200週MAを$275でタッチし、その後2017年に$19,000まで反発しました。
47

$BTC SURGES PAST THE 200-WEEK MA — A CLASSIC BULL SIGNAL 🔥
入力内に特定の価格水準は提供されていません — 取引シグナル欄は省略されています。
ビットコインは200週移動平均を63kドルで再び回復しました。これはただのノイズではありません。この水準は長期のトレンドフィルターとして何年も機能してきていて、BTCがそれを上回って維持したときは、次の局面が必ずついてきました。これは“見せかけ”ではなく、本物の勢いを伴うブレイクです。
問題は、これが継続的な上昇の始まりなのか、それとも重要な水準を上抜ける一瞬のヒゲ(フェイク)にすぎないのか。ここであなたの一手は?
※金融アドバイスではありません。必ずリスクを管理してください。
#BTC #Bullish #200WeekMA #Crypto
🔥
$BTC SURGES PAST THE 200-WEEK MA — A CLASSIC BULL SIGNAL 🔥
入力内に特定の価格水準は提供されていません — 取引シグナル欄は省略されています。
ビットコインは200週移動平均を63kドルで再び回復しました。これはただのノイズではありません。この水準は長期のトレンドフィルターとして何年も機能してきていて、BTCがそれを上回って維持したときは、次の局面が必ずついてきました。これは“見せかけ”ではなく、本物の勢いを伴うブレイクです。
問題は、これが継続的な上昇の始まりなのか、それとも重要な水準を上抜ける一瞬のヒゲ(フェイク)にすぎないのか。ここであなたの一手は?
※金融アドバイスではありません。必ずリスクを管理してください。
#BTC #Bullish #200WeekMA #Crypto
🔥
入力内に特定の価格水準は提供されていません — 取引シグナル欄は省略されています。
ビットコインは200週移動平均を63kドルで再び回復しました。これはただのノイズではありません。この水準は長期のトレンドフィルターとして何年も機能してきていて、BTCがそれを上回って維持したときは、次の局面が必ずついてきました。これは“見せかけ”ではなく、本物の勢いを伴うブレイクです。
問題は、これが継続的な上昇の始まりなのか、それとも重要な水準を上抜ける一瞬のヒゲ(フェイク)にすぎないのか。ここであなたの一手は?
※金融アドバイスではありません。必ずリスクを管理してください。
#BTC #Bullish #200WeekMA #Crypto
🔥
31

記事
翻訳参照
$BTC Dips Below the 200-Week Moving Average: What Happens Next for Bitcoin?Bitcoin touched $67,500, under its $67,993 long-term trend line for the first time in 11 weeks. Here's why the level matters and what to watch.
📉 Bitcoin just poked through the line bears have been waiting to test for 11 weeks. The real question is whether it stays there.
$BTC fell to $67,500 on Nov. 13, just under its 200-week simple moving average of $67,993, the first touch of that average since Aug. 19. It was also Bitcoin's lowest price since that date. The price is down about 16% over the past month.
🧭 Why this line matters
The 200-week average smooths out nearly four years of weekly prices, which is why traders treat it as a deep, long-term support level. It isn't magic. It's just where a lot of long-term buyers have historically paid attention.
History gives mixed signals. Kraken found that brief dips below the 200-week average have historically produced median returns above 100% over the following year for buyers. That's past data, not a promise. And a line only works as support if buyers show up.
🔥 What pushed it down
This wasn't a crypto-only story. Macro-pressure did most of the work.
The 10-year Treasury yield reached 5.125% and the 30-year hit 5.459%, and the dollar index rose above 103, it's highest since April 2025. Behind that is the rate outlook. After stronger-than-expected October inflation data, traders priced in about an 80% chance of a December Fed hike, and CME FedWatch showed 88% in one report. Odds vary by source and time. Higher rates make a non-yielding asset like $BTC harder to hold.
Leverage made it worse. Crypto liquidations hit $1.64 billion over 24 hours per CoinGlass, with long positions making up about 88.7%. Other trackers showed lower totals, so the figure depends on the data source. US spot Bitcoin ETFs also recorded $299.8 million in net outflows on Nov. 11.
🛑 What one dip doesn't prove
Bitcoin went under the line by less than 1%, and briefly. A wick through a level is not a weekly close. The line matters most when a full week ends below it.
There's a nuance in the derivatives data too. Perpetual futures funding turned negative for the first time in a month, which can coincide with local bottoms but doesn't guarantee a reversal. Negative funding means shorts are paying longs, so some traders are leaning bearish. Sometimes that marks a low. Sometimes it's just the trend.
📍 The levels analysts are watching
Material Indicators co-founder Keith Alan said the weekly RSI has returned to 41.5, which supported price in late July, and that losing it could open the door to the $57,700 cycle low. That's one analyst's scenario, not a forecast. Momentum is also soft: the MACD indicator was negative, and the daily RSI fell to 28.4. Below the 200-week line, the August zone near $62,200 is the next support area.
✅ What this means for you
If you're holding: a line test is a reason to review your plan, not to panic. Decide in advance what a weekly close below it would mean for you.
If you're trading: wait for the weekly close and the reaction. A wick can reverse in hours.
If you're building a bigger picture: the pressure is coming from yields, the dollar, and leverage, not just from Bitcoin's own chart. Strive's CEO described this zone as historically favorable for long-term investors, but that's one view among many.
🟢 Bullish scenario
Bitcoin reclaims $67,993 on a weekly close, yields stop climbing, and ETF outflows slow. The dip then looks like a retest of support, not a breakdown.
🔴 Risk scenario
The weekly close lands below the line, the weekly RSI loses 41.5, and the dollar and yields keep rising. That puts the August zone, and possibly $57,700, back in focus.
👀 Three things I'm watching
1️⃣ The weekly close
Does $BTC finish the week above or below $67,993?
2️⃣ Weekly RSI at 41.5
Does that level hold, or fail?
3️⃣ Rates, the dollar, and ETF flows
Producer prices are due this afternoon. Do yields keep rising, and do ETF outflows slow?
💡 The takeaway
This dip is a warning, not a verdict. The weekly close will tell us far more than a single wick through the line.
I'm watching rates and ETF flows as closely as the chart, because they're what's pushing on price right now.
This post is for informational and educational purposes only and is not financial advice. Crypto markets are volatile. Always conduct your own research before making financial decisions.
🔥 Will the 200-week line hold, or do we see $60K first? Tell me how you read it. 👇
#BinanceSquare #Bitcoin #BTC #200WeekMA #CryptoNews
{spot}(BTCUSDT)
$BTC Dips Below the 200-Week Moving Average: What Happens Next for Bitcoin?
Bitcoin touched $67,500, under its $67,993 long-term trend line for the first time in 11 weeks. Here's why the level matters and what to watch.
📉 Bitcoin just poked through the line bears have been waiting to test for 11 weeks. The real question is whether it stays there.
$BTC fell to $67,500 on Nov. 13, just under its 200-week simple moving average of $67,993, the first touch of that average since Aug. 19. It was also Bitcoin's lowest price since that date. The price is down about 16% over the past month.
🧭 Why this line matters
The 200-week average smooths out nearly four years of weekly prices, which is why traders treat it as a deep, long-term support level. It isn't magic. It's just where a lot of long-term buyers have historically paid attention.
History gives mixed signals. Kraken found that brief dips below the 200-week average have historically produced median returns above 100% over the following year for buyers. That's past data, not a promise. And a line only works as support if buyers show up.
🔥 What pushed it down
This wasn't a crypto-only story. Macro-pressure did most of the work.
The 10-year Treasury yield reached 5.125% and the 30-year hit 5.459%, and the dollar index rose above 103, it's highest since April 2025. Behind that is the rate outlook. After stronger-than-expected October inflation data, traders priced in about an 80% chance of a December Fed hike, and CME FedWatch showed 88% in one report. Odds vary by source and time. Higher rates make a non-yielding asset like $BTC harder to hold.
Leverage made it worse. Crypto liquidations hit $1.64 billion over 24 hours per CoinGlass, with long positions making up about 88.7%. Other trackers showed lower totals, so the figure depends on the data source. US spot Bitcoin ETFs also recorded $299.8 million in net outflows on Nov. 11.
🛑 What one dip doesn't prove
Bitcoin went under the line by less than 1%, and briefly. A wick through a level is not a weekly close. The line matters most when a full week ends below it.
There's a nuance in the derivatives data too. Perpetual futures funding turned negative for the first time in a month, which can coincide with local bottoms but doesn't guarantee a reversal. Negative funding means shorts are paying longs, so some traders are leaning bearish. Sometimes that marks a low. Sometimes it's just the trend.
📍 The levels analysts are watching
Material Indicators co-founder Keith Alan said the weekly RSI has returned to 41.5, which supported price in late July, and that losing it could open the door to the $57,700 cycle low. That's one analyst's scenario, not a forecast. Momentum is also soft: the MACD indicator was negative, and the daily RSI fell to 28.4. Below the 200-week line, the August zone near $62,200 is the next support area.
✅ What this means for you
If you're holding: a line test is a reason to review your plan, not to panic. Decide in advance what a weekly close below it would mean for you.
If you're trading: wait for the weekly close and the reaction. A wick can reverse in hours.
If you're building a bigger picture: the pressure is coming from yields, the dollar, and leverage, not just from Bitcoin's own chart. Strive's CEO described this zone as historically favorable for long-term investors, but that's one view among many.
🟢 Bullish scenario
Bitcoin reclaims $67,993 on a weekly close, yields stop climbing, and ETF outflows slow. The dip then looks like a retest of support, not a breakdown.
🔴 Risk scenario
The weekly close lands below the line, the weekly RSI loses 41.5, and the dollar and yields keep rising. That puts the August zone, and possibly $57,700, back in focus.
👀 Three things I'm watching
1️⃣ The weekly close
Does $BTC finish the week above or below $67,993?
2️⃣ Weekly RSI at 41.5
Does that level hold, or fail?
3️⃣ Rates, the dollar, and ETF flows
Producer prices are due this afternoon. Do yields keep rising, and do ETF outflows slow?
💡 The takeaway
This dip is a warning, not a verdict. The weekly close will tell us far more than a single wick through the line.
I'm watching rates and ETF flows as closely as the chart, because they're what's pushing on price right now.
This post is for informational and educational purposes only and is not financial advice. Crypto markets are volatile. Always conduct your own research before making financial decisions.
🔥 Will the 200-week line hold, or do we see $60K first? Tell me how you read it. 👇
#BinanceSquare #Bitcoin #BTC #200WeekMA #CryptoNews
📉 Bitcoin just poked through the line bears have been waiting to test for 11 weeks. The real question is whether it stays there.
$BTC fell to $67,500 on Nov. 13, just under its 200-week simple moving average of $67,993, the first touch of that average since Aug. 19. It was also Bitcoin's lowest price since that date. The price is down about 16% over the past month.
🧭 Why this line matters
The 200-week average smooths out nearly four years of weekly prices, which is why traders treat it as a deep, long-term support level. It isn't magic. It's just where a lot of long-term buyers have historically paid attention.
History gives mixed signals. Kraken found that brief dips below the 200-week average have historically produced median returns above 100% over the following year for buyers. That's past data, not a promise. And a line only works as support if buyers show up.
🔥 What pushed it down
This wasn't a crypto-only story. Macro-pressure did most of the work.
The 10-year Treasury yield reached 5.125% and the 30-year hit 5.459%, and the dollar index rose above 103, it's highest since April 2025. Behind that is the rate outlook. After stronger-than-expected October inflation data, traders priced in about an 80% chance of a December Fed hike, and CME FedWatch showed 88% in one report. Odds vary by source and time. Higher rates make a non-yielding asset like $BTC harder to hold.
Leverage made it worse. Crypto liquidations hit $1.64 billion over 24 hours per CoinGlass, with long positions making up about 88.7%. Other trackers showed lower totals, so the figure depends on the data source. US spot Bitcoin ETFs also recorded $299.8 million in net outflows on Nov. 11.
🛑 What one dip doesn't prove
Bitcoin went under the line by less than 1%, and briefly. A wick through a level is not a weekly close. The line matters most when a full week ends below it.
There's a nuance in the derivatives data too. Perpetual futures funding turned negative for the first time in a month, which can coincide with local bottoms but doesn't guarantee a reversal. Negative funding means shorts are paying longs, so some traders are leaning bearish. Sometimes that marks a low. Sometimes it's just the trend.
📍 The levels analysts are watching
Material Indicators co-founder Keith Alan said the weekly RSI has returned to 41.5, which supported price in late July, and that losing it could open the door to the $57,700 cycle low. That's one analyst's scenario, not a forecast. Momentum is also soft: the MACD indicator was negative, and the daily RSI fell to 28.4. Below the 200-week line, the August zone near $62,200 is the next support area.
✅ What this means for you
If you're holding: a line test is a reason to review your plan, not to panic. Decide in advance what a weekly close below it would mean for you.
If you're trading: wait for the weekly close and the reaction. A wick can reverse in hours.
If you're building a bigger picture: the pressure is coming from yields, the dollar, and leverage, not just from Bitcoin's own chart. Strive's CEO described this zone as historically favorable for long-term investors, but that's one view among many.
🟢 Bullish scenario
Bitcoin reclaims $67,993 on a weekly close, yields stop climbing, and ETF outflows slow. The dip then looks like a retest of support, not a breakdown.
🔴 Risk scenario
The weekly close lands below the line, the weekly RSI loses 41.5, and the dollar and yields keep rising. That puts the August zone, and possibly $57,700, back in focus.
👀 Three things I'm watching
1️⃣ The weekly close
Does $BTC finish the week above or below $67,993?
2️⃣ Weekly RSI at 41.5
Does that level hold, or fail?
3️⃣ Rates, the dollar, and ETF flows
Producer prices are due this afternoon. Do yields keep rising, and do ETF outflows slow?
💡 The takeaway
This dip is a warning, not a verdict. The weekly close will tell us far more than a single wick through the line.
I'm watching rates and ETF flows as closely as the chart, because they're what's pushing on price right now.
This post is for informational and educational purposes only and is not financial advice. Crypto markets are volatile. Always conduct your own research before making financial decisions.
🔥 Will the 200-week line hold, or do we see $60K first? Tell me how you read it. 👇
#BinanceSquare #Bitcoin #BTC #200WeekMA #CryptoNews
1
175

$BTC は $57K の流動性スイープ後に 200週MAの上でホールド 🔥
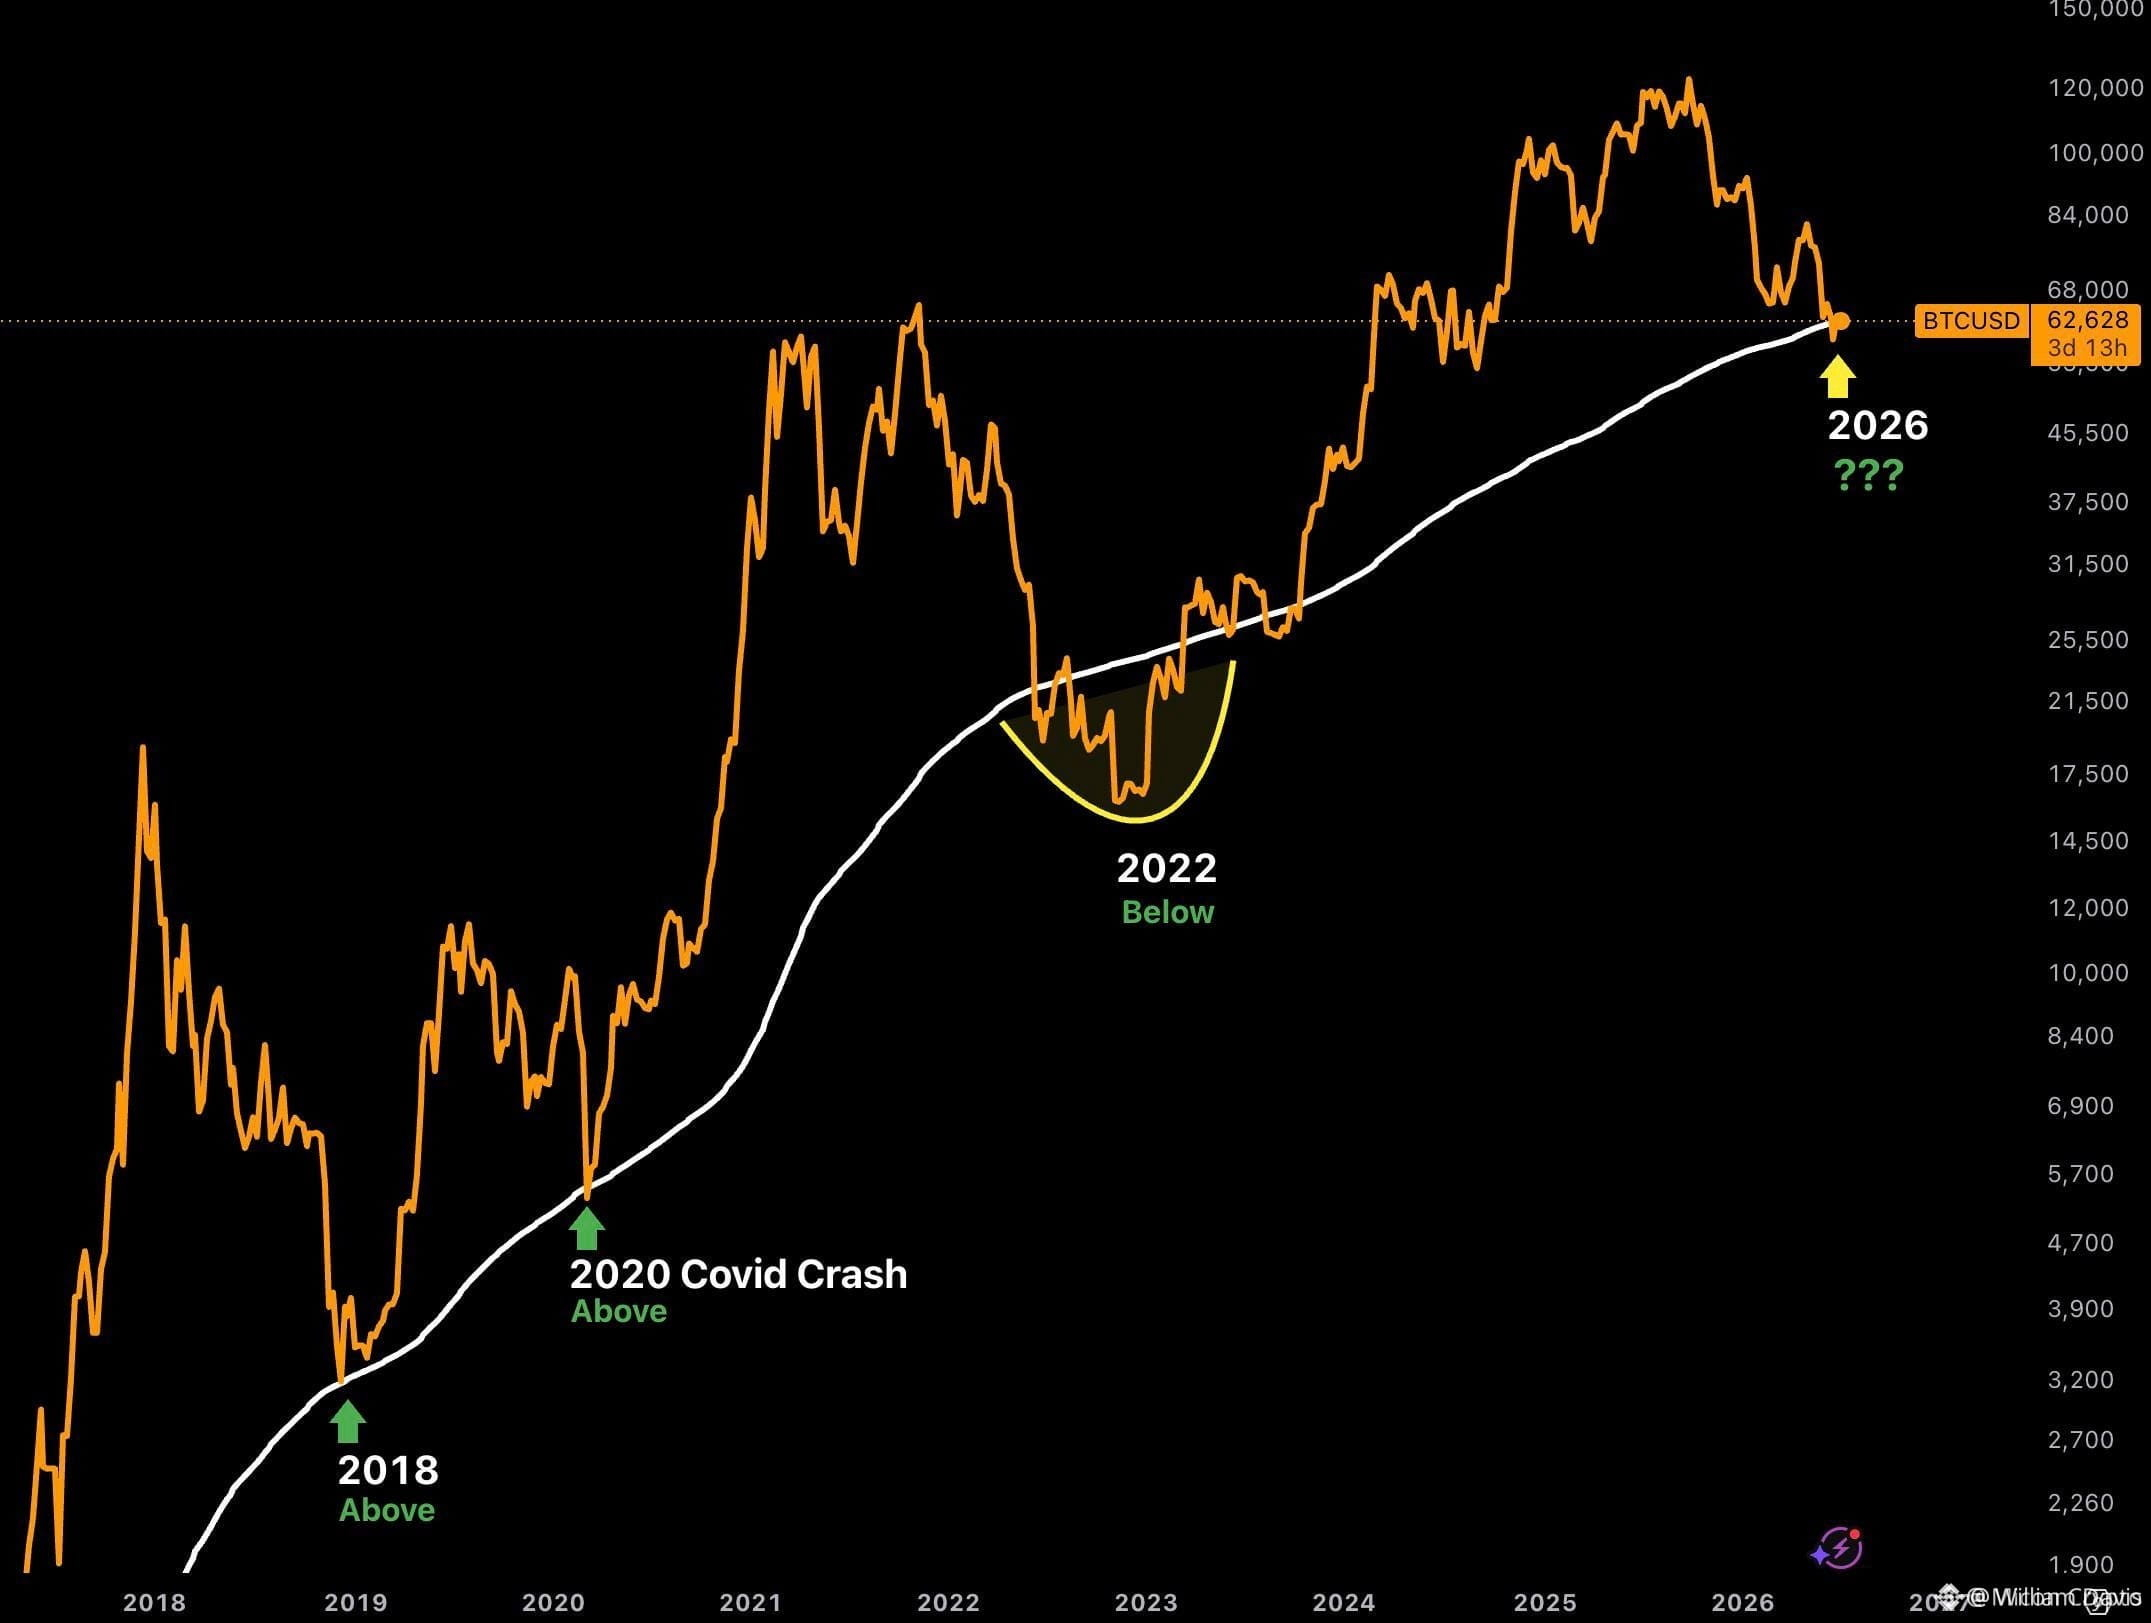
本文: この水準は過去10年で失われたのは1度だけ——2022年のクラッシュのとき——で、その後の各ホールドはすべて構造的な上昇(ブレイク)に先行してきました。BTCは、$57kのサイクル安値をスイープした後、現在$60kを回復しており、日次で出来高も増えてきています。
マクロの不確実性は残っていますが、このサポートが買いを引きつけ続けるなら、歴史的な夏のポンプのパターンがまだ機能している可能性があります。あなたは上昇に向けてポジションを取っていますか、それともレンジの再テストを想定していますか?
投資助言ではありません。常にリスク管理を行ってください。
#BTC #SupportTest #200WeekMA #Crypto #SummerPump
🔥
$BTC は $57K の流動性スイープ後に 200週MAの上でホールド 🔥
本文: この水準は過去10年で失われたのは1度だけ——2022年のクラッシュのとき——で、その後の各ホールドはすべて構造的な上昇(ブレイク)に先行してきました。BTCは、$57kのサイクル安値をスイープした後、現在$60kを回復しており、日次で出来高も増えてきています。
マクロの不確実性は残っていますが、このサポートが買いを引きつけ続けるなら、歴史的な夏のポンプのパターンがまだ機能している可能性があります。あなたは上昇に向けてポジションを取っていますか、それともレンジの再テストを想定していますか?
投資助言ではありません。常にリスク管理を行ってください。
#BTC #SupportTest #200WeekMA #Crypto #SummerPump
🔥
本文: この水準は過去10年で失われたのは1度だけ——2022年のクラッシュのとき——で、その後の各ホールドはすべて構造的な上昇(ブレイク)に先行してきました。BTCは、$57kのサイクル安値をスイープした後、現在$60kを回復しており、日次で出来高も増えてきています。
マクロの不確実性は残っていますが、このサポートが買いを引きつけ続けるなら、歴史的な夏のポンプのパターンがまだ機能している可能性があります。あなたは上昇に向けてポジションを取っていますか、それともレンジの再テストを想定していますか?
投資助言ではありません。常にリスク管理を行ってください。
#BTC #SupportTest #200WeekMA #Crypto #SummerPump
🔥
31

·
--
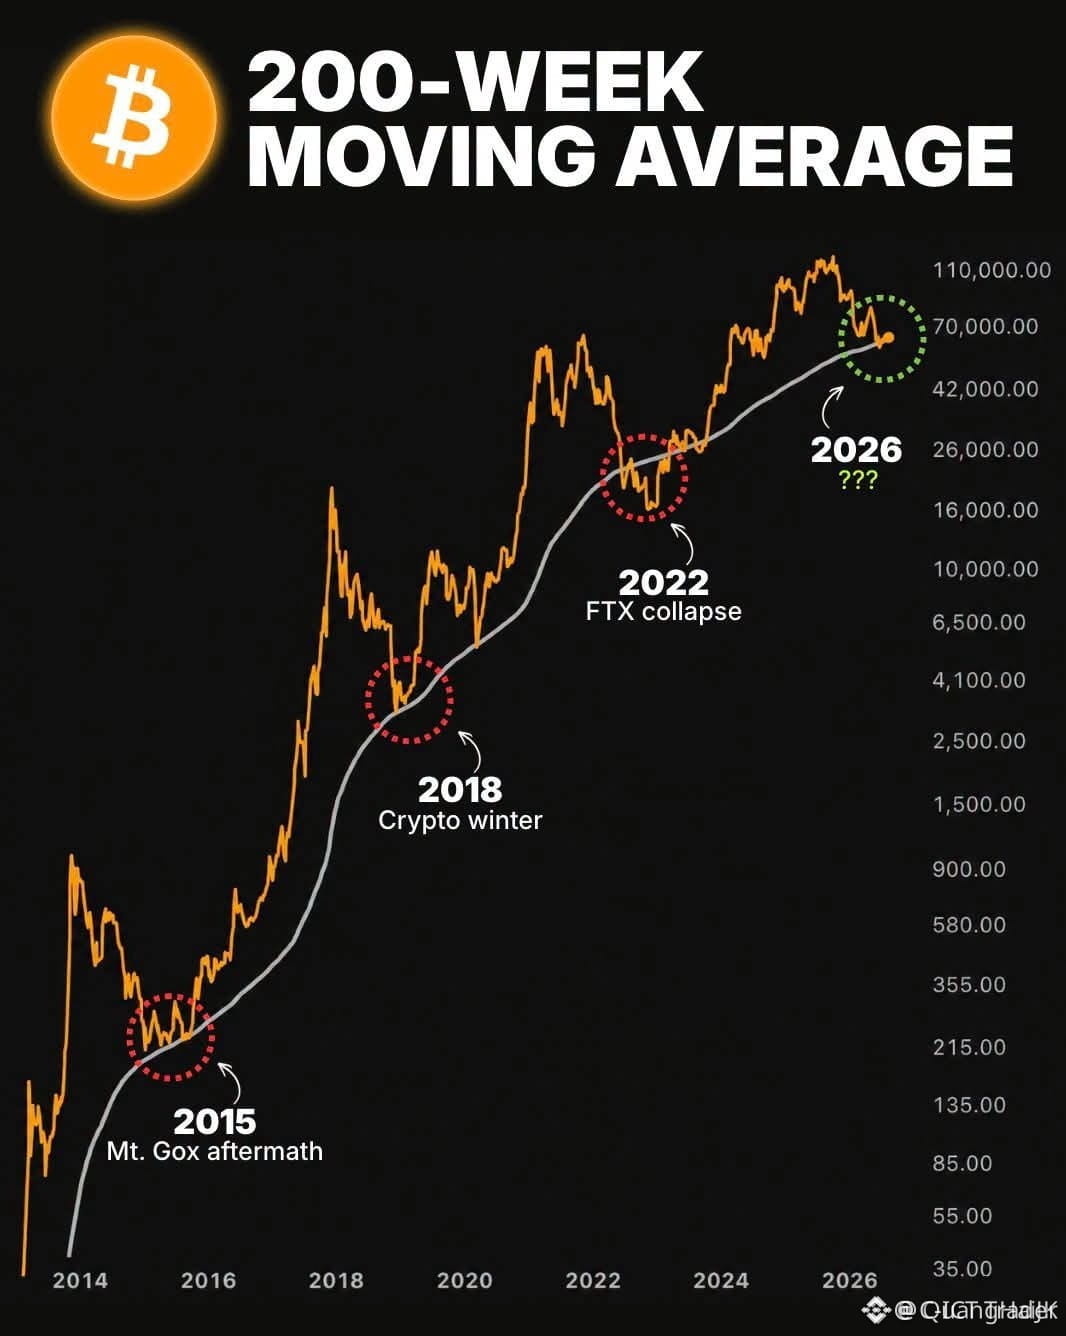
🛑 $BTC REJECTS 200-WEEK MA — 歴史的な弱気シグナル? 📉
📊 200週移動平均は、ビットコインにとってあらゆるサイクルでの“最後の砦”となってきました。ここでの拒否(リジェクト)はすべて、深い調整局面に入る前の最終的なディストリビューション段階を示してきました。 🦈 賢い資金は確認を待ちません——彼らはすでにこのレジスタンスに対してショートを仕掛けており、$ETH and $SOL も同じ機関投資家の足跡を追っています。
⚠️ この水準が維持されるなら、マクロのバイアスは弱気に反転し、最も抵抗が少ない道は、その下の流動性を刈り取る動きだということを示唆します。歴史的なフラクタルは明確ですが、最終的に判断するのは値動きです。 💬 あなたは200週MAを尊重していますか?それともブレイクアウトを買いますか? 👇
⚠️ 投資助言ではありません。必ずリスク管理をしてください。 🛡️
🏷️ #BTC #Bearish #200WeekMA #Crypto #RiskOff
🐻 📉
🛑 $BTC REJECTS 200-WEEK MA — 歴史的な弱気シグナル? 📉
📊 200週移動平均は、ビットコインにとってあらゆるサイクルでの“最後の砦”となってきました。ここでの拒否(リジェクト)はすべて、深い調整局面に入る前の最終的なディストリビューション段階を示してきました。 🦈 賢い資金は確認を待ちません——彼らはすでにこのレジスタンスに対してショートを仕掛けており、$ETH and $SOL も同じ機関投資家の足跡を追っています。
⚠️ この水準が維持されるなら、マクロのバイアスは弱気に反転し、最も抵抗が少ない道は、その下の流動性を刈り取る動きだということを示唆します。歴史的なフラクタルは明確ですが、最終的に判断するのは値動きです。 💬 あなたは200週MAを尊重していますか?それともブレイクアウトを買いますか? 👇
⚠️ 投資助言ではありません。必ずリスク管理をしてください。 🛡️
🏷️ #BTC #Bearish #200WeekMA #Crypto #RiskOff
🐻 📉
📊 200週移動平均は、ビットコインにとってあらゆるサイクルでの“最後の砦”となってきました。ここでの拒否(リジェクト)はすべて、深い調整局面に入る前の最終的なディストリビューション段階を示してきました。 🦈 賢い資金は確認を待ちません——彼らはすでにこのレジスタンスに対してショートを仕掛けており、$ETH and $SOL も同じ機関投資家の足跡を追っています。
⚠️ この水準が維持されるなら、マクロのバイアスは弱気に反転し、最も抵抗が少ない道は、その下の流動性を刈り取る動きだということを示唆します。歴史的なフラクタルは明確ですが、最終的に判断するのは値動きです。 💬 あなたは200週MAを尊重していますか?それともブレイクアウトを買いますか? 👇
⚠️ 投資助言ではありません。必ずリスク管理をしてください。 🛡️
🏷️ #BTC #Bearish #200WeekMA #Crypto #RiskOff
🐻 📉
36

·
--
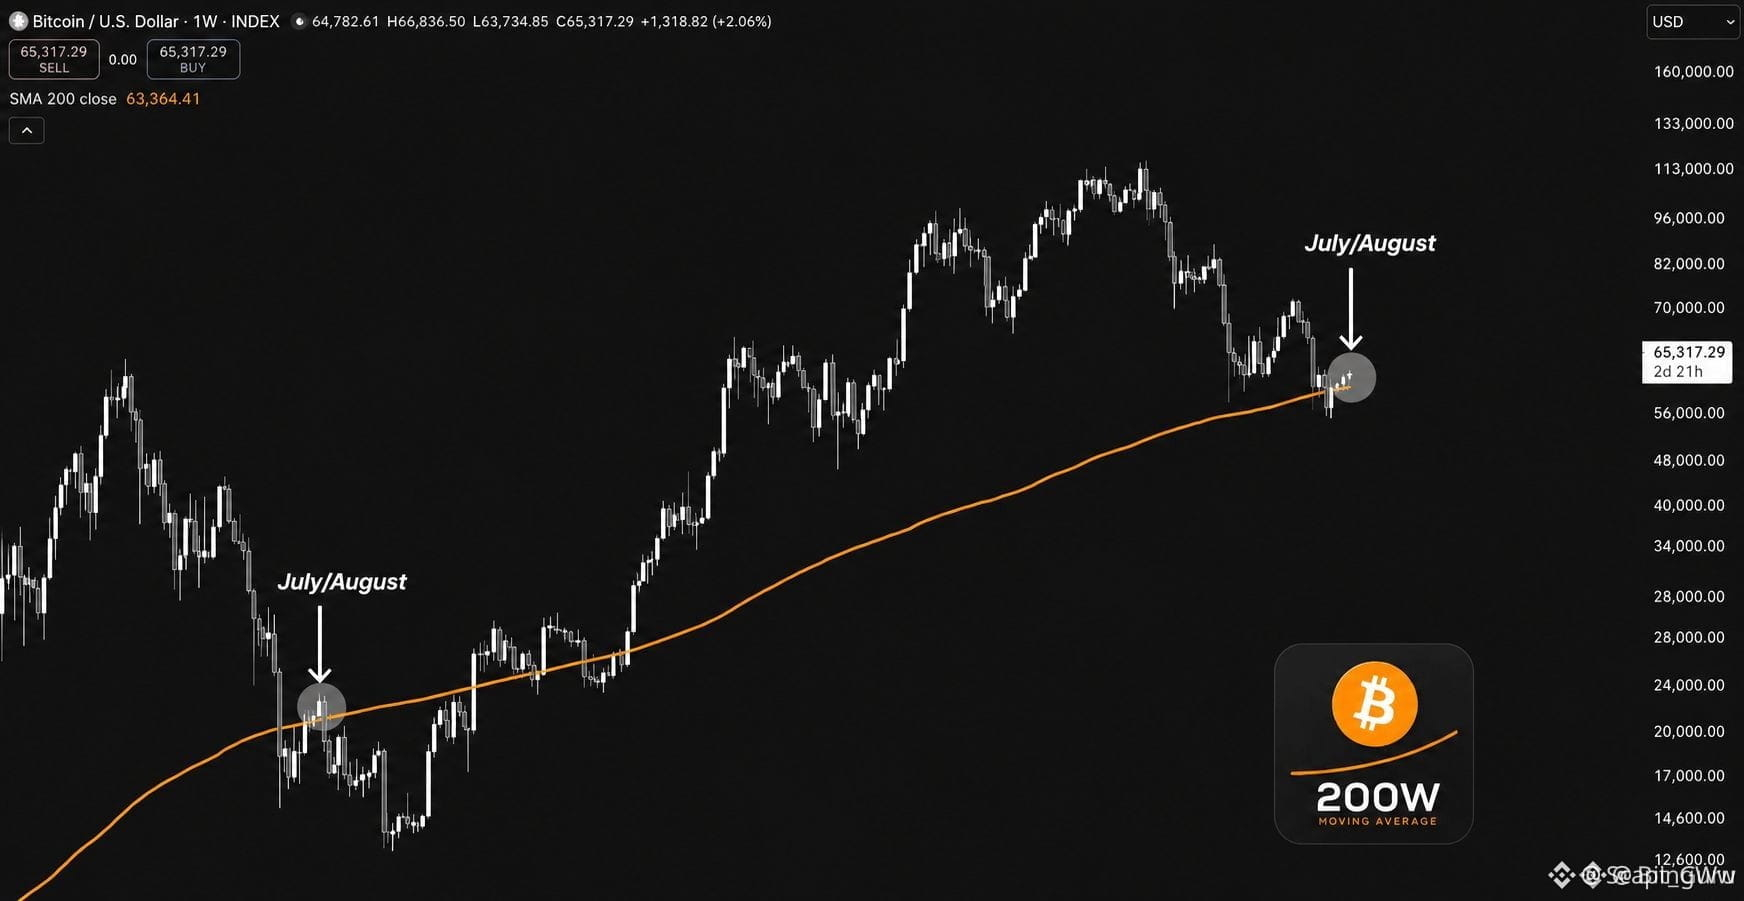
$BTC 200W MA RETEST – 買い手か売り手かが主導権を握るのか? 🚨🐂
📌 これは単なる別のサポートゾーンではありません——200週移動平均であり、2015年以来の主要な下落局面からビットコインを反転させてきた“一線を画すライン”です。買い手は要塞のようにそれを防衛していますが、接近するにつれて出来高が薄くなっており、爆発的な値動きのための典型的なセッティングです。
📊 この水準の直近2回の7月/8月のリテストは、数カ月にわたる上昇ラリーを引き起こしました。もし歴史が繰り返されるなら、Q4の勢いの土台が今まさに築かれている最中です。とはいえ、週足の終値がこのラインを下回ると、回復の前にさらに深い流動性の刈り取りが起こる扉が開きます。 💡 この戦いに、あなたはどちらの側につきますか? 💬
⚠️ 金融助言ではありません。必ずリスク管理をしてください。 🛡️
🏷️ #BTC #200WeekMA #Bitcoin #SupportTest #Crypto
🐂 🛡️
$BTC 200W MA RETEST – 買い手か売り手かが主導権を握るのか? 🚨🐂
📌 これは単なる別のサポートゾーンではありません——200週移動平均であり、2015年以来の主要な下落局面からビットコインを反転させてきた“一線を画すライン”です。買い手は要塞のようにそれを防衛していますが、接近するにつれて出来高が薄くなっており、爆発的な値動きのための典型的なセッティングです。
📊 この水準の直近2回の7月/8月のリテストは、数カ月にわたる上昇ラリーを引き起こしました。もし歴史が繰り返されるなら、Q4の勢いの土台が今まさに築かれている最中です。とはいえ、週足の終値がこのラインを下回ると、回復の前にさらに深い流動性の刈り取りが起こる扉が開きます。 💡 この戦いに、あなたはどちらの側につきますか? 💬
⚠️ 金融助言ではありません。必ずリスク管理をしてください。 🛡️
🏷️ #BTC #200WeekMA #Bitcoin #SupportTest #Crypto
🐂 🛡️
📌 これは単なる別のサポートゾーンではありません——200週移動平均であり、2015年以来の主要な下落局面からビットコインを反転させてきた“一線を画すライン”です。買い手は要塞のようにそれを防衛していますが、接近するにつれて出来高が薄くなっており、爆発的な値動きのための典型的なセッティングです。
📊 この水準の直近2回の7月/8月のリテストは、数カ月にわたる上昇ラリーを引き起こしました。もし歴史が繰り返されるなら、Q4の勢いの土台が今まさに築かれている最中です。とはいえ、週足の終値がこのラインを下回ると、回復の前にさらに深い流動性の刈り取りが起こる扉が開きます。 💡 この戦いに、あなたはどちらの側につきますか? 💬
⚠️ 金融助言ではありません。必ずリスク管理をしてください。 🛡️
🏷️ #BTC #200WeekMA #Bitcoin #SupportTest #Crypto
🐂 🛡️
15
ログインして、さらにコンテンツを読む
厳選トピックで世界の暗号資産トレーダーの仲間入り
⚡️ 暗号資産に関する最新かつ有益な情報が見つかります。
💬 世界最大の暗号資産取引所から信頼されています。
👍 認証を受けたクリエイターから、有益なインサイトを得られます。
メール / 電話番号
トレンドトピック
1
#CryptoSelloffTriggersMultipleWhaleLiquidations
閲覧回数 5,597
166人が討論中
2
#USSpotXRPETFsSeeLargestWeeklyOutflowIn8Months
閲覧回数 48,247
580人が討論中
3
#WillFOMCMinutesReinforceRateHikeExpectations?
閲覧回数 1,711
56人が討論中
4
#BitcoinActiveSupplyInProfitDropsBelow45%
閲覧回数 107,289
981人が討論中
5
#TONStrategyReports$23.97MQ3NetLoss
閲覧回数 12,888
69人が討論中
6
#KavaSaysAbnormalActivityLimitedToKavaLend
閲覧回数 70,596
545人が討論中
7
#WORPTLetsTouristsConvertCryptoToThaiBaht
閲覧回数 14,558
168人が討論中
8
#WhoWillSucceedJensenHuangatNvidia?
閲覧回数 225,303
1,874人が討論中
9
#WhatWillDriveCryptoandStocks’NextRebound?
閲覧回数 666,825
3,687人が討論中
10
#TradFiForBeginners
閲覧回数 765,665
4,654人が討論中