
资管舵
4.4k Posts

资管舵
加密圈“K线甄嬛传观众”BTC涨了我秒变“多头贵妃”,跌了直接“冷宫待诏”,实盘操作主打“割肉是不可能的,嘴硬才是本命”,#币圈精神状态良好 #亏麻但嘴硬

BNB Holder
Frequent Trader
7.7 Years
361 Following
527 Followers
6.0K+ Liked
Posts
All
Quotes
Videos
ZEC is currently the strongest asset in the market. ETF inflows are still continuing. Shorting a strong asset is going against the trend— the risk of getting squeezed is extremely high. Last week, ZEC surged 45% in a single week, which suggests that one round of short positions has already been flushed out. The remaining shorts are prepared—they’re not easy to mess with. There’s no clear top signal: volume-price divergence, RSI extremely overbought, and signs of major holders distributing—all of these currently aren’t clear enough.
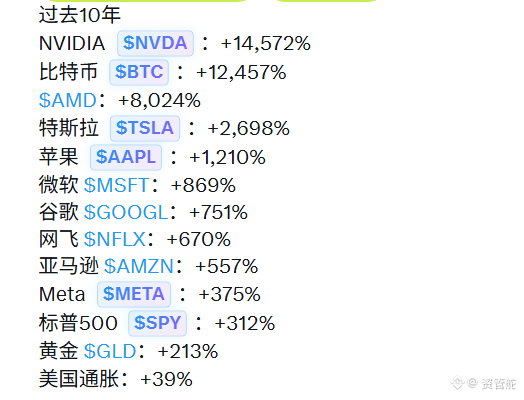
What asset performed the best over the past 10 years? This chart puts the answer right in your face.
Nvidia (NVDA) is up 145x, or 14,572%. Bitcoin (BTC) follows next: more than 124x, or 12,457%. These two have left other assets far behind.
Tesla 2,698%, Apple 1,210%. Microsoft 869%, Google 751%. Netflix 670%, Amazon 557%, Meta 375%.
As a benchmark, the S&P 500 is only 312%, and gold is 213%. Cumulative US inflation over the past decade has been just 39%.
A few points worth pondering. First, the only two asset categories to generate 100x returns in the past decade are the AI computing power narrative and decentralized currencies—not by a few dozen percent, but by tens of thousands of percentage points. Second, the traditional “seven tech giants” also surged, but compared with NVDA and BTC they fall short by an entire order of magnitude. Third, people who held cash or only bought US Treasuries had their purchasing power eroded by inflation by nearly 40%; yet even just buying a basic S&P 500 ETF could deliver more than a 3x return.
Of course, the past doesn’t guarantee the future. But this chart at least shows one thing: when a truly epoch-level trend arrives, the return gap between those who recognize it early and “get on the bus” versus those who stubbornly hold on to the wrong side is, quite literally, exponential-level crushing.
Nvidia (NVDA) is up 145x, or 14,572%. Bitcoin (BTC) follows next: more than 124x, or 12,457%. These two have left other assets far behind.
Tesla 2,698%, Apple 1,210%. Microsoft 869%, Google 751%. Netflix 670%, Amazon 557%, Meta 375%.
As a benchmark, the S&P 500 is only 312%, and gold is 213%. Cumulative US inflation over the past decade has been just 39%.
A few points worth pondering. First, the only two asset categories to generate 100x returns in the past decade are the AI computing power narrative and decentralized currencies—not by a few dozen percent, but by tens of thousands of percentage points. Second, the traditional “seven tech giants” also surged, but compared with NVDA and BTC they fall short by an entire order of magnitude. Third, people who held cash or only bought US Treasuries had their purchasing power eroded by inflation by nearly 40%; yet even just buying a basic S&P 500 ETF could deliver more than a 3x return.
Of course, the past doesn’t guarantee the future. But this chart at least shows one thing: when a truly epoch-level trend arrives, the return gap between those who recognize it early and “get on the bus” versus those who stubbornly hold on to the wrong side is, quite literally, exponential-level crushing.



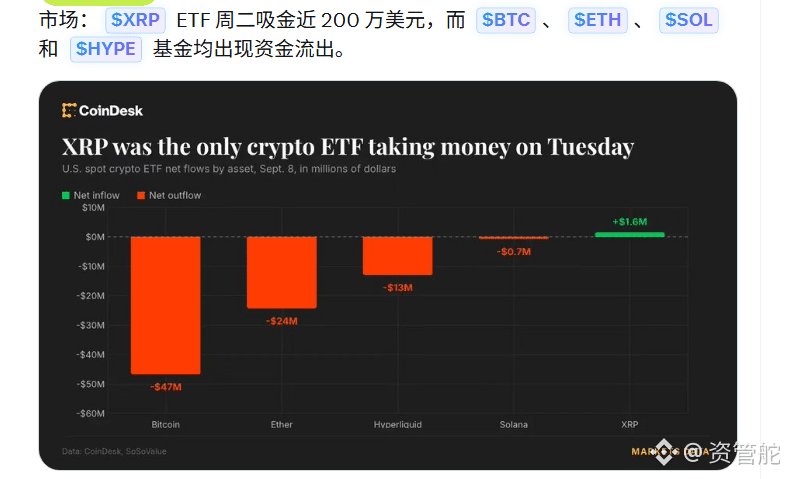
September 8 US crypto ETFs: XRP is the only net inflow, pulling in $47 million in a single day. Mainstream coins are all bleeding capital—BTC sees outflows of $24 million, and ETH is redeemed for $60 million. Funds are shifting from large-cap assets toward higher-volatility targets.

The U.S. Treasury will announce the size of its Treasury bond repurchase program tonight at 23:00. This time, the market is watching just how much effort Bessent can bring to it.
The background is simple. The U.S. has been repurchasing long-term Treasuries since May 2024. Previously, each time it was $2.0 billion, later it was mentioned that the lower bound would be $4.0 billion. But the Treasury has the discretion to increase the amount at any time, and the market’s current expectation is that this time, Bessent will most likely exceed the target that has already been announced.
Why this matters: Treasury bond repurchases directly remove long-end supply from the market, which has a downward effect on the yield curve. If the size comes in above expectations, long-end rates of 10 years and above may continue to move lower, which would be an implicit positive for risk assets. Conversely, if it falls short of expectations, trades that are already pricing in a rate cut may need to be repriced.
Keep an eye on the 11:00 p.m. data. #美加关税战升级 $VVV
The background is simple. The U.S. has been repurchasing long-term Treasuries since May 2024. Previously, each time it was $2.0 billion, later it was mentioned that the lower bound would be $4.0 billion. But the Treasury has the discretion to increase the amount at any time, and the market’s current expectation is that this time, Bessent will most likely exceed the target that has already been announced.
Why this matters: Treasury bond repurchases directly remove long-end supply from the market, which has a downward effect on the yield curve. If the size comes in above expectations, long-end rates of 10 years and above may continue to move lower, which would be an implicit positive for risk assets. Conversely, if it falls short of expectations, trades that are already pricing in a rate cut may need to be repriced.
Keep an eye on the 11:00 p.m. data. #美加关税战升级 $VVV

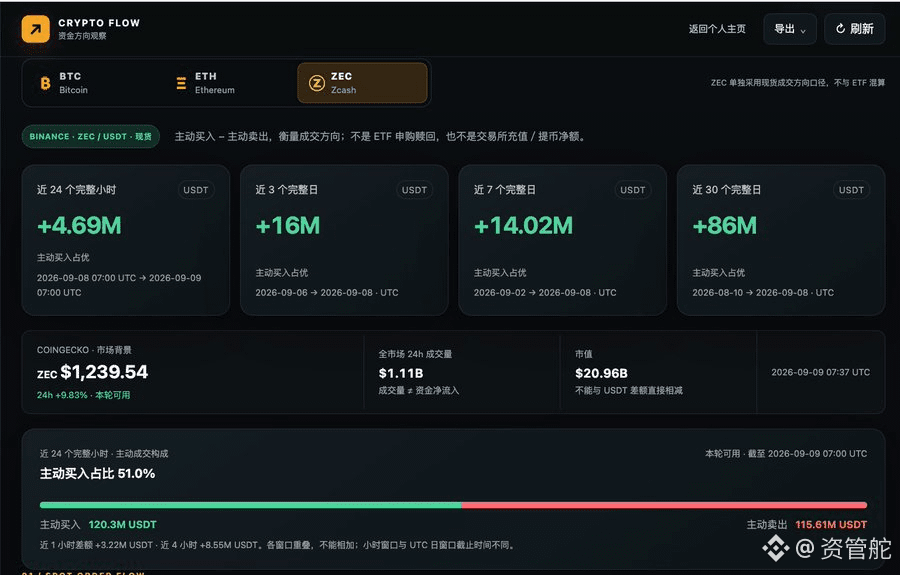
ZEC rises nearly 10% in 24 hours, reaching $1,239. Net inflow of 16 million USDT in a single day; over the past 30 days, it has pulled in 86 million. More than half of the buys were made intentionally, and the momentum is accelerating. Not retail-level volumes.
The Ministry of Finance’s long-term government bond repurchase operations officially begin today (September 9) — the market will focus on the size of the repurchase. If the repurchase size exceeds expectations → bulls in the right direction. If the repurchase size falls short of expectations or the market has already priced it in → a potential reversal that could backfire on the bulls, leading to bull stop-losses. If there is no new news → the market will continue churning in the 79,000–81,000 range.$VVV

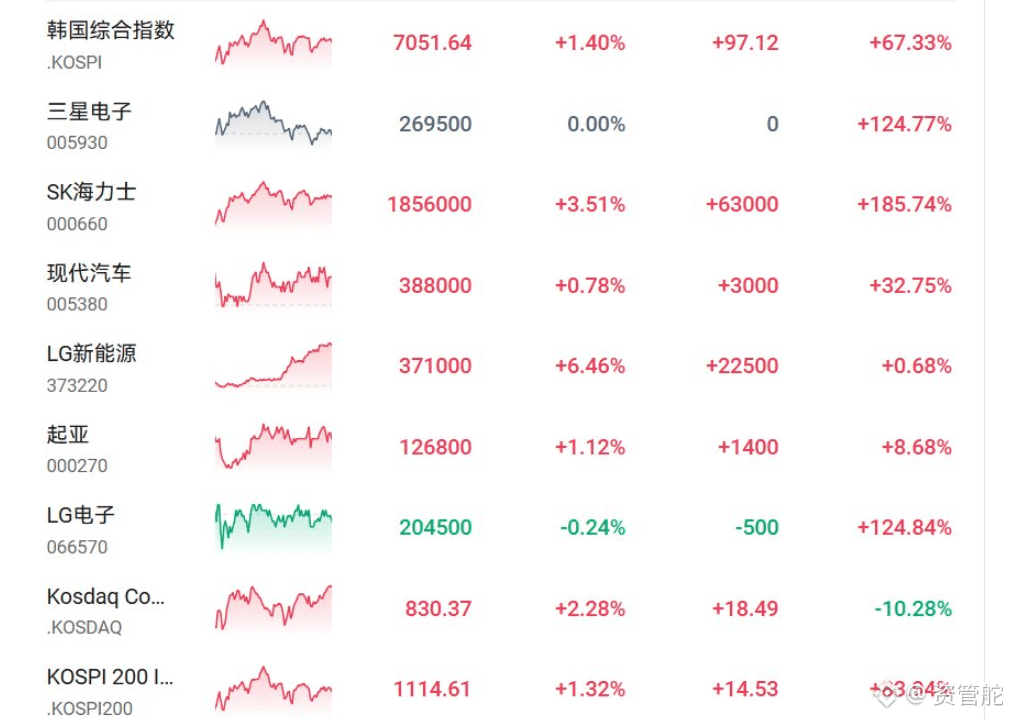
Korean stocks are quite interesting today. The KOSPI closed at 7,051.64, up 1.4%, with a year-to-date gain already reaching 67%. The standout is SK Hynix: it surged 3.5% in a single day, with its year-to-date cumulative gain at 186%—and this AI storage rally has really brought it the fattest share. LG Energy Solution also rose 6.46%, and the battery sector followed the move driven by electric-vehicle expectations. Samsung Electronics was flat on the day, but it has still more than doubled year-to-date.
This market trend in Korea essentially shows that global capital’s preference for semiconductors and new energy hasn’t changed. A 67% gain for the KOSPI year-to-date is impressive among major global markets, but if you’re chasing after the jump, you need to think about one thing: after SK Hynix has nearly doubled, the AI expectations priced into its valuation are already quite full. While it’s true that HBM capacity expansion is underway, the extent to which the stock price has already reacted in advance isn’t small either.
In my view, the Korean stock market is suitable to be used as a barometer for the global tech cycle, but the odds of directly buying into individual stocks aren’t as attractive as they were half a year ago. If you want to participate in this theme, it may be more comfortable to wait for a decent pullback before jumping in.
This market trend in Korea essentially shows that global capital’s preference for semiconductors and new energy hasn’t changed. A 67% gain for the KOSPI year-to-date is impressive among major global markets, but if you’re chasing after the jump, you need to think about one thing: after SK Hynix has nearly doubled, the AI expectations priced into its valuation are already quite full. While it’s true that HBM capacity expansion is underway, the extent to which the stock price has already reacted in advance isn’t small either.
In my view, the Korean stock market is suitable to be used as a barometer for the global tech cycle, but the odds of directly buying into individual stocks aren’t as attractive as they were half a year ago. If you want to participate in this theme, it may be more comfortable to wait for a decent pullback before jumping in.
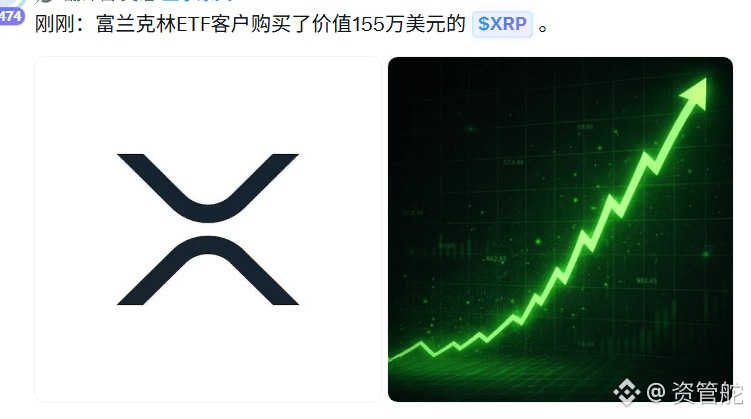
Franklin ETF customers have just bought $1.55 million worth of XRP. A single order isn’t huge compared to daily XRP trading volume, but once asset managers start positioning at this level, it shows that regulated channels are increasingly accepting crypto. Institutional money is moving in with real cash rather than just headlines.


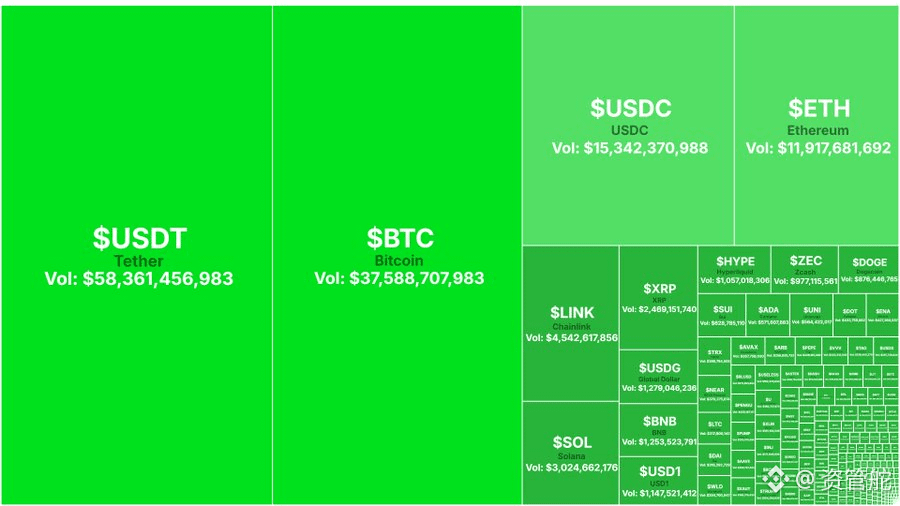
This 24-hour trading volume map contains a few interesting signals.
At first glance, it’s the stablecoin volumes. USDT trades $58.4 billion in a day, USDC $15.3 billion, and with other stablecoins included, the total is about $76 billion. BTC is $37.6 billion and ETH is $11.9 billion. That means more than half of the entire market’s trading volume happens on stablecoins.
Some interpret this as capital seeking safety, but that’s not quite right. When stablecoin volume is high, it more often reflects that stablecoins are the market’s pricing medium—every buy and sell has to go through them. This magnitude is more like the market’s bloodstream flow rather than an emotion indicator.
The real information lies in the ranking afterward. LINK trades $4.5 billion a day, ranking fifth—higher than SOL’s $3.0 billion and XRP’s $2.5 billion. Moving into the top five suggests that real money has recently been paying attention to it. SOL ranks sixth, which matches the recent heat around the x402 AI agent narrative over the past couple of days.
There’s also a detail: ZEC trades around $800 million and squeezes into the front ranks. For a privacy coin’s volume to reach this level—along with the cross-chain infiltration story mentioned earlier—points to the same narrative, and the momentum is still continuing.
When you look at charts like this, don’t just stare at who’s number one. The #1 spot is always USDT, no exceptions. What you should watch is who’s changing position. Volume’s rise and fall is more honest than price swings—volume is real money put in, while price can sometimes be manufactured through wash trading.
At first glance, it’s the stablecoin volumes. USDT trades $58.4 billion in a day, USDC $15.3 billion, and with other stablecoins included, the total is about $76 billion. BTC is $37.6 billion and ETH is $11.9 billion. That means more than half of the entire market’s trading volume happens on stablecoins.
Some interpret this as capital seeking safety, but that’s not quite right. When stablecoin volume is high, it more often reflects that stablecoins are the market’s pricing medium—every buy and sell has to go through them. This magnitude is more like the market’s bloodstream flow rather than an emotion indicator.
The real information lies in the ranking afterward. LINK trades $4.5 billion a day, ranking fifth—higher than SOL’s $3.0 billion and XRP’s $2.5 billion. Moving into the top five suggests that real money has recently been paying attention to it. SOL ranks sixth, which matches the recent heat around the x402 AI agent narrative over the past couple of days.
There’s also a detail: ZEC trades around $800 million and squeezes into the front ranks. For a privacy coin’s volume to reach this level—along with the cross-chain infiltration story mentioned earlier—points to the same narrative, and the momentum is still continuing.
When you look at charts like this, don’t just stare at who’s number one. The #1 spot is always USDT, no exceptions. What you should watch is who’s changing position. Volume’s rise and fall is more honest than price swings—volume is real money put in, while price can sometimes be manufactured through wash trading.
Log in to explore more content