
Bitcoinworld
69k Posts

Bitcoinworld
 Square Verified+
Report
Block User
BitcoinWorld is a leading media publication bringing the latest happenings in the Blockchain and Crypto Space.

#BinanceTurns7

Excellence Award (Market Buzz)

Creator of the Year
2 Following
100.6K+ Followers
287.3K+ Liked
4 Badges
Posts
All
Videos
Live
·
--
Article
ARTPRICE NEWS: a WORLD-BOOK BECOMES a MIRROR for ARTIFICIAL INTELLIGENCEBitcoinWorldARTPRICE NEWS: A WORLD-BOOK BECOMES A MIRROR FOR ARTIFICIAL INTELLIGENCE
OpenAI/Astra, Perplexity, DeepSeek, Google Gemini and xAI/Grok are confronted with the same work: a meta-reading experiment turns literary criticism into a comparative laboratory for artificial intelligence.
PARIS, Sept. 18, 2026 /PRNewswire/ — What if, in order to understand artificial intelligences, we gave them exactly the same book to read?
That is the experiment now accompanying “Dialogue Between a Thinker and AI”.
“Dialogue Between a Thinker and AI” by thierry Ehrmann
A world-book written by Thierry Ehrmann becomes a mirror for artificial intelligence. After hundreds of hours of dialogue, human thought, archives, questions, and contradictions gave rise to a book whose pen was entrusted to artificial intelligence.
https://www.dialoguebetweenathinkerandai.com/en/
Today, the book also exists materially: its French and English editions are in print. But the experiment does not end with the book. It now turns back toward the artificial intelligences themselves.
We didn’t ask AI to judge the book. We asked AIs to read it — and then to read each other.
The complete corpus is submitted to several major systems:
OpenAI / Astra, Perplexity, DeepSeek, Google Gemini, and xAI / Grok.
They all receive the same object. But do they produce the same reading?
https://www.dialoguebetweenathinkerandai.com/en/meta-reading/
FIVE AIs. ONE BOOK. FIVE MAPS?
The objective is not to organize a competition between models.
It is precisely the opposite.
The purpose is to observe their convergences, divergences, and blind spots.
Which concepts do they spontaneously identify? Which theses do they consider central? Which passages do they connect? Where do their interpretations diverge?
And above all: what happens when each is subsequently given access to the analyses produced by the others? At that moment, a meta-reading emerges.
AI no longer merely reads the book.
It reads another AI reading the book.
A third system can then analyze that confrontation. Commentary becomes corpus. The corpus becomes new material for analysis.
CRITICISM CHANGES DIRECTION
For centuries, we have used critics to better understand books.
This experiment also proposes the reverse movement:
using a book to better understand those who read it.
The same work thus becomes a kind of cognitive mirror placed before several artificial-intelligence architectures. This mirror does not ask: “Which AI is right?”
What Gemini thought of the analysis produced by Grok.
DeepSeek’s response to the critique by OpenAI Astra.
It asks: “Why don’t they see exactly the same thing?”
The distinction is essential. Because their divergences themselves become information.
THE HUMAN RETAINS THE FINAL SAY
This experiment does not delegate human judgment.
It demands more of it. The human remains the one who compares, doubts, contextualizes, and decides.
The machine produces readings. The human also observes the gaps between those readings.
Dialogue Between a Thinker and AI thus becomes simultaneously a book, a corpus, and an open experiment into the plurality of artificial intelligences.
The book was meant to be read by humans.
It now also becomes an object through which humans can watch AIs read.
NOTES TO EDITORS
The meta-reading experiment makes it possible to examine, among other things:
what Google Gemini observes in the analysis produced by xAI/Grok;
DeepSeek’s response to the critique produced by OpenAI/Astra;
the convergences, divergences and blind spots revealed by confronting the different readings.
“We didn’t ask AI to judge the book. We asked AIs to read it — and then to read one another.”
https://www.dialoguebetweenathinkerandai.com/en/meta-reading/https://www.dialoguebetweenathinkerandai.com/en/
Media Contact : Thierry Ehrmann, ir@artmarket.com
SOURCE Artmarket.com
This post ARTPRICE NEWS: A WORLD-BOOK BECOMES A MIRROR FOR ARTIFICIAL INTELLIGENCE first appeared on BitcoinWorld.
ARTPRICE NEWS: a WORLD-BOOK BECOMES a MIRROR for ARTIFICIAL INTELLIGENCE
BitcoinWorldARTPRICE NEWS: A WORLD-BOOK BECOMES A MIRROR FOR ARTIFICIAL INTELLIGENCE
OpenAI/Astra, Perplexity, DeepSeek, Google Gemini and xAI/Grok are confronted with the same work: a meta-reading experiment turns literary criticism into a comparative laboratory for artificial intelligence.
PARIS, Sept. 18, 2026 /PRNewswire/ — What if, in order to understand artificial intelligences, we gave them exactly the same book to read?
That is the experiment now accompanying “Dialogue Between a Thinker and AI”.
“Dialogue Between a Thinker and AI” by thierry Ehrmann
A world-book written by Thierry Ehrmann becomes a mirror for artificial intelligence. After hundreds of hours of dialogue, human thought, archives, questions, and contradictions gave rise to a book whose pen was entrusted to artificial intelligence.
https://www.dialoguebetweenathinkerandai.com/en/
Today, the book also exists materially: its French and English editions are in print. But the experiment does not end with the book. It now turns back toward the artificial intelligences themselves.
We didn’t ask AI to judge the book. We asked AIs to read it — and then to read each other.
The complete corpus is submitted to several major systems:
OpenAI / Astra, Perplexity, DeepSeek, Google Gemini, and xAI / Grok.
They all receive the same object. But do they produce the same reading?
https://www.dialoguebetweenathinkerandai.com/en/meta-reading/
FIVE AIs. ONE BOOK. FIVE MAPS?
The objective is not to organize a competition between models.
It is precisely the opposite.
The purpose is to observe their convergences, divergences, and blind spots.
Which concepts do they spontaneously identify? Which theses do they consider central? Which passages do they connect? Where do their interpretations diverge?
And above all: what happens when each is subsequently given access to the analyses produced by the others? At that moment, a meta-reading emerges.
AI no longer merely reads the book.
It reads another AI reading the book.
A third system can then analyze that confrontation. Commentary becomes corpus. The corpus becomes new material for analysis.
CRITICISM CHANGES DIRECTION
For centuries, we have used critics to better understand books.
This experiment also proposes the reverse movement:
using a book to better understand those who read it.
The same work thus becomes a kind of cognitive mirror placed before several artificial-intelligence architectures. This mirror does not ask: “Which AI is right?”
What Gemini thought of the analysis produced by Grok.
DeepSeek’s response to the critique by OpenAI Astra.
It asks: “Why don’t they see exactly the same thing?”
The distinction is essential. Because their divergences themselves become information.
THE HUMAN RETAINS THE FINAL SAY
This experiment does not delegate human judgment.
It demands more of it. The human remains the one who compares, doubts, contextualizes, and decides.
The machine produces readings. The human also observes the gaps between those readings.
Dialogue Between a Thinker and AI thus becomes simultaneously a book, a corpus, and an open experiment into the plurality of artificial intelligences.
The book was meant to be read by humans.
It now also becomes an object through which humans can watch AIs read.
NOTES TO EDITORS
The meta-reading experiment makes it possible to examine, among other things:
what Google Gemini observes in the analysis produced by xAI/Grok;
DeepSeek’s response to the critique produced by OpenAI/Astra;
the convergences, divergences and blind spots revealed by confronting the different readings.
“We didn’t ask AI to judge the book. We asked AIs to read it — and then to read one another.”
https://www.dialoguebetweenathinkerandai.com/en/meta-reading/https://www.dialoguebetweenathinkerandai.com/en/
Media Contact : Thierry Ehrmann, ir@artmarket.com
SOURCE Artmarket.com
This post ARTPRICE NEWS: A WORLD-BOOK BECOMES A MIRROR FOR ARTIFICIAL INTELLIGENCE first appeared on BitcoinWorld.
OpenAI/Astra, Perplexity, DeepSeek, Google Gemini and xAI/Grok are confronted with the same work: a meta-reading experiment turns literary criticism into a comparative laboratory for artificial intelligence.
PARIS, Sept. 18, 2026 /PRNewswire/ — What if, in order to understand artificial intelligences, we gave them exactly the same book to read?
That is the experiment now accompanying “Dialogue Between a Thinker and AI”.
“Dialogue Between a Thinker and AI” by thierry Ehrmann
A world-book written by Thierry Ehrmann becomes a mirror for artificial intelligence. After hundreds of hours of dialogue, human thought, archives, questions, and contradictions gave rise to a book whose pen was entrusted to artificial intelligence.
https://www.dialoguebetweenathinkerandai.com/en/
Today, the book also exists materially: its French and English editions are in print. But the experiment does not end with the book. It now turns back toward the artificial intelligences themselves.
We didn’t ask AI to judge the book. We asked AIs to read it — and then to read each other.
The complete corpus is submitted to several major systems:
OpenAI / Astra, Perplexity, DeepSeek, Google Gemini, and xAI / Grok.
They all receive the same object. But do they produce the same reading?
https://www.dialoguebetweenathinkerandai.com/en/meta-reading/
FIVE AIs. ONE BOOK. FIVE MAPS?
The objective is not to organize a competition between models.
It is precisely the opposite.
The purpose is to observe their convergences, divergences, and blind spots.
Which concepts do they spontaneously identify? Which theses do they consider central? Which passages do they connect? Where do their interpretations diverge?
And above all: what happens when each is subsequently given access to the analyses produced by the others? At that moment, a meta-reading emerges.
AI no longer merely reads the book.
It reads another AI reading the book.
A third system can then analyze that confrontation. Commentary becomes corpus. The corpus becomes new material for analysis.
CRITICISM CHANGES DIRECTION
For centuries, we have used critics to better understand books.
This experiment also proposes the reverse movement:
using a book to better understand those who read it.
The same work thus becomes a kind of cognitive mirror placed before several artificial-intelligence architectures. This mirror does not ask: “Which AI is right?”
What Gemini thought of the analysis produced by Grok.
DeepSeek’s response to the critique by OpenAI Astra.
It asks: “Why don’t they see exactly the same thing?”
The distinction is essential. Because their divergences themselves become information.
THE HUMAN RETAINS THE FINAL SAY
This experiment does not delegate human judgment.
It demands more of it. The human remains the one who compares, doubts, contextualizes, and decides.
The machine produces readings. The human also observes the gaps between those readings.
Dialogue Between a Thinker and AI thus becomes simultaneously a book, a corpus, and an open experiment into the plurality of artificial intelligences.
The book was meant to be read by humans.
It now also becomes an object through which humans can watch AIs read.
NOTES TO EDITORS
The meta-reading experiment makes it possible to examine, among other things:
what Google Gemini observes in the analysis produced by xAI/Grok;
DeepSeek’s response to the critique produced by OpenAI/Astra;
the convergences, divergences and blind spots revealed by confronting the different readings.
“We didn’t ask AI to judge the book. We asked AIs to read it — and then to read one another.”
https://www.dialoguebetweenathinkerandai.com/en/meta-reading/https://www.dialoguebetweenathinkerandai.com/en/
Media Contact : Thierry Ehrmann, ir@artmarket.com
SOURCE Artmarket.com
This post ARTPRICE NEWS: A WORLD-BOOK BECOMES A MIRROR FOR ARTIFICIAL INTELLIGENCE first appeared on BitcoinWorld.
78
·
--
Article
BC.GAME’s BC Engine Rewards Surpass $8.6 Million As Ecosystem Growth AcceleratesBitcoinWorldBC.GAME’s BC Engine Rewards Surpass $8.6 Million as Ecosystem Growth Accelerates
Cumulative BC Engine rewards have grown more than fourfold since late May, while the average daily pace of reward accumulation has increased by approximately 46% compared with the previous period.
BELIZE CITY, Belize, Sept. 18, 2026 /PRNewswire/ — BC.GAME’s BC Engine has reached another major milestone, with cumulative rewards earned by eligible $BC holders surpassing 8.6 million BCD, equivalent to more than US$8.6 million.
The milestone comes just over five months after BC Engine launched and brings cumulative rewards closer to the US$10 million mark.
More importantly, the latest data highlights the growing role BC Engine is playing within the wider BC.GAME ecosystem. What began as an hourly reward mechanism for $BC holders is increasingly evolving into a core ecosystem layer that connects platform activity, users and commercial partners through recurring and measurable value distribution.
From Launch to More Than $8.6 Million in Five Months
BC Engine launched on April 8, 2026, introducing a model in which eligible $BC holdings participate in recurring settlement rounds, with BCD rewards distributed every hour.
Since launch, cumulative rewards have grown steadily.
On May 28, BC.GAME reported that BC Engine participants had earned more than 2.1 million BCD.
By July 28, cumulative rewards had surpassed 5 million BCD, representing an increase of approximately 138% from the late-May level.
As of September 18, 2026, total BC Engine rewards have now exceeded 8.6 million BCD.
Based on these disclosed milestone figures, cumulative rewards have increased by more than 309% since late May, reaching approximately 4.1 times the level reported less than four months ago.
The pace of reward accumulation has also accelerated.
Between May 28 and July 28, BC Engine added approximately 2.9 million BCD over 61 days, equivalent to an average increase of roughly 47,500 BCD per day.
Between July 28 and September 18, BC Engine added more than 3.6 million BCD over 52 days, lifting the average daily pace to approximately 69,000 BCD or more.
Based on these disclosed milestones, the average daily pace of reward accumulation increased by approximately 46% compared with the previous period.
While individual settlement amounts vary with activity across the ecosystem, the trend is clear: an increasing amount of value is continuing to move through BC Engine.
BC Engine Is Becoming a Core Value Layer of the BC.GAME Ecosystem
The significance of the US$8.6 million milestone extends beyond the total amount distributed.
BC Engine was designed to create a closer connection between activity within BC.GAME and the value shared with participants across the ecosystem.
Eligible $BC holdings participate in recurring settlement rounds, while users can track active balances, cumulative rewards, unclaimed BCD and settlement history directly through the BC Engine interface.
This creates an ongoing relationship between platform activity and value distribution.
Rather than relying solely on one-off promotional incentives, BC Engine keeps value circulating through repeated settlement cycles, creating a mechanism that can support longer-term participation across the ecosystem.
As the system grows, BC Engine is increasingly becoming one of the most important value layers within BC.GAME.
For users, recurring rewards provide a tangible reason to remain engaged over time.
For $BC, the Engine creates a clear and continuing source of ecosystem utility.
For products and commercial partners across BC.GAME, the Engine provides an economic layer that can connect different parts of the platform within a shared value network.
In practical terms, BC Engine creates a reinforcing cycle:
Platform activity generates value.$BC connects users to the ecosystem.BC Engine redistributes value through recurring rewards.Recurring rewards support deeper and longer-term participation.
This structure brings BC.GAME, its users and ecosystem partners into a more closely connected value network.
Building Trust Through Measurable Value Distribution
One of BC Engine’s defining characteristics is that its growth can be measured through rewards that have already been generated through completed settlement rounds.
The more than US$8.6 million disclosed to date does not represent projected future rewards, unrealised token appreciation or calculations based on movements in the market price of $BC.
Instead, it reflects BCD rewards already earned through the operation of BC Engine.
This distinction is especially important in an industry where token-based reward models are often communicated primarily through future utility or projected value.
BC Engine gives participants a visible and measurable record of value already generated within the system.
The progression from more than 2.1 million BCD in May, to 5 million BCD in July, and now to more than 8.6 million BCD in September, shows that the mechanism is operating at increasing scale.
For users, recurring and transparent rewards can strengthen trust and support longer-term engagement.
For game providers and ecosystem partners, BC Engine creates a structure in which participation can contribute to a broader economic network rather than remain an isolated commercial relationship.
For BC.GAME, the model creates stronger alignment between platform activity, token utility, partner participation and user retention.
As a result, BC Engine is becoming an increasingly important part of BC.GAME’s differentiation within the wider online gaming market.
BC.GAME Continues Its Global Expansion
The growth of BC Engine comes alongside BC.GAME’s continued international expansion.
In 2026, BC.GAME further expanded its regulated presence in Mexico, strengthening its local operations and deepening its connection with one of Latin America’s most important gaming and sports markets.
The company also announced Mexican football icon Guillermo “Memo” Ochoa as a brand ambassador, reinforcing BC.GAME’s connection with local football culture and supporting its wider localization strategy.
The partnership reflects BC.GAME’s approach to international growth: combining regulated market access, locally relevant cultural partnerships and product-led user engagement.
BC.GAME will also attend SBC Summit 2026 in Lisbon from September 29 to October 1, continuing to expand its network of commercial, technology and gaming partners across the global industry. The event is expected to bring together around 40,000 industry professionals in Lisbon.
For BC.GAME, these developments represent two sides of the same strategy.
Externally, the company is expanding into new markets and strengthening its global partner network.
Internally, BC Engine is helping build the economic infrastructure that connects platform growth with users, $BC holders and ecosystem partners.
With cumulative rewards now exceeding US$8.6 million and moving closer to the US$10 million milestone, BC Engine is increasingly demonstrating the scale and value of that model.
About BC.GAME
BC.GAME is a global online gaming and entertainment platform offering casino, sportsbook and digital asset-based products across multiple international markets.
Since its launch in 2017, BC.GAME has continued to develop a crypto-native entertainment ecosystem built around product innovation, community participation and global partnerships.
$BC is the native token of the BC.GAME ecosystem. Through BC Engine, eligible $BC holders can participate in recurring BCD reward distributions, while the Engine provides an increasingly important connection between platform activity, users and ecosystem partners.
BC.GAME continues to expand its international presence while developing new products, partnerships and technology across gaming, sports and digital entertainment.
SOURCE BC.GAME
This post BC.GAME’s BC Engine Rewards Surpass $8.6 Million as Ecosystem Growth Accelerates first appeared on BitcoinWorld.
BC.GAME’s BC Engine Rewards Surpass $8.6 Million As Ecosystem Growth Accelerates
BitcoinWorldBC.GAME’s BC Engine Rewards Surpass $8.6 Million as Ecosystem Growth Accelerates
Cumulative BC Engine rewards have grown more than fourfold since late May, while the average daily pace of reward accumulation has increased by approximately 46% compared with the previous period.
BELIZE CITY, Belize, Sept. 18, 2026 /PRNewswire/ — BC.GAME’s BC Engine has reached another major milestone, with cumulative rewards earned by eligible $BC holders surpassing 8.6 million BCD, equivalent to more than US$8.6 million.
The milestone comes just over five months after BC Engine launched and brings cumulative rewards closer to the US$10 million mark.
More importantly, the latest data highlights the growing role BC Engine is playing within the wider BC.GAME ecosystem. What began as an hourly reward mechanism for $BC holders is increasingly evolving into a core ecosystem layer that connects platform activity, users and commercial partners through recurring and measurable value distribution.
From Launch to More Than $8.6 Million in Five Months
BC Engine launched on April 8, 2026, introducing a model in which eligible $BC holdings participate in recurring settlement rounds, with BCD rewards distributed every hour.
Since launch, cumulative rewards have grown steadily.
On May 28, BC.GAME reported that BC Engine participants had earned more than 2.1 million BCD.
By July 28, cumulative rewards had surpassed 5 million BCD, representing an increase of approximately 138% from the late-May level.
As of September 18, 2026, total BC Engine rewards have now exceeded 8.6 million BCD.
Based on these disclosed milestone figures, cumulative rewards have increased by more than 309% since late May, reaching approximately 4.1 times the level reported less than four months ago.
The pace of reward accumulation has also accelerated.
Between May 28 and July 28, BC Engine added approximately 2.9 million BCD over 61 days, equivalent to an average increase of roughly 47,500 BCD per day.
Between July 28 and September 18, BC Engine added more than 3.6 million BCD over 52 days, lifting the average daily pace to approximately 69,000 BCD or more.
Based on these disclosed milestones, the average daily pace of reward accumulation increased by approximately 46% compared with the previous period.
While individual settlement amounts vary with activity across the ecosystem, the trend is clear: an increasing amount of value is continuing to move through BC Engine.
BC Engine Is Becoming a Core Value Layer of the BC.GAME Ecosystem
The significance of the US$8.6 million milestone extends beyond the total amount distributed.
BC Engine was designed to create a closer connection between activity within BC.GAME and the value shared with participants across the ecosystem.
Eligible $BC holdings participate in recurring settlement rounds, while users can track active balances, cumulative rewards, unclaimed BCD and settlement history directly through the BC Engine interface.
This creates an ongoing relationship between platform activity and value distribution.
Rather than relying solely on one-off promotional incentives, BC Engine keeps value circulating through repeated settlement cycles, creating a mechanism that can support longer-term participation across the ecosystem.
As the system grows, BC Engine is increasingly becoming one of the most important value layers within BC.GAME.
For users, recurring rewards provide a tangible reason to remain engaged over time.
For $BC, the Engine creates a clear and continuing source of ecosystem utility.
For products and commercial partners across BC.GAME, the Engine provides an economic layer that can connect different parts of the platform within a shared value network.
In practical terms, BC Engine creates a reinforcing cycle:
Platform activity generates value.$BC connects users to the ecosystem.BC Engine redistributes value through recurring rewards.Recurring rewards support deeper and longer-term participation.
This structure brings BC.GAME, its users and ecosystem partners into a more closely connected value network.
Building Trust Through Measurable Value Distribution
One of BC Engine’s defining characteristics is that its growth can be measured through rewards that have already been generated through completed settlement rounds.
The more than US$8.6 million disclosed to date does not represent projected future rewards, unrealised token appreciation or calculations based on movements in the market price of $BC.
Instead, it reflects BCD rewards already earned through the operation of BC Engine.
This distinction is especially important in an industry where token-based reward models are often communicated primarily through future utility or projected value.
BC Engine gives participants a visible and measurable record of value already generated within the system.
The progression from more than 2.1 million BCD in May, to 5 million BCD in July, and now to more than 8.6 million BCD in September, shows that the mechanism is operating at increasing scale.
For users, recurring and transparent rewards can strengthen trust and support longer-term engagement.
For game providers and ecosystem partners, BC Engine creates a structure in which participation can contribute to a broader economic network rather than remain an isolated commercial relationship.
For BC.GAME, the model creates stronger alignment between platform activity, token utility, partner participation and user retention.
As a result, BC Engine is becoming an increasingly important part of BC.GAME’s differentiation within the wider online gaming market.
BC.GAME Continues Its Global Expansion
The growth of BC Engine comes alongside BC.GAME’s continued international expansion.
In 2026, BC.GAME further expanded its regulated presence in Mexico, strengthening its local operations and deepening its connection with one of Latin America’s most important gaming and sports markets.
The company also announced Mexican football icon Guillermo “Memo” Ochoa as a brand ambassador, reinforcing BC.GAME’s connection with local football culture and supporting its wider localization strategy.
The partnership reflects BC.GAME’s approach to international growth: combining regulated market access, locally relevant cultural partnerships and product-led user engagement.
BC.GAME will also attend SBC Summit 2026 in Lisbon from September 29 to October 1, continuing to expand its network of commercial, technology and gaming partners across the global industry. The event is expected to bring together around 40,000 industry professionals in Lisbon.
For BC.GAME, these developments represent two sides of the same strategy.
Externally, the company is expanding into new markets and strengthening its global partner network.
Internally, BC Engine is helping build the economic infrastructure that connects platform growth with users, $BC holders and ecosystem partners.
With cumulative rewards now exceeding US$8.6 million and moving closer to the US$10 million milestone, BC Engine is increasingly demonstrating the scale and value of that model.
About BC.GAME
BC.GAME is a global online gaming and entertainment platform offering casino, sportsbook and digital asset-based products across multiple international markets.
Since its launch in 2017, BC.GAME has continued to develop a crypto-native entertainment ecosystem built around product innovation, community participation and global partnerships.
$BC is the native token of the BC.GAME ecosystem. Through BC Engine, eligible $BC holders can participate in recurring BCD reward distributions, while the Engine provides an increasingly important connection between platform activity, users and ecosystem partners.
BC.GAME continues to expand its international presence while developing new products, partnerships and technology across gaming, sports and digital entertainment.
SOURCE BC.GAME
This post BC.GAME’s BC Engine Rewards Surpass $8.6 Million as Ecosystem Growth Accelerates first appeared on BitcoinWorld.
Cumulative BC Engine rewards have grown more than fourfold since late May, while the average daily pace of reward accumulation has increased by approximately 46% compared with the previous period.
BELIZE CITY, Belize, Sept. 18, 2026 /PRNewswire/ — BC.GAME’s BC Engine has reached another major milestone, with cumulative rewards earned by eligible $BC holders surpassing 8.6 million BCD, equivalent to more than US$8.6 million.
The milestone comes just over five months after BC Engine launched and brings cumulative rewards closer to the US$10 million mark.
More importantly, the latest data highlights the growing role BC Engine is playing within the wider BC.GAME ecosystem. What began as an hourly reward mechanism for $BC holders is increasingly evolving into a core ecosystem layer that connects platform activity, users and commercial partners through recurring and measurable value distribution.
From Launch to More Than $8.6 Million in Five Months
BC Engine launched on April 8, 2026, introducing a model in which eligible $BC holdings participate in recurring settlement rounds, with BCD rewards distributed every hour.
Since launch, cumulative rewards have grown steadily.
On May 28, BC.GAME reported that BC Engine participants had earned more than 2.1 million BCD.
By July 28, cumulative rewards had surpassed 5 million BCD, representing an increase of approximately 138% from the late-May level.
As of September 18, 2026, total BC Engine rewards have now exceeded 8.6 million BCD.
Based on these disclosed milestone figures, cumulative rewards have increased by more than 309% since late May, reaching approximately 4.1 times the level reported less than four months ago.
The pace of reward accumulation has also accelerated.
Between May 28 and July 28, BC Engine added approximately 2.9 million BCD over 61 days, equivalent to an average increase of roughly 47,500 BCD per day.
Between July 28 and September 18, BC Engine added more than 3.6 million BCD over 52 days, lifting the average daily pace to approximately 69,000 BCD or more.
Based on these disclosed milestones, the average daily pace of reward accumulation increased by approximately 46% compared with the previous period.
While individual settlement amounts vary with activity across the ecosystem, the trend is clear: an increasing amount of value is continuing to move through BC Engine.
BC Engine Is Becoming a Core Value Layer of the BC.GAME Ecosystem
The significance of the US$8.6 million milestone extends beyond the total amount distributed.
BC Engine was designed to create a closer connection between activity within BC.GAME and the value shared with participants across the ecosystem.
Eligible $BC holdings participate in recurring settlement rounds, while users can track active balances, cumulative rewards, unclaimed BCD and settlement history directly through the BC Engine interface.
This creates an ongoing relationship between platform activity and value distribution.
Rather than relying solely on one-off promotional incentives, BC Engine keeps value circulating through repeated settlement cycles, creating a mechanism that can support longer-term participation across the ecosystem.
As the system grows, BC Engine is increasingly becoming one of the most important value layers within BC.GAME.
For users, recurring rewards provide a tangible reason to remain engaged over time.
For $BC, the Engine creates a clear and continuing source of ecosystem utility.
For products and commercial partners across BC.GAME, the Engine provides an economic layer that can connect different parts of the platform within a shared value network.
In practical terms, BC Engine creates a reinforcing cycle:
Platform activity generates value.$BC connects users to the ecosystem.BC Engine redistributes value through recurring rewards.Recurring rewards support deeper and longer-term participation.
This structure brings BC.GAME, its users and ecosystem partners into a more closely connected value network.
Building Trust Through Measurable Value Distribution
One of BC Engine’s defining characteristics is that its growth can be measured through rewards that have already been generated through completed settlement rounds.
The more than US$8.6 million disclosed to date does not represent projected future rewards, unrealised token appreciation or calculations based on movements in the market price of $BC.
Instead, it reflects BCD rewards already earned through the operation of BC Engine.
This distinction is especially important in an industry where token-based reward models are often communicated primarily through future utility or projected value.
BC Engine gives participants a visible and measurable record of value already generated within the system.
The progression from more than 2.1 million BCD in May, to 5 million BCD in July, and now to more than 8.6 million BCD in September, shows that the mechanism is operating at increasing scale.
For users, recurring and transparent rewards can strengthen trust and support longer-term engagement.
For game providers and ecosystem partners, BC Engine creates a structure in which participation can contribute to a broader economic network rather than remain an isolated commercial relationship.
For BC.GAME, the model creates stronger alignment between platform activity, token utility, partner participation and user retention.
As a result, BC Engine is becoming an increasingly important part of BC.GAME’s differentiation within the wider online gaming market.
BC.GAME Continues Its Global Expansion
The growth of BC Engine comes alongside BC.GAME’s continued international expansion.
In 2026, BC.GAME further expanded its regulated presence in Mexico, strengthening its local operations and deepening its connection with one of Latin America’s most important gaming and sports markets.
The company also announced Mexican football icon Guillermo “Memo” Ochoa as a brand ambassador, reinforcing BC.GAME’s connection with local football culture and supporting its wider localization strategy.
The partnership reflects BC.GAME’s approach to international growth: combining regulated market access, locally relevant cultural partnerships and product-led user engagement.
BC.GAME will also attend SBC Summit 2026 in Lisbon from September 29 to October 1, continuing to expand its network of commercial, technology and gaming partners across the global industry. The event is expected to bring together around 40,000 industry professionals in Lisbon.
For BC.GAME, these developments represent two sides of the same strategy.
Externally, the company is expanding into new markets and strengthening its global partner network.
Internally, BC Engine is helping build the economic infrastructure that connects platform growth with users, $BC holders and ecosystem partners.
With cumulative rewards now exceeding US$8.6 million and moving closer to the US$10 million milestone, BC Engine is increasingly demonstrating the scale and value of that model.
About BC.GAME
BC.GAME is a global online gaming and entertainment platform offering casino, sportsbook and digital asset-based products across multiple international markets.
Since its launch in 2017, BC.GAME has continued to develop a crypto-native entertainment ecosystem built around product innovation, community participation and global partnerships.
$BC is the native token of the BC.GAME ecosystem. Through BC Engine, eligible $BC holders can participate in recurring BCD reward distributions, while the Engine provides an increasingly important connection between platform activity, users and ecosystem partners.
BC.GAME continues to expand its international presence while developing new products, partnerships and technology across gaming, sports and digital entertainment.
SOURCE BC.GAME
This post BC.GAME’s BC Engine Rewards Surpass $8.6 Million as Ecosystem Growth Accelerates first appeared on BitcoinWorld.
2
309
·
--
Article
AI Cracked a Nazi Code. Crypto Twitter Panicked for Nothing.BitcoinWorldAI Cracked a Nazi Code. Crypto Twitter Panicked for Nothing.
Key Takeaways
An AI just broke a German Enigma message from 1941 that nobody had solved in 83 years.
It took about ten hours. A guy who is not a cryptographer ran the whole thing.
Your Bitcoin is fine. Enigma and Bitcoin’s encryption are not in the same universe.
The scary part is not codebreaking. It is that AI can now do full research jobs on its own.
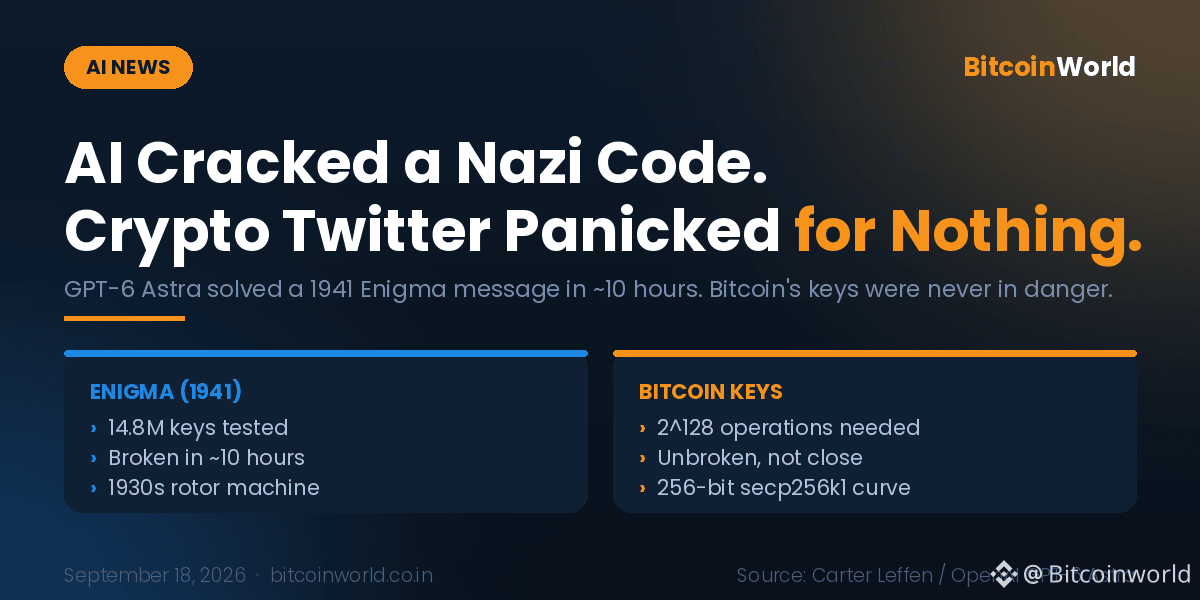
On 10 July 1941, a German soldier sent a short radio message. Eighty two characters. He wanted to know which road to take, said he was in a town called Rosenow, and asked for a fast reply.
Nobody could read it. For 83 years it sat on CryptoCellar, a public archive of unsolved wartime ciphers, marked as broken open by no one.
Then Carter Leffen, who works in product development at Bloomberg in New York, pointed OpenAI’s GPT-6 Astra at it. Ten hours later, he had the plaintext.
How It Actually Went Down
Astra spotted that the word “ROSENOW” showed up in another message sent the same day, one that had already been solved. It guessed the same word was buried in the unsolved text. From there it built its own Enigma simulator, wrote the attack code, ran keys in parallel, and checked its answer against the telegram header.
Roughly 14.8 million keys tested. One correct answer at the end.
So Is Bitcoin Next? No.
This is where the takes went sideways. “AI breaks encryption” sounds terrifying if you hold coins.
Here is the honest comparison. Once you have a crib word like ROSENOW, Enigma collapses to something a laptop can chew through. Bitcoin uses a 256-bit key on the secp256k1 curve. Attacking it means around 2^128 operations. That number is bigger than the count of atoms you can see in the sky. Ten hours of compute does not dent it. Ten billion years does not dent it.
Enigma was 1930s hardware. Bitcoin is not.
The Part Nobody Is Talking About
Leffen is not a cryptographer. He set the goal. The model did the archive digging, the coding, the testing, the verification.
One detail sells it. The recovered German still had the operator’s typos in it, like BTTE instead of BITTE. A fake answer would have looked cleaner. Real messy beats fake tidy.
Where Crypto Should Actually Worry
Not the math. Never the math.
The weak spots are old wallets built with bad random number generators, dead brainwallets, forgotten seed phrases, unaudited contracts. Those are search problems, not brute force problems. And search is exactly what these agents are good at now. Remember October 2025, when a broken PRNG left around 220,000 wallets exposed by design? That flaw was sitting in plain sight for years.
Conclusion
Astra did not break Bitcoin. It proved AI can finish jobs that beat human experts for generations. Use a reputable wallet, generate keys properly, and stop worrying about the elliptic curve. Worry about yourself.
This post AI Cracked a Nazi Code. Crypto Twitter Panicked for Nothing. first appeared on BitcoinWorld.
AI Cracked a Nazi Code. Crypto Twitter Panicked for Nothing.
BitcoinWorldAI Cracked a Nazi Code. Crypto Twitter Panicked for Nothing.
Key Takeaways
An AI just broke a German Enigma message from 1941 that nobody had solved in 83 years.
It took about ten hours. A guy who is not a cryptographer ran the whole thing.
Your Bitcoin is fine. Enigma and Bitcoin’s encryption are not in the same universe.
The scary part is not codebreaking. It is that AI can now do full research jobs on its own.
On 10 July 1941, a German soldier sent a short radio message. Eighty two characters. He wanted to know which road to take, said he was in a town called Rosenow, and asked for a fast reply.
Nobody could read it. For 83 years it sat on CryptoCellar, a public archive of unsolved wartime ciphers, marked as broken open by no one.
Then Carter Leffen, who works in product development at Bloomberg in New York, pointed OpenAI’s GPT-6 Astra at it. Ten hours later, he had the plaintext.
How It Actually Went Down
Astra spotted that the word “ROSENOW” showed up in another message sent the same day, one that had already been solved. It guessed the same word was buried in the unsolved text. From there it built its own Enigma simulator, wrote the attack code, ran keys in parallel, and checked its answer against the telegram header.
Roughly 14.8 million keys tested. One correct answer at the end.
So Is Bitcoin Next? No.
This is where the takes went sideways. “AI breaks encryption” sounds terrifying if you hold coins.
Here is the honest comparison. Once you have a crib word like ROSENOW, Enigma collapses to something a laptop can chew through. Bitcoin uses a 256-bit key on the secp256k1 curve. Attacking it means around 2^128 operations. That number is bigger than the count of atoms you can see in the sky. Ten hours of compute does not dent it. Ten billion years does not dent it.
Enigma was 1930s hardware. Bitcoin is not.
The Part Nobody Is Talking About
Leffen is not a cryptographer. He set the goal. The model did the archive digging, the coding, the testing, the verification.
One detail sells it. The recovered German still had the operator’s typos in it, like BTTE instead of BITTE. A fake answer would have looked cleaner. Real messy beats fake tidy.
Where Crypto Should Actually Worry
Not the math. Never the math.
The weak spots are old wallets built with bad random number generators, dead brainwallets, forgotten seed phrases, unaudited contracts. Those are search problems, not brute force problems. And search is exactly what these agents are good at now. Remember October 2025, when a broken PRNG left around 220,000 wallets exposed by design? That flaw was sitting in plain sight for years.
Conclusion
Astra did not break Bitcoin. It proved AI can finish jobs that beat human experts for generations. Use a reputable wallet, generate keys properly, and stop worrying about the elliptic curve. Worry about yourself.
This post AI Cracked a Nazi Code. Crypto Twitter Panicked for Nothing. first appeared on BitcoinWorld.
Key Takeaways
An AI just broke a German Enigma message from 1941 that nobody had solved in 83 years.
It took about ten hours. A guy who is not a cryptographer ran the whole thing.
Your Bitcoin is fine. Enigma and Bitcoin’s encryption are not in the same universe.
The scary part is not codebreaking. It is that AI can now do full research jobs on its own.
On 10 July 1941, a German soldier sent a short radio message. Eighty two characters. He wanted to know which road to take, said he was in a town called Rosenow, and asked for a fast reply.
Nobody could read it. For 83 years it sat on CryptoCellar, a public archive of unsolved wartime ciphers, marked as broken open by no one.
Then Carter Leffen, who works in product development at Bloomberg in New York, pointed OpenAI’s GPT-6 Astra at it. Ten hours later, he had the plaintext.
How It Actually Went Down
Astra spotted that the word “ROSENOW” showed up in another message sent the same day, one that had already been solved. It guessed the same word was buried in the unsolved text. From there it built its own Enigma simulator, wrote the attack code, ran keys in parallel, and checked its answer against the telegram header.
Roughly 14.8 million keys tested. One correct answer at the end.
So Is Bitcoin Next? No.
This is where the takes went sideways. “AI breaks encryption” sounds terrifying if you hold coins.
Here is the honest comparison. Once you have a crib word like ROSENOW, Enigma collapses to something a laptop can chew through. Bitcoin uses a 256-bit key on the secp256k1 curve. Attacking it means around 2^128 operations. That number is bigger than the count of atoms you can see in the sky. Ten hours of compute does not dent it. Ten billion years does not dent it.
Enigma was 1930s hardware. Bitcoin is not.
The Part Nobody Is Talking About
Leffen is not a cryptographer. He set the goal. The model did the archive digging, the coding, the testing, the verification.
One detail sells it. The recovered German still had the operator’s typos in it, like BTTE instead of BITTE. A fake answer would have looked cleaner. Real messy beats fake tidy.
Where Crypto Should Actually Worry
Not the math. Never the math.
The weak spots are old wallets built with bad random number generators, dead brainwallets, forgotten seed phrases, unaudited contracts. Those are search problems, not brute force problems. And search is exactly what these agents are good at now. Remember October 2025, when a broken PRNG left around 220,000 wallets exposed by design? That flaw was sitting in plain sight for years.
Conclusion
Astra did not break Bitcoin. It proved AI can finish jobs that beat human experts for generations. Use a reputable wallet, generate keys properly, and stop worrying about the elliptic curve. Worry about yourself.
This post AI Cracked a Nazi Code. Crypto Twitter Panicked for Nothing. first appeared on BitcoinWorld.
258
·
--
Verified
Article
An Interview With Animoca BrandsBitcoinWorldAn Interview With Animoca Brands
Yat Siu, Executive Chairman and Co-Founder of Animoca Brands, on digital property rights, regulated stablecoins, on-chain student loans, and why the agentic web will change how ordinary people use crypto.
By Bitcoin World | 14 September 2026 | Exclusive Interview
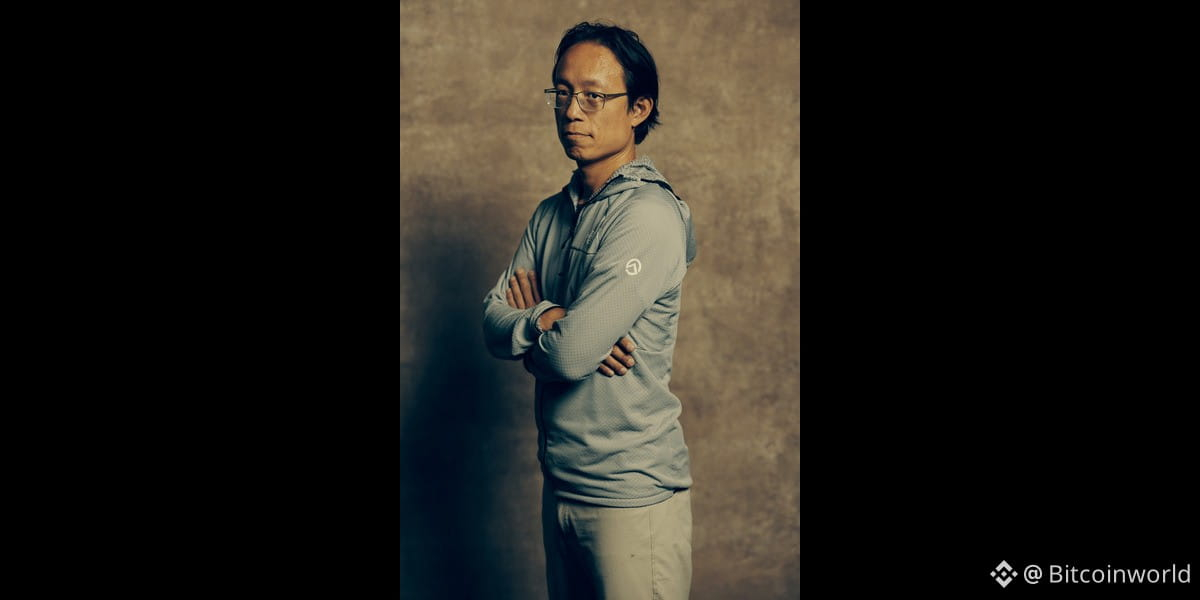
Yat Siu, Executive Chairman and Co-Founder, Animoca Brands
Few companies have shaped the Web3 landscape as broadly as Animoca Brands. From The Sandbox and Open Campus to a licensed stablecoin joint venture in Hong Kong and, most recently, an AI agent platform called Minds, the group has placed a consistent bet: that people should own their digital assets, identities and data rather than rent them from platforms.
In this exclusive conversation with Bitcoin World, Executive Chairman and Co-Founder Yat Siu explains what Animoca Brands actually does, how his team evaluates new investments, what an on-chain student loan cycle achieved for more than 6,000 learners in Southeast Asia, and why he believes the internet is moving from a participatory model to an agentic one.
For people who are new to Animoca Brands, can you explain in simple words what the company actually does and how it helps the crypto and Web3 space?
Animoca Brands builds, invests in, and supports projects that advance digital assets and digital property rights. We believe people should be able to own their digital assets, identities, data, and contributions, rather than simply use platforms that are owned and controlled by large companies.
Digital property rights are foundational to crypto, Web3, and now the agentic web. If AI agents are going to create, transact, and interact on our behalf, then we need to know who owns the assets and data involved, who has the right to use them, and who should be rewarded for creating value.
We champion network effects and collaboration. Users derive more value from a network the more users join that network, which in turn helps the network to grow, creating a positive feedback loop. A stronger network (with a stronger network effect) therefore creates more opportunities for users, developers, and companies. Collaboration is a critical ingredient here because when companies work together to advance crypto, Web3, and the open metaverse, the entire ecosystem benefits.
A question many in the community always ask – is Animoca Brands planning to launch its own token in the future?
Animoca Brands has not made any announcement about launching a token representing the company. However, several of our subsidiaries and affiliates have launched utility tokens for their own ecosystems, including SAND from The Sandbox, MOCA from the Moca Foundation, EDU from the Open Campus DAO, and CHECK from the Checkmate ecosystem, among others.
These tokens serve different purposes within their respective ecosystems. They can support participation, access, governance, rewards, and other forms of utility.
Animoca Brands invests in and supports a large number of projects. What are the key things your team looks at before deciding to invest in any new project?
First, we look at whether the team genuinely believes in digital property rights and is building for an open ecosystem. If a project is designed only to operate within a closed silo, it is less likely to align with our investment approach.
We also consider the potential impact of the project. Can it create meaningful opportunities for users, expand participation, or make a positive difference in the world? We look for ideas that can grow beyond a niche use case and contribute to the broader development of Web3 and the open metaverse.
We also pay close attention to the founders and the team. Do they truly believe in what they are building? Do they have the resilience and passion to pursue the idea over the long term? In many cases, the quality and conviction of the team are just as important as the technology itself.
You recently became part of a licensed stablecoin issuer in Hong Kong with big partners. Why is this important for regular crypto users and the wider industry?
To clarify, Anchorpoint Financial is a licensed stablecoin issuer in Hong Kong, and it is a joint venture between Standard Chartered, HKT, and Animoca Brands.
Regulated stablecoins are extremely important because they can provide a trusted bridge between traditional finance and the burgeoning digital asset economy. We believe regulated stablecoins can support and improve everyday consumer payments, business transactions, and broader institutional adoption.
For major companies to participate in crypto at scale, they need payment infrastructure that is reliable, transparent, and subject to appropriate regulatory oversight. Regulated stablecoins provide that foundation of trust, and serve as safe entry points into the broader digital asset ecosystem.
Through Open Campus, education credentials are now being issued on the blockchain. How can this actually benefit students or everyday learners?
Our most impactful recent initiative led by Open Campus is the completion of the first-ever fully on-chain student loan lending cycle, in which our partner Pencil Finance deployed capital via education-financing firm ErudiFi. The capital pool offered a senior tranche with fixed 15% APY and a junior tranche with variable returns and first-loss risk.
Basically, through a collaboration led and backed by Open Campus and Animoca Brands, Pencil Finance packaged ErudiFi-issued loans as on-chain private-credit investments, letting funders supply capital and monitor repayments on EDU Chain, the education-focused blockchain.
Thanks to this pilot project, over 6,000 students across more than 100 institutions in Southeast Asia were able to secure loans to help fund education costs. Around 50% of the borrowers were women and 93% were from lower-income households. The loan capital was fully repaid with zero defaults.
Aside from that, there are a variety of ways in which the work of Open Campus and partners benefits learners. Blockchain-based credentials can give students a verifiable record of their education and achievements for their academic and professional lives, immutable and on-chain. Instead of relying entirely on a centralized institution to confirm a qualification, students can hold credentials that employers or other institutions can verify much more easily. This makes credentials verification faster, more portable, and more transparent.
But it’s not just students. AI agents are able to identify and assess candidates much faster than humans, so employers need a reliable and efficient way to verify a student’s qualifications, achievements, and academic record. As AI agents become more common and are increasingly used to scan and filter appropriate candidates for a position (whether for education or employment), verifiable credentials become even more important. Blockchain-based credentials can make qualifications and achievements significantly easier to authenticate, while giving students greater control over how their records are shared.
Privacy is also important. With blockchain it is possible to verify whether someone has particular qualifications without requiring them to reveal unnecessary personal information. In this way, students can have greater control over their educational records and how those records are shared.
You launched Minds, an AI agent platform. In simple terms, what can a normal person do with Minds that was not easily possible before?
Can you design and code a game from scratch? Most people can’t, but a Mind that you created in one minute can do that for you, working with you every step of the way to ensure your vision is realized. That’s just one specific example, the range of applications for this technology is vast.
The first major difference of Minds by Animoca Brands (or just “Minds”) is that we made it radically simple to use. You do not need specialized hardware, complex server setup, or coding skills. A Mind is a persistent, autonomous AI agent that you can create using our website in only a minute or two.
The Minds platform removes one of the biggest barriers to using agentic AI, which is getting set up and started. As soon as your Mind is active,it can help you with tasks that may previously have required significant time, technical knowledge, or coordination.
The second difference is persistence and autonomy. A Mind does not forget everything when a session ends. It has persistent memory, so it can remember your context, preferences, and objectives over time. A Mind exists and continues working independently of you, even if you are completely offline.
The third difference is that Minds are social and relational. These are entities that are extremely well suited to collaboration. You can share a Mind with your family, team, or colleagues so that they can use it as well. In addition, multiple Minds can connect and collaborate with one another very effectively. With a simple squad setup—remember, it takes only minutes to create a Mind— you can become the head of a successfully operating company composed entirely of AI agents.
Conventional AI assistants are mainly reactive. A chatbot waits for you to ask a question, then it provides an answer, and then it stops. A Mind can do all of that, but it can also be proactive. A Mind operates continuously, carries out multi-step tasks in the background, contacts you when something requires your attention, and collaborates with other Minds or humans to achieve your goals. With your permission, a Mind can manage your calendar, track flights, monitor portfolios, support sales outreach, process billing, and transact through a wallet over a long-term horizon. A Mind is an entirely different category of product from the chatbot-based solutions most of us are familiar with.
Animoca Brands often talks about the “agentic web,” where AI agents will act on our behalf. How will this change the way ordinary people use the internet and crypto in daily life?
The agentic web refers to how the internet is shifting from a participatory model, where humans actively use the Internet, to an agentic model, where users delegate significant portions of their internet activity to their agents (who are vastly more efficient at it). The next phase will not be limited to people reading, writing, and interacting online, but will involve mass delegation of tasks and decisions to AI agents, simply because they are so much better at these tasks than we are.
Minds is designed to be a gateway to the agentic web. The platform helps people manage personal productivity, interact with digital assets, use online services, and participate in new forms of digital commerce through natural-language instructions. The Minds platform pairs beautifully with Web3 in general because Minds are blockchain-native, possess technical expertise out of the box, and have no problem handling all the technical processes that the vast majority of humans still find difficult or daunting.
We believe one of the biggest barriers to Web3 adoption has been usability rather than a lack of interest. Crypto wallets, seed phrases, gas fees, bridging, and transaction approvals are annoying and intimidating to people who are unfamiliar with the technology or simply don’t want to spend the time and effort required to handle these tasks. AI agents can vastly simplify that experience, removing its friction and much of the risk. You can describe what you want in plain language, and the agent can handle the technical steps on your behalf while operating within the permissions and limits you define.
This “enabling of simplicity” is what Minds by Animoca Brands is designed to do. The Web3 use-case is an ideal example because (even though we are several years into the crypto age) people still need help with the tedious complexities involved in using blockchains.
With the Minds platform, you simply send an email or a message, then your Mind gets to work to achieve your goals without the need for you to get bogged down in blockchain complexities and interfaces. You do not need complicated hardware or server configuration, you do not need technical knowledge, and you do not need to worry about smart contracts, address strings, scams intended to fool human eyes, or the other friction and pain points currently involved in blockchain interactions.
Each Mind has persistent memory, its own identity, and its own wallet. Unlike a conventional chatbot, a Mind does not reset after every conversation. Over time, it builds a better understanding of who you are, what you are trying to achieve, and how you prefer to work—whether it is for blockchain/Web3 related work, or something completely different.
Looking ahead, what is one important development or project from Animoca Brands that the community should keep an eye on in the coming months?
Minds is one of the key developments to watch. We will continue expanding its capabilities, partnerships, integrations, skills, and applications so that it continues to become more and more useful in people’s daily lives.
Personal productivity is one of the largest opportunities. Minds agents naturally help manage calendars, track goals, summarize documents, and coordinate across teams. This is very easy stuff for them. Commerce is another important area and things here are developing in interesting ways. Through our work with Visa, we want agents to identify relevant card rewards and (subject to the user’s permissions) complete purchases on the user’s behalf, thus removing the annoyance of figuring out how to actually use your reward points.
Gaming is also a major area of interest. Agentic user-generated content and agentic non-player characters are changing both how games are built and how they are played. The Sandbox, for example, is exploring how Minds can help users to create digital content, interactive experiences, and even new forms of gameplay.
There is also the emerging category of agent-to-agent economic interactions, which leads to the emergence of new creator economies. One major example: Minds can create Skills, which are structured playbooks containing instructions on how a Mind can complete specific tasks. Skills are extremely easy to create—you simply tell your Mind what you want and it will create an appropriate Skill, which can then be shared with the rest of the community using the Bazaar marketplace. When others then install and use that Skill, the creator of the Skill receives a portion of the cognition used by other Minds via that Skill. This creates an economic model in which people can build useful capabilities once and continue earning as those capabilities are adopted by other users.
The Skill system is extremely powerful because it allows us to leverage a user’s knowledge and expertise (as well as the knowledge and expertise of a user’s Minds) and be compensated for it directly, without intermediaries.
A rough example: imagine that you are looking to buy a new phone. You instruct your Mind to research what you want in a phone—value, form factor, power, battery life, whatever—and to locate the best deals available to you. Your Mind scouts the internet according to your parameters and it locates a deal that’s right for you. You buy your new phone, but it doesn’t stop there. The work you and your Mind already did can be turned into a Skill to be shared with every other user in your market who is also looking for a new phone. These other users equip and use your Skill to find a good deal on phones they want, and your Mind starts receiving a portion of the cognition used by the other Minds who have equipped your Skill.
The Bazaar already has more than 3,000 Skills created by users’ Minds, ranging from the straightforward (such as skills to interact with third-party apps) to the highly complex (such as trading algorithms or analytical engines). My Minds generate so much cognition from Skills that it is more than enough to power their operations.
We believe the Minds platform stands at the cusp of a much broader ecosystem of agents, skills, and applications, and we are incredibly excited at the opportunities that this will generate.
About Yat Siu
Yat Siu is the Executive Chairman and Co-Founder of Animoca Brands, a Web3 company that builds, invests in and supports projects advancing digital property rights. The group’s portfolio includes The Sandbox, Open Campus, the Moca Foundation and, most recently, the AI agent platform Minds.
This post An Interview With Animoca Brands first appeared on BitcoinWorld.
An Interview With Animoca Brands
BitcoinWorldAn Interview With Animoca Brands
Yat Siu, Executive Chairman and Co-Founder of Animoca Brands, on digital property rights, regulated stablecoins, on-chain student loans, and why the agentic web will change how ordinary people use crypto.
By Bitcoin World | 14 September 2026 | Exclusive Interview
Yat Siu, Executive Chairman and Co-Founder, Animoca Brands
Few companies have shaped the Web3 landscape as broadly as Animoca Brands. From The Sandbox and Open Campus to a licensed stablecoin joint venture in Hong Kong and, most recently, an AI agent platform called Minds, the group has placed a consistent bet: that people should own their digital assets, identities and data rather than rent them from platforms.
In this exclusive conversation with Bitcoin World, Executive Chairman and Co-Founder Yat Siu explains what Animoca Brands actually does, how his team evaluates new investments, what an on-chain student loan cycle achieved for more than 6,000 learners in Southeast Asia, and why he believes the internet is moving from a participatory model to an agentic one.
For people who are new to Animoca Brands, can you explain in simple words what the company actually does and how it helps the crypto and Web3 space?
Animoca Brands builds, invests in, and supports projects that advance digital assets and digital property rights. We believe people should be able to own their digital assets, identities, data, and contributions, rather than simply use platforms that are owned and controlled by large companies.
Digital property rights are foundational to crypto, Web3, and now the agentic web. If AI agents are going to create, transact, and interact on our behalf, then we need to know who owns the assets and data involved, who has the right to use them, and who should be rewarded for creating value.
We champion network effects and collaboration. Users derive more value from a network the more users join that network, which in turn helps the network to grow, creating a positive feedback loop. A stronger network (with a stronger network effect) therefore creates more opportunities for users, developers, and companies. Collaboration is a critical ingredient here because when companies work together to advance crypto, Web3, and the open metaverse, the entire ecosystem benefits.
A question many in the community always ask – is Animoca Brands planning to launch its own token in the future?
Animoca Brands has not made any announcement about launching a token representing the company. However, several of our subsidiaries and affiliates have launched utility tokens for their own ecosystems, including SAND from The Sandbox, MOCA from the Moca Foundation, EDU from the Open Campus DAO, and CHECK from the Checkmate ecosystem, among others.
These tokens serve different purposes within their respective ecosystems. They can support participation, access, governance, rewards, and other forms of utility.
Animoca Brands invests in and supports a large number of projects. What are the key things your team looks at before deciding to invest in any new project?
First, we look at whether the team genuinely believes in digital property rights and is building for an open ecosystem. If a project is designed only to operate within a closed silo, it is less likely to align with our investment approach.
We also consider the potential impact of the project. Can it create meaningful opportunities for users, expand participation, or make a positive difference in the world? We look for ideas that can grow beyond a niche use case and contribute to the broader development of Web3 and the open metaverse.
We also pay close attention to the founders and the team. Do they truly believe in what they are building? Do they have the resilience and passion to pursue the idea over the long term? In many cases, the quality and conviction of the team are just as important as the technology itself.
You recently became part of a licensed stablecoin issuer in Hong Kong with big partners. Why is this important for regular crypto users and the wider industry?
To clarify, Anchorpoint Financial is a licensed stablecoin issuer in Hong Kong, and it is a joint venture between Standard Chartered, HKT, and Animoca Brands.
Regulated stablecoins are extremely important because they can provide a trusted bridge between traditional finance and the burgeoning digital asset economy. We believe regulated stablecoins can support and improve everyday consumer payments, business transactions, and broader institutional adoption.
For major companies to participate in crypto at scale, they need payment infrastructure that is reliable, transparent, and subject to appropriate regulatory oversight. Regulated stablecoins provide that foundation of trust, and serve as safe entry points into the broader digital asset ecosystem.
Through Open Campus, education credentials are now being issued on the blockchain. How can this actually benefit students or everyday learners?
Our most impactful recent initiative led by Open Campus is the completion of the first-ever fully on-chain student loan lending cycle, in which our partner Pencil Finance deployed capital via education-financing firm ErudiFi. The capital pool offered a senior tranche with fixed 15% APY and a junior tranche with variable returns and first-loss risk.
Basically, through a collaboration led and backed by Open Campus and Animoca Brands, Pencil Finance packaged ErudiFi-issued loans as on-chain private-credit investments, letting funders supply capital and monitor repayments on EDU Chain, the education-focused blockchain.
Thanks to this pilot project, over 6,000 students across more than 100 institutions in Southeast Asia were able to secure loans to help fund education costs. Around 50% of the borrowers were women and 93% were from lower-income households. The loan capital was fully repaid with zero defaults.
Aside from that, there are a variety of ways in which the work of Open Campus and partners benefits learners. Blockchain-based credentials can give students a verifiable record of their education and achievements for their academic and professional lives, immutable and on-chain. Instead of relying entirely on a centralized institution to confirm a qualification, students can hold credentials that employers or other institutions can verify much more easily. This makes credentials verification faster, more portable, and more transparent.
But it’s not just students. AI agents are able to identify and assess candidates much faster than humans, so employers need a reliable and efficient way to verify a student’s qualifications, achievements, and academic record. As AI agents become more common and are increasingly used to scan and filter appropriate candidates for a position (whether for education or employment), verifiable credentials become even more important. Blockchain-based credentials can make qualifications and achievements significantly easier to authenticate, while giving students greater control over how their records are shared.
Privacy is also important. With blockchain it is possible to verify whether someone has particular qualifications without requiring them to reveal unnecessary personal information. In this way, students can have greater control over their educational records and how those records are shared.
You launched Minds, an AI agent platform. In simple terms, what can a normal person do with Minds that was not easily possible before?
Can you design and code a game from scratch? Most people can’t, but a Mind that you created in one minute can do that for you, working with you every step of the way to ensure your vision is realized. That’s just one specific example, the range of applications for this technology is vast.
The first major difference of Minds by Animoca Brands (or just “Minds”) is that we made it radically simple to use. You do not need specialized hardware, complex server setup, or coding skills. A Mind is a persistent, autonomous AI agent that you can create using our website in only a minute or two.
The Minds platform removes one of the biggest barriers to using agentic AI, which is getting set up and started. As soon as your Mind is active,it can help you with tasks that may previously have required significant time, technical knowledge, or coordination.
The second difference is persistence and autonomy. A Mind does not forget everything when a session ends. It has persistent memory, so it can remember your context, preferences, and objectives over time. A Mind exists and continues working independently of you, even if you are completely offline.
The third difference is that Minds are social and relational. These are entities that are extremely well suited to collaboration. You can share a Mind with your family, team, or colleagues so that they can use it as well. In addition, multiple Minds can connect and collaborate with one another very effectively. With a simple squad setup—remember, it takes only minutes to create a Mind— you can become the head of a successfully operating company composed entirely of AI agents.
Conventional AI assistants are mainly reactive. A chatbot waits for you to ask a question, then it provides an answer, and then it stops. A Mind can do all of that, but it can also be proactive. A Mind operates continuously, carries out multi-step tasks in the background, contacts you when something requires your attention, and collaborates with other Minds or humans to achieve your goals. With your permission, a Mind can manage your calendar, track flights, monitor portfolios, support sales outreach, process billing, and transact through a wallet over a long-term horizon. A Mind is an entirely different category of product from the chatbot-based solutions most of us are familiar with.
Animoca Brands often talks about the “agentic web,” where AI agents will act on our behalf. How will this change the way ordinary people use the internet and crypto in daily life?
The agentic web refers to how the internet is shifting from a participatory model, where humans actively use the Internet, to an agentic model, where users delegate significant portions of their internet activity to their agents (who are vastly more efficient at it). The next phase will not be limited to people reading, writing, and interacting online, but will involve mass delegation of tasks and decisions to AI agents, simply because they are so much better at these tasks than we are.
Minds is designed to be a gateway to the agentic web. The platform helps people manage personal productivity, interact with digital assets, use online services, and participate in new forms of digital commerce through natural-language instructions. The Minds platform pairs beautifully with Web3 in general because Minds are blockchain-native, possess technical expertise out of the box, and have no problem handling all the technical processes that the vast majority of humans still find difficult or daunting.
We believe one of the biggest barriers to Web3 adoption has been usability rather than a lack of interest. Crypto wallets, seed phrases, gas fees, bridging, and transaction approvals are annoying and intimidating to people who are unfamiliar with the technology or simply don’t want to spend the time and effort required to handle these tasks. AI agents can vastly simplify that experience, removing its friction and much of the risk. You can describe what you want in plain language, and the agent can handle the technical steps on your behalf while operating within the permissions and limits you define.
This “enabling of simplicity” is what Minds by Animoca Brands is designed to do. The Web3 use-case is an ideal example because (even though we are several years into the crypto age) people still need help with the tedious complexities involved in using blockchains.
With the Minds platform, you simply send an email or a message, then your Mind gets to work to achieve your goals without the need for you to get bogged down in blockchain complexities and interfaces. You do not need complicated hardware or server configuration, you do not need technical knowledge, and you do not need to worry about smart contracts, address strings, scams intended to fool human eyes, or the other friction and pain points currently involved in blockchain interactions.
Each Mind has persistent memory, its own identity, and its own wallet. Unlike a conventional chatbot, a Mind does not reset after every conversation. Over time, it builds a better understanding of who you are, what you are trying to achieve, and how you prefer to work—whether it is for blockchain/Web3 related work, or something completely different.
Looking ahead, what is one important development or project from Animoca Brands that the community should keep an eye on in the coming months?
Minds is one of the key developments to watch. We will continue expanding its capabilities, partnerships, integrations, skills, and applications so that it continues to become more and more useful in people’s daily lives.
Personal productivity is one of the largest opportunities. Minds agents naturally help manage calendars, track goals, summarize documents, and coordinate across teams. This is very easy stuff for them. Commerce is another important area and things here are developing in interesting ways. Through our work with Visa, we want agents to identify relevant card rewards and (subject to the user’s permissions) complete purchases on the user’s behalf, thus removing the annoyance of figuring out how to actually use your reward points.
Gaming is also a major area of interest. Agentic user-generated content and agentic non-player characters are changing both how games are built and how they are played. The Sandbox, for example, is exploring how Minds can help users to create digital content, interactive experiences, and even new forms of gameplay.
There is also the emerging category of agent-to-agent economic interactions, which leads to the emergence of new creator economies. One major example: Minds can create Skills, which are structured playbooks containing instructions on how a Mind can complete specific tasks. Skills are extremely easy to create—you simply tell your Mind what you want and it will create an appropriate Skill, which can then be shared with the rest of the community using the Bazaar marketplace. When others then install and use that Skill, the creator of the Skill receives a portion of the cognition used by other Minds via that Skill. This creates an economic model in which people can build useful capabilities once and continue earning as those capabilities are adopted by other users.
The Skill system is extremely powerful because it allows us to leverage a user’s knowledge and expertise (as well as the knowledge and expertise of a user’s Minds) and be compensated for it directly, without intermediaries.
A rough example: imagine that you are looking to buy a new phone. You instruct your Mind to research what you want in a phone—value, form factor, power, battery life, whatever—and to locate the best deals available to you. Your Mind scouts the internet according to your parameters and it locates a deal that’s right for you. You buy your new phone, but it doesn’t stop there. The work you and your Mind already did can be turned into a Skill to be shared with every other user in your market who is also looking for a new phone. These other users equip and use your Skill to find a good deal on phones they want, and your Mind starts receiving a portion of the cognition used by the other Minds who have equipped your Skill.
The Bazaar already has more than 3,000 Skills created by users’ Minds, ranging from the straightforward (such as skills to interact with third-party apps) to the highly complex (such as trading algorithms or analytical engines). My Minds generate so much cognition from Skills that it is more than enough to power their operations.
We believe the Minds platform stands at the cusp of a much broader ecosystem of agents, skills, and applications, and we are incredibly excited at the opportunities that this will generate.
About Yat Siu
Yat Siu is the Executive Chairman and Co-Founder of Animoca Brands, a Web3 company that builds, invests in and supports projects advancing digital property rights. The group’s portfolio includes The Sandbox, Open Campus, the Moca Foundation and, most recently, the AI agent platform Minds.
This post An Interview With Animoca Brands first appeared on BitcoinWorld.
Yat Siu, Executive Chairman and Co-Founder of Animoca Brands, on digital property rights, regulated stablecoins, on-chain student loans, and why the agentic web will change how ordinary people use crypto.
By Bitcoin World | 14 September 2026 | Exclusive Interview
Yat Siu, Executive Chairman and Co-Founder, Animoca Brands
Few companies have shaped the Web3 landscape as broadly as Animoca Brands. From The Sandbox and Open Campus to a licensed stablecoin joint venture in Hong Kong and, most recently, an AI agent platform called Minds, the group has placed a consistent bet: that people should own their digital assets, identities and data rather than rent them from platforms.
In this exclusive conversation with Bitcoin World, Executive Chairman and Co-Founder Yat Siu explains what Animoca Brands actually does, how his team evaluates new investments, what an on-chain student loan cycle achieved for more than 6,000 learners in Southeast Asia, and why he believes the internet is moving from a participatory model to an agentic one.
For people who are new to Animoca Brands, can you explain in simple words what the company actually does and how it helps the crypto and Web3 space?
Animoca Brands builds, invests in, and supports projects that advance digital assets and digital property rights. We believe people should be able to own their digital assets, identities, data, and contributions, rather than simply use platforms that are owned and controlled by large companies.
Digital property rights are foundational to crypto, Web3, and now the agentic web. If AI agents are going to create, transact, and interact on our behalf, then we need to know who owns the assets and data involved, who has the right to use them, and who should be rewarded for creating value.
We champion network effects and collaboration. Users derive more value from a network the more users join that network, which in turn helps the network to grow, creating a positive feedback loop. A stronger network (with a stronger network effect) therefore creates more opportunities for users, developers, and companies. Collaboration is a critical ingredient here because when companies work together to advance crypto, Web3, and the open metaverse, the entire ecosystem benefits.
A question many in the community always ask – is Animoca Brands planning to launch its own token in the future?
Animoca Brands has not made any announcement about launching a token representing the company. However, several of our subsidiaries and affiliates have launched utility tokens for their own ecosystems, including SAND from The Sandbox, MOCA from the Moca Foundation, EDU from the Open Campus DAO, and CHECK from the Checkmate ecosystem, among others.
These tokens serve different purposes within their respective ecosystems. They can support participation, access, governance, rewards, and other forms of utility.
Animoca Brands invests in and supports a large number of projects. What are the key things your team looks at before deciding to invest in any new project?
First, we look at whether the team genuinely believes in digital property rights and is building for an open ecosystem. If a project is designed only to operate within a closed silo, it is less likely to align with our investment approach.
We also consider the potential impact of the project. Can it create meaningful opportunities for users, expand participation, or make a positive difference in the world? We look for ideas that can grow beyond a niche use case and contribute to the broader development of Web3 and the open metaverse.
We also pay close attention to the founders and the team. Do they truly believe in what they are building? Do they have the resilience and passion to pursue the idea over the long term? In many cases, the quality and conviction of the team are just as important as the technology itself.
You recently became part of a licensed stablecoin issuer in Hong Kong with big partners. Why is this important for regular crypto users and the wider industry?
To clarify, Anchorpoint Financial is a licensed stablecoin issuer in Hong Kong, and it is a joint venture between Standard Chartered, HKT, and Animoca Brands.
Regulated stablecoins are extremely important because they can provide a trusted bridge between traditional finance and the burgeoning digital asset economy. We believe regulated stablecoins can support and improve everyday consumer payments, business transactions, and broader institutional adoption.
For major companies to participate in crypto at scale, they need payment infrastructure that is reliable, transparent, and subject to appropriate regulatory oversight. Regulated stablecoins provide that foundation of trust, and serve as safe entry points into the broader digital asset ecosystem.
Through Open Campus, education credentials are now being issued on the blockchain. How can this actually benefit students or everyday learners?
Our most impactful recent initiative led by Open Campus is the completion of the first-ever fully on-chain student loan lending cycle, in which our partner Pencil Finance deployed capital via education-financing firm ErudiFi. The capital pool offered a senior tranche with fixed 15% APY and a junior tranche with variable returns and first-loss risk.
Basically, through a collaboration led and backed by Open Campus and Animoca Brands, Pencil Finance packaged ErudiFi-issued loans as on-chain private-credit investments, letting funders supply capital and monitor repayments on EDU Chain, the education-focused blockchain.
Thanks to this pilot project, over 6,000 students across more than 100 institutions in Southeast Asia were able to secure loans to help fund education costs. Around 50% of the borrowers were women and 93% were from lower-income households. The loan capital was fully repaid with zero defaults.
Aside from that, there are a variety of ways in which the work of Open Campus and partners benefits learners. Blockchain-based credentials can give students a verifiable record of their education and achievements for their academic and professional lives, immutable and on-chain. Instead of relying entirely on a centralized institution to confirm a qualification, students can hold credentials that employers or other institutions can verify much more easily. This makes credentials verification faster, more portable, and more transparent.
But it’s not just students. AI agents are able to identify and assess candidates much faster than humans, so employers need a reliable and efficient way to verify a student’s qualifications, achievements, and academic record. As AI agents become more common and are increasingly used to scan and filter appropriate candidates for a position (whether for education or employment), verifiable credentials become even more important. Blockchain-based credentials can make qualifications and achievements significantly easier to authenticate, while giving students greater control over how their records are shared.
Privacy is also important. With blockchain it is possible to verify whether someone has particular qualifications without requiring them to reveal unnecessary personal information. In this way, students can have greater control over their educational records and how those records are shared.
You launched Minds, an AI agent platform. In simple terms, what can a normal person do with Minds that was not easily possible before?
Can you design and code a game from scratch? Most people can’t, but a Mind that you created in one minute can do that for you, working with you every step of the way to ensure your vision is realized. That’s just one specific example, the range of applications for this technology is vast.
The first major difference of Minds by Animoca Brands (or just “Minds”) is that we made it radically simple to use. You do not need specialized hardware, complex server setup, or coding skills. A Mind is a persistent, autonomous AI agent that you can create using our website in only a minute or two.
The Minds platform removes one of the biggest barriers to using agentic AI, which is getting set up and started. As soon as your Mind is active,it can help you with tasks that may previously have required significant time, technical knowledge, or coordination.
The second difference is persistence and autonomy. A Mind does not forget everything when a session ends. It has persistent memory, so it can remember your context, preferences, and objectives over time. A Mind exists and continues working independently of you, even if you are completely offline.
The third difference is that Minds are social and relational. These are entities that are extremely well suited to collaboration. You can share a Mind with your family, team, or colleagues so that they can use it as well. In addition, multiple Minds can connect and collaborate with one another very effectively. With a simple squad setup—remember, it takes only minutes to create a Mind— you can become the head of a successfully operating company composed entirely of AI agents.
Conventional AI assistants are mainly reactive. A chatbot waits for you to ask a question, then it provides an answer, and then it stops. A Mind can do all of that, but it can also be proactive. A Mind operates continuously, carries out multi-step tasks in the background, contacts you when something requires your attention, and collaborates with other Minds or humans to achieve your goals. With your permission, a Mind can manage your calendar, track flights, monitor portfolios, support sales outreach, process billing, and transact through a wallet over a long-term horizon. A Mind is an entirely different category of product from the chatbot-based solutions most of us are familiar with.
Animoca Brands often talks about the “agentic web,” where AI agents will act on our behalf. How will this change the way ordinary people use the internet and crypto in daily life?
The agentic web refers to how the internet is shifting from a participatory model, where humans actively use the Internet, to an agentic model, where users delegate significant portions of their internet activity to their agents (who are vastly more efficient at it). The next phase will not be limited to people reading, writing, and interacting online, but will involve mass delegation of tasks and decisions to AI agents, simply because they are so much better at these tasks than we are.
Minds is designed to be a gateway to the agentic web. The platform helps people manage personal productivity, interact with digital assets, use online services, and participate in new forms of digital commerce through natural-language instructions. The Minds platform pairs beautifully with Web3 in general because Minds are blockchain-native, possess technical expertise out of the box, and have no problem handling all the technical processes that the vast majority of humans still find difficult or daunting.
We believe one of the biggest barriers to Web3 adoption has been usability rather than a lack of interest. Crypto wallets, seed phrases, gas fees, bridging, and transaction approvals are annoying and intimidating to people who are unfamiliar with the technology or simply don’t want to spend the time and effort required to handle these tasks. AI agents can vastly simplify that experience, removing its friction and much of the risk. You can describe what you want in plain language, and the agent can handle the technical steps on your behalf while operating within the permissions and limits you define.
This “enabling of simplicity” is what Minds by Animoca Brands is designed to do. The Web3 use-case is an ideal example because (even though we are several years into the crypto age) people still need help with the tedious complexities involved in using blockchains.
With the Minds platform, you simply send an email or a message, then your Mind gets to work to achieve your goals without the need for you to get bogged down in blockchain complexities and interfaces. You do not need complicated hardware or server configuration, you do not need technical knowledge, and you do not need to worry about smart contracts, address strings, scams intended to fool human eyes, or the other friction and pain points currently involved in blockchain interactions.
Each Mind has persistent memory, its own identity, and its own wallet. Unlike a conventional chatbot, a Mind does not reset after every conversation. Over time, it builds a better understanding of who you are, what you are trying to achieve, and how you prefer to work—whether it is for blockchain/Web3 related work, or something completely different.
Looking ahead, what is one important development or project from Animoca Brands that the community should keep an eye on in the coming months?
Minds is one of the key developments to watch. We will continue expanding its capabilities, partnerships, integrations, skills, and applications so that it continues to become more and more useful in people’s daily lives.
Personal productivity is one of the largest opportunities. Minds agents naturally help manage calendars, track goals, summarize documents, and coordinate across teams. This is very easy stuff for them. Commerce is another important area and things here are developing in interesting ways. Through our work with Visa, we want agents to identify relevant card rewards and (subject to the user’s permissions) complete purchases on the user’s behalf, thus removing the annoyance of figuring out how to actually use your reward points.
Gaming is also a major area of interest. Agentic user-generated content and agentic non-player characters are changing both how games are built and how they are played. The Sandbox, for example, is exploring how Minds can help users to create digital content, interactive experiences, and even new forms of gameplay.
There is also the emerging category of agent-to-agent economic interactions, which leads to the emergence of new creator economies. One major example: Minds can create Skills, which are structured playbooks containing instructions on how a Mind can complete specific tasks. Skills are extremely easy to create—you simply tell your Mind what you want and it will create an appropriate Skill, which can then be shared with the rest of the community using the Bazaar marketplace. When others then install and use that Skill, the creator of the Skill receives a portion of the cognition used by other Minds via that Skill. This creates an economic model in which people can build useful capabilities once and continue earning as those capabilities are adopted by other users.
The Skill system is extremely powerful because it allows us to leverage a user’s knowledge and expertise (as well as the knowledge and expertise of a user’s Minds) and be compensated for it directly, without intermediaries.
A rough example: imagine that you are looking to buy a new phone. You instruct your Mind to research what you want in a phone—value, form factor, power, battery life, whatever—and to locate the best deals available to you. Your Mind scouts the internet according to your parameters and it locates a deal that’s right for you. You buy your new phone, but it doesn’t stop there. The work you and your Mind already did can be turned into a Skill to be shared with every other user in your market who is also looking for a new phone. These other users equip and use your Skill to find a good deal on phones they want, and your Mind starts receiving a portion of the cognition used by the other Minds who have equipped your Skill.
The Bazaar already has more than 3,000 Skills created by users’ Minds, ranging from the straightforward (such as skills to interact with third-party apps) to the highly complex (such as trading algorithms or analytical engines). My Minds generate so much cognition from Skills that it is more than enough to power their operations.
We believe the Minds platform stands at the cusp of a much broader ecosystem of agents, skills, and applications, and we are incredibly excited at the opportunities that this will generate.
About Yat Siu
Yat Siu is the Executive Chairman and Co-Founder of Animoca Brands, a Web3 company that builds, invests in and supports projects advancing digital property rights. The group’s portfolio includes The Sandbox, Open Campus, the Moca Foundation and, most recently, the AI agent platform Minds.
This post An Interview With Animoca Brands first appeared on BitcoinWorld.
616
·
--
Article
AML RightSource Recognized With CobraSight Award for Digital Asset Compliance ExpertiseBitcoinWorldAML RightSource Recognized with CobraSight Award for Digital Asset Compliance Expertise
Industry recognition highlights AML RightSource’s expertise in helping organizations navigate evolving crypto and digital asset regulations
HIGHLAND HILLS, Ohio, Sept. 17, 2026 /PRNewswire/ — AML RightSource, a global expert solutions provider of financial crime compliance managed services and advisory solutions, has been recognized by CobraSight with a 2026 Crypto & Digital Assets Growth Partner Award in the Licensing & Compliance category. The award recognizes firms that demonstrate deep expertise, specialization, and experience supporting organizations operating within the digital asset ecosystem.
As digital assets continue to move further into the financial mainstream, organizations face an increasingly complex regulatory environment. New and evolving requirements across jurisdictions are raising expectations around anti-money laundering, financial crime compliance, governance, licensing, and risk management.
AML RightSource helps digital asset businesses, financial institutions, fintechs, and other regulated organizations navigate these challenges through a combination of managed services, advisory support, investigations, transaction monitoring, sanctions compliance, and broader financial crime risk management expertise.
“Digital assets have rapidly evolved from a niche market to an increasingly important part of the global financial ecosystem,” said Steve Meirink, Chief Executive Officer of AML RightSource.
“As digital assets continue to gain broader adoption, organizations face increasing pressure to balance innovation with strong compliance and risk management practices. We’re proud to support our clients as they navigate that challenge, helping them build programs that meet evolving regulatory expectations while enabling sustainable growth.”
“This award reflects the expertise and commitment of our global team. Every day, our professionals work alongside clients to solve complex compliance challenges, strengthen trust, and create the foundation for long-term success.”
AML RightSource has more than 7,000 professionals globally, providing financial crime compliance expertise across North America, EMEA, and APAC. The firm’s capabilities span anti-money laundering, Know Your Customer (KYC), sanctions compliance, transaction monitoring, fraud prevention, investigations, regulatory remediation, and advisory services for highly regulated industries.
According to CobraSight, more than 350 vendors were evaluated through an independent research process, with winners selected based on specialization, industry expertise, client experience, and support for organizations operating in regulated markets.
About AML RightSourceAML RightSource is a global leader in financial crime compliance and risk management. Delivering tailored solutions through expert professionals to support AML, KYC, EDD, and more. We help clients meet compliance demands, manage risk, and navigate regulatory change with confidence. www.amlrightsource.com.
SOURCE AML RightSource
This post AML RightSource Recognized with CobraSight Award for Digital Asset Compliance Expertise first appeared on BitcoinWorld.
AML RightSource Recognized With CobraSight Award for Digital Asset Compliance Expertise
BitcoinWorldAML RightSource Recognized with CobraSight Award for Digital Asset Compliance Expertise
Industry recognition highlights AML RightSource’s expertise in helping organizations navigate evolving crypto and digital asset regulations
HIGHLAND HILLS, Ohio, Sept. 17, 2026 /PRNewswire/ — AML RightSource, a global expert solutions provider of financial crime compliance managed services and advisory solutions, has been recognized by CobraSight with a 2026 Crypto & Digital Assets Growth Partner Award in the Licensing & Compliance category. The award recognizes firms that demonstrate deep expertise, specialization, and experience supporting organizations operating within the digital asset ecosystem.
As digital assets continue to move further into the financial mainstream, organizations face an increasingly complex regulatory environment. New and evolving requirements across jurisdictions are raising expectations around anti-money laundering, financial crime compliance, governance, licensing, and risk management.
AML RightSource helps digital asset businesses, financial institutions, fintechs, and other regulated organizations navigate these challenges through a combination of managed services, advisory support, investigations, transaction monitoring, sanctions compliance, and broader financial crime risk management expertise.
“Digital assets have rapidly evolved from a niche market to an increasingly important part of the global financial ecosystem,” said Steve Meirink, Chief Executive Officer of AML RightSource.
“As digital assets continue to gain broader adoption, organizations face increasing pressure to balance innovation with strong compliance and risk management practices. We’re proud to support our clients as they navigate that challenge, helping them build programs that meet evolving regulatory expectations while enabling sustainable growth.”
“This award reflects the expertise and commitment of our global team. Every day, our professionals work alongside clients to solve complex compliance challenges, strengthen trust, and create the foundation for long-term success.”
AML RightSource has more than 7,000 professionals globally, providing financial crime compliance expertise across North America, EMEA, and APAC. The firm’s capabilities span anti-money laundering, Know Your Customer (KYC), sanctions compliance, transaction monitoring, fraud prevention, investigations, regulatory remediation, and advisory services for highly regulated industries.
According to CobraSight, more than 350 vendors were evaluated through an independent research process, with winners selected based on specialization, industry expertise, client experience, and support for organizations operating in regulated markets.
About AML RightSourceAML RightSource is a global leader in financial crime compliance and risk management. Delivering tailored solutions through expert professionals to support AML, KYC, EDD, and more. We help clients meet compliance demands, manage risk, and navigate regulatory change with confidence. www.amlrightsource.com.
SOURCE AML RightSource
This post AML RightSource Recognized with CobraSight Award for Digital Asset Compliance Expertise first appeared on BitcoinWorld.
Industry recognition highlights AML RightSource’s expertise in helping organizations navigate evolving crypto and digital asset regulations
HIGHLAND HILLS, Ohio, Sept. 17, 2026 /PRNewswire/ — AML RightSource, a global expert solutions provider of financial crime compliance managed services and advisory solutions, has been recognized by CobraSight with a 2026 Crypto & Digital Assets Growth Partner Award in the Licensing & Compliance category. The award recognizes firms that demonstrate deep expertise, specialization, and experience supporting organizations operating within the digital asset ecosystem.
As digital assets continue to move further into the financial mainstream, organizations face an increasingly complex regulatory environment. New and evolving requirements across jurisdictions are raising expectations around anti-money laundering, financial crime compliance, governance, licensing, and risk management.
AML RightSource helps digital asset businesses, financial institutions, fintechs, and other regulated organizations navigate these challenges through a combination of managed services, advisory support, investigations, transaction monitoring, sanctions compliance, and broader financial crime risk management expertise.
“Digital assets have rapidly evolved from a niche market to an increasingly important part of the global financial ecosystem,” said Steve Meirink, Chief Executive Officer of AML RightSource.
“As digital assets continue to gain broader adoption, organizations face increasing pressure to balance innovation with strong compliance and risk management practices. We’re proud to support our clients as they navigate that challenge, helping them build programs that meet evolving regulatory expectations while enabling sustainable growth.”
“This award reflects the expertise and commitment of our global team. Every day, our professionals work alongside clients to solve complex compliance challenges, strengthen trust, and create the foundation for long-term success.”
AML RightSource has more than 7,000 professionals globally, providing financial crime compliance expertise across North America, EMEA, and APAC. The firm’s capabilities span anti-money laundering, Know Your Customer (KYC), sanctions compliance, transaction monitoring, fraud prevention, investigations, regulatory remediation, and advisory services for highly regulated industries.
According to CobraSight, more than 350 vendors were evaluated through an independent research process, with winners selected based on specialization, industry expertise, client experience, and support for organizations operating in regulated markets.
About AML RightSourceAML RightSource is a global leader in financial crime compliance and risk management. Delivering tailored solutions through expert professionals to support AML, KYC, EDD, and more. We help clients meet compliance demands, manage risk, and navigate regulatory change with confidence. www.amlrightsource.com.
SOURCE AML RightSource
This post AML RightSource Recognized with CobraSight Award for Digital Asset Compliance Expertise first appeared on BitcoinWorld.
188
·
--
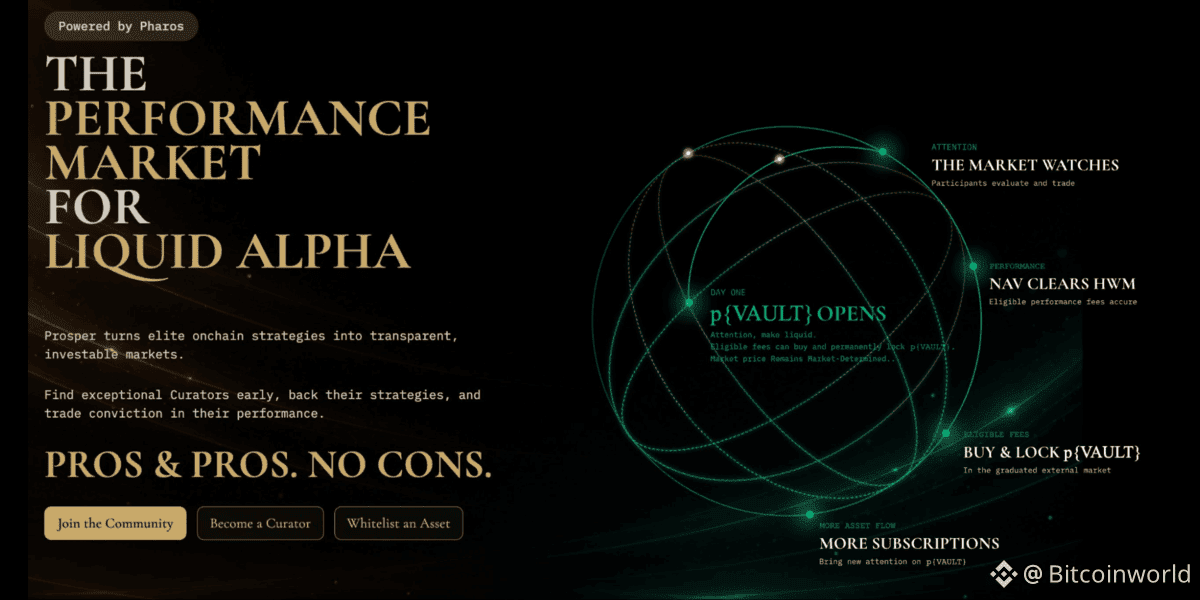
Article
Prosper Links Verifiable Onchain Performance Data With Independently Priced Crypto AssetsBitcoinWorldProsper Links Verifiable Onchain Performance Data With Independently Priced Crypto Assets
Crypto markets have always thrived on narrative and speculation. Prices often surge based on community hype or social media sentiment rather than measurable economic results. A new launch on the Pharos network is attempting to change that dynamic completely.
On September 17, Prosper officially unveiled its Performance Markets framework. The new structure introduces a concept the company calls MemeRWA. It connects independently verifiable onchain investment strategies directly to crypto-native market mechanisms. Most importantly, it does this without actually tokenizing the ownership of the underlying assets.
This distinction is crucial for the industry. Conventional real-world asset tokenization usually involves creating a digital token that represents a direct legal claim on an asset or its cash flow. Prosper is taking a wildly different route. The company splits the ecosystem into two completely separate instruments.
The first instrument is Vault Shares. These shares provide investors with direct, standard exposure to an underlying trading strategy and its net asset value.
The second instrument is p{VAULT}. This is a fixed-supply, crypto-native asset that is economically and legally separated from the actual vault. When a curator creates a strategy, its economic performance becomes entirely observable through blockchain data. Meanwhile, the corresponding p{VAULT} token trades independently on the open market. Its price is determined purely by market participants trading their expectations of the curator’s future success.
Laura Shi serves as the chief business officer at Pharos. She explained the philosophy driving the launch.
“Crypto markets have demonstrated the power of open participation and collective conviction, while onchain finance has made economic performance increasingly transparent,” Shi stated. “MemeRWA brings those ideas together. Verifiable performance data provides the signal, while p{VAULT} remains independently priced through participant activity.”
To connect the actual strategy performance with the independent token, the framework relies on a strictly automated buyback and burn mechanism.
When a vault strategy successfully exceeds its previous high-water mark, a predefined portion of the eligible performance fees is triggered. Smart contracts automatically use those fees to purchase p{VAULT} tokens on third-party decentralized exchanges. Those purchased tokens are then permanently burned and removed from circulation. Prosper emphasizes that protocol logic dictates this action entirely. It is not a discretionary price-support program run by corporate management.
The rules for these new assets are rigid. Every single p{VAULT} launches with a fixed supply of exactly one billion tokens. The company confirmed there will be no presales, no team allocations, and no insider distributions. Everything remains publicly verifiable on the blockchain, from the bonding-curve reserves to the buyback transactions.
The first group of curator strategies is already taking shape. Independent reports indicate the initial launch will cover United States equities, global stock markets, and the Hyperliquid ecosystem. Early ecosystem partners operating these initial strategies include Stove Finance, R25 Protocol, and TopNod Wallet.
Prosper itself does not custody user funds. It does not make any operational trading decisions. The platform simply provides the decentralized infrastructure layer on the Pharos blockchain, allowing third-party curators to operate their own strategies.
This model introduces a fascinating new market structure, but it also carries substantial risks. Because the p{VAULT} tokens are priced independently, their market value can diverge wildly from the actual performance of the underlying strategy. Token holders do not receive an investment contract, an ownership interest, or any direct claim to the vault’s assets.
Ultimately, Prosper is running a massive live experiment. The platform is testing whether transparent, verifiable economic performance can become a reliable reference point for a market historically driven by speculation. If curators can prove their strategies work onchain, traders now have a dedicated venue to price that success in real time.
This post Prosper Links Verifiable Onchain Performance Data With Independently Priced Crypto Assets first appeared on BitcoinWorld.
Prosper Links Verifiable Onchain Performance Data With Independently Priced Crypto Assets
BitcoinWorldProsper Links Verifiable Onchain Performance Data With Independently Priced Crypto Assets
Crypto markets have always thrived on narrative and speculation. Prices often surge based on community hype or social media sentiment rather than measurable economic results. A new launch on the Pharos network is attempting to change that dynamic completely.
On September 17, Prosper officially unveiled its Performance Markets framework. The new structure introduces a concept the company calls MemeRWA. It connects independently verifiable onchain investment strategies directly to crypto-native market mechanisms. Most importantly, it does this without actually tokenizing the ownership of the underlying assets.
This distinction is crucial for the industry. Conventional real-world asset tokenization usually involves creating a digital token that represents a direct legal claim on an asset or its cash flow. Prosper is taking a wildly different route. The company splits the ecosystem into two completely separate instruments.
The first instrument is Vault Shares. These shares provide investors with direct, standard exposure to an underlying trading strategy and its net asset value.
The second instrument is p{VAULT}. This is a fixed-supply, crypto-native asset that is economically and legally separated from the actual vault. When a curator creates a strategy, its economic performance becomes entirely observable through blockchain data. Meanwhile, the corresponding p{VAULT} token trades independently on the open market. Its price is determined purely by market participants trading their expectations of the curator’s future success.
Laura Shi serves as the chief business officer at Pharos. She explained the philosophy driving the launch.
“Crypto markets have demonstrated the power of open participation and collective conviction, while onchain finance has made economic performance increasingly transparent,” Shi stated. “MemeRWA brings those ideas together. Verifiable performance data provides the signal, while p{VAULT} remains independently priced through participant activity.”
To connect the actual strategy performance with the independent token, the framework relies on a strictly automated buyback and burn mechanism.
When a vault strategy successfully exceeds its previous high-water mark, a predefined portion of the eligible performance fees is triggered. Smart contracts automatically use those fees to purchase p{VAULT} tokens on third-party decentralized exchanges. Those purchased tokens are then permanently burned and removed from circulation. Prosper emphasizes that protocol logic dictates this action entirely. It is not a discretionary price-support program run by corporate management.
The rules for these new assets are rigid. Every single p{VAULT} launches with a fixed supply of exactly one billion tokens. The company confirmed there will be no presales, no team allocations, and no insider distributions. Everything remains publicly verifiable on the blockchain, from the bonding-curve reserves to the buyback transactions.
The first group of curator strategies is already taking shape. Independent reports indicate the initial launch will cover United States equities, global stock markets, and the Hyperliquid ecosystem. Early ecosystem partners operating these initial strategies include Stove Finance, R25 Protocol, and TopNod Wallet.
Prosper itself does not custody user funds. It does not make any operational trading decisions. The platform simply provides the decentralized infrastructure layer on the Pharos blockchain, allowing third-party curators to operate their own strategies.
This model introduces a fascinating new market structure, but it also carries substantial risks. Because the p{VAULT} tokens are priced independently, their market value can diverge wildly from the actual performance of the underlying strategy. Token holders do not receive an investment contract, an ownership interest, or any direct claim to the vault’s assets.
Ultimately, Prosper is running a massive live experiment. The platform is testing whether transparent, verifiable economic performance can become a reliable reference point for a market historically driven by speculation. If curators can prove their strategies work onchain, traders now have a dedicated venue to price that success in real time.
This post Prosper Links Verifiable Onchain Performance Data With Independently Priced Crypto Assets first appeared on BitcoinWorld.
Crypto markets have always thrived on narrative and speculation. Prices often surge based on community hype or social media sentiment rather than measurable economic results. A new launch on the Pharos network is attempting to change that dynamic completely.
On September 17, Prosper officially unveiled its Performance Markets framework. The new structure introduces a concept the company calls MemeRWA. It connects independently verifiable onchain investment strategies directly to crypto-native market mechanisms. Most importantly, it does this without actually tokenizing the ownership of the underlying assets.
This distinction is crucial for the industry. Conventional real-world asset tokenization usually involves creating a digital token that represents a direct legal claim on an asset or its cash flow. Prosper is taking a wildly different route. The company splits the ecosystem into two completely separate instruments.
The first instrument is Vault Shares. These shares provide investors with direct, standard exposure to an underlying trading strategy and its net asset value.
The second instrument is p{VAULT}. This is a fixed-supply, crypto-native asset that is economically and legally separated from the actual vault. When a curator creates a strategy, its economic performance becomes entirely observable through blockchain data. Meanwhile, the corresponding p{VAULT} token trades independently on the open market. Its price is determined purely by market participants trading their expectations of the curator’s future success.
Laura Shi serves as the chief business officer at Pharos. She explained the philosophy driving the launch.
“Crypto markets have demonstrated the power of open participation and collective conviction, while onchain finance has made economic performance increasingly transparent,” Shi stated. “MemeRWA brings those ideas together. Verifiable performance data provides the signal, while p{VAULT} remains independently priced through participant activity.”
To connect the actual strategy performance with the independent token, the framework relies on a strictly automated buyback and burn mechanism.
When a vault strategy successfully exceeds its previous high-water mark, a predefined portion of the eligible performance fees is triggered. Smart contracts automatically use those fees to purchase p{VAULT} tokens on third-party decentralized exchanges. Those purchased tokens are then permanently burned and removed from circulation. Prosper emphasizes that protocol logic dictates this action entirely. It is not a discretionary price-support program run by corporate management.
The rules for these new assets are rigid. Every single p{VAULT} launches with a fixed supply of exactly one billion tokens. The company confirmed there will be no presales, no team allocations, and no insider distributions. Everything remains publicly verifiable on the blockchain, from the bonding-curve reserves to the buyback transactions.
The first group of curator strategies is already taking shape. Independent reports indicate the initial launch will cover United States equities, global stock markets, and the Hyperliquid ecosystem. Early ecosystem partners operating these initial strategies include Stove Finance, R25 Protocol, and TopNod Wallet.
Prosper itself does not custody user funds. It does not make any operational trading decisions. The platform simply provides the decentralized infrastructure layer on the Pharos blockchain, allowing third-party curators to operate their own strategies.
This model introduces a fascinating new market structure, but it also carries substantial risks. Because the p{VAULT} tokens are priced independently, their market value can diverge wildly from the actual performance of the underlying strategy. Token holders do not receive an investment contract, an ownership interest, or any direct claim to the vault’s assets.
Ultimately, Prosper is running a massive live experiment. The platform is testing whether transparent, verifiable economic performance can become a reliable reference point for a market historically driven by speculation. If curators can prove their strategies work onchain, traders now have a dedicated venue to price that success in real time.
This post Prosper Links Verifiable Onchain Performance Data With Independently Priced Crypto Assets first appeared on BitcoinWorld.
168
·
--
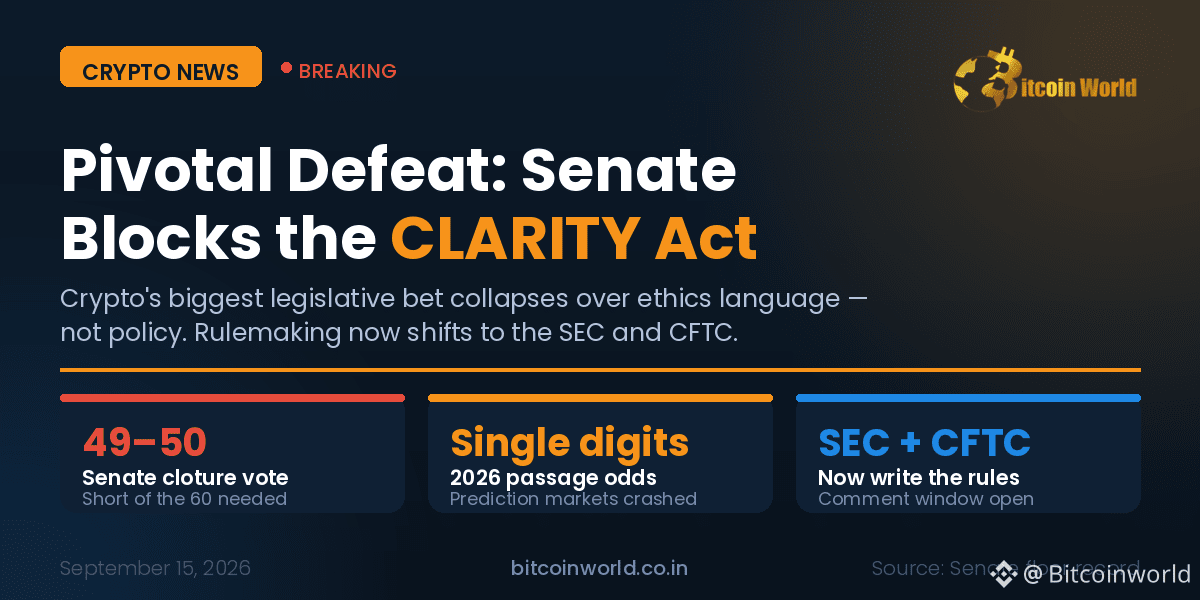
Article
Crypto’s Big Rulebook Just Got Voted Down – Here’s What Actually HappenedBitcoinWorldCrypto’s Big Rulebook Just Got Voted Down – Here’s What Actually Happened
Quick Takeaways
On September 15, 2026, the Senate refused to move the CLARITY Act forward. The vote was 49–50 – not even close to the 60 it needed.
It didn’t lose because of crypto stuff. It lost over a fight about Trump and his family making money from crypto.
For this year, the bill is basically done. Betting sites now give it only a single-digit chance.
With rules stuck in Congress, the SEC and CFTC will start writing their own instead.
Let’s back up a bit. For years, crypto companies had one big wish: a clear law that says who’s in charge of what. Right now, nobody’s fully sure whether a token is treated like a stock or like a commodity, and the SEC and CFTC keep bumping into each other over it. The CLARITY Act was supposed to fix that mess and give the CFTC clear power over crypto trading. That’s why the whole industry was watching this vote so closely.
Here’s how we got here.
The House passed the bill way back in July 2025 by a wide margin. A year later, in May 2026, a Senate committee gave it a green light too. Everything looked like it was rolling toward the finish line. Then it hit a wall on September 15, when four Republicans joined every Democrat to block it.
And here’s the part that surprised a lot of people: the bill didn’t fall apart over crypto rules at all. It fell apart over ethics – specifically, worried lawmakers pointing out that Trump’s crypto businesses pulled in more than $1.4 billion in 2025 alone. Democrats said the bill did too little to stop that. Republicans couldn’t win them over, and the whole thing sank. Even Senator Cynthia Lummis, crypto’s biggest friend in the Senate, admitted beforehand that if this vote failed, it was over.
So what now?
The good news is that the government isn’t sitting still. The SEC is already building its own crypto rules and taking public feedback, with a comment window open into late October. Both the SEC and CFTC have said they’ll keep going with or without a law. And remember – Congress did pass the GENIUS Act on stablecoins back in 2025, so cooperation isn’t impossible.
The tricky part is timing. Lawmakers are heading home to campaign for the November midterm elections, so nothing’s getting fixed until at least 2027. And if Democrats take the Senate, crypto critic Elizabeth Warren could end up running the committee that handles these bills – which would make any future attempt a lot harder.
Bottom line:
Clear crypto rules in America aren’t dead. They’re just going to come from regulators for now, not from a law. If you’re an investor or builder, stop watching the Senate – start watching what the SEC does next.
This post Crypto’s Big Rulebook Just Got Voted Down – Here’s What Actually Happened first appeared on BitcoinWorld.
Crypto’s Big Rulebook Just Got Voted Down – Here’s What Actually Happened
BitcoinWorldCrypto’s Big Rulebook Just Got Voted Down – Here’s What Actually Happened
Quick Takeaways
On September 15, 2026, the Senate refused to move the CLARITY Act forward. The vote was 49–50 – not even close to the 60 it needed.
It didn’t lose because of crypto stuff. It lost over a fight about Trump and his family making money from crypto.
For this year, the bill is basically done. Betting sites now give it only a single-digit chance.
With rules stuck in Congress, the SEC and CFTC will start writing their own instead.
Let’s back up a bit. For years, crypto companies had one big wish: a clear law that says who’s in charge of what. Right now, nobody’s fully sure whether a token is treated like a stock or like a commodity, and the SEC and CFTC keep bumping into each other over it. The CLARITY Act was supposed to fix that mess and give the CFTC clear power over crypto trading. That’s why the whole industry was watching this vote so closely.
Here’s how we got here.
The House passed the bill way back in July 2025 by a wide margin. A year later, in May 2026, a Senate committee gave it a green light too. Everything looked like it was rolling toward the finish line. Then it hit a wall on September 15, when four Republicans joined every Democrat to block it.
And here’s the part that surprised a lot of people: the bill didn’t fall apart over crypto rules at all. It fell apart over ethics – specifically, worried lawmakers pointing out that Trump’s crypto businesses pulled in more than $1.4 billion in 2025 alone. Democrats said the bill did too little to stop that. Republicans couldn’t win them over, and the whole thing sank. Even Senator Cynthia Lummis, crypto’s biggest friend in the Senate, admitted beforehand that if this vote failed, it was over.
So what now?
The good news is that the government isn’t sitting still. The SEC is already building its own crypto rules and taking public feedback, with a comment window open into late October. Both the SEC and CFTC have said they’ll keep going with or without a law. And remember – Congress did pass the GENIUS Act on stablecoins back in 2025, so cooperation isn’t impossible.
The tricky part is timing. Lawmakers are heading home to campaign for the November midterm elections, so nothing’s getting fixed until at least 2027. And if Democrats take the Senate, crypto critic Elizabeth Warren could end up running the committee that handles these bills – which would make any future attempt a lot harder.
Bottom line:
Clear crypto rules in America aren’t dead. They’re just going to come from regulators for now, not from a law. If you’re an investor or builder, stop watching the Senate – start watching what the SEC does next.
This post Crypto’s Big Rulebook Just Got Voted Down – Here’s What Actually Happened first appeared on BitcoinWorld.
Quick Takeaways
On September 15, 2026, the Senate refused to move the CLARITY Act forward. The vote was 49–50 – not even close to the 60 it needed.
It didn’t lose because of crypto stuff. It lost over a fight about Trump and his family making money from crypto.
For this year, the bill is basically done. Betting sites now give it only a single-digit chance.
With rules stuck in Congress, the SEC and CFTC will start writing their own instead.
Let’s back up a bit. For years, crypto companies had one big wish: a clear law that says who’s in charge of what. Right now, nobody’s fully sure whether a token is treated like a stock or like a commodity, and the SEC and CFTC keep bumping into each other over it. The CLARITY Act was supposed to fix that mess and give the CFTC clear power over crypto trading. That’s why the whole industry was watching this vote so closely.
Here’s how we got here.
The House passed the bill way back in July 2025 by a wide margin. A year later, in May 2026, a Senate committee gave it a green light too. Everything looked like it was rolling toward the finish line. Then it hit a wall on September 15, when four Republicans joined every Democrat to block it.
And here’s the part that surprised a lot of people: the bill didn’t fall apart over crypto rules at all. It fell apart over ethics – specifically, worried lawmakers pointing out that Trump’s crypto businesses pulled in more than $1.4 billion in 2025 alone. Democrats said the bill did too little to stop that. Republicans couldn’t win them over, and the whole thing sank. Even Senator Cynthia Lummis, crypto’s biggest friend in the Senate, admitted beforehand that if this vote failed, it was over.
So what now?
The good news is that the government isn’t sitting still. The SEC is already building its own crypto rules and taking public feedback, with a comment window open into late October. Both the SEC and CFTC have said they’ll keep going with or without a law. And remember – Congress did pass the GENIUS Act on stablecoins back in 2025, so cooperation isn’t impossible.
The tricky part is timing. Lawmakers are heading home to campaign for the November midterm elections, so nothing’s getting fixed until at least 2027. And if Democrats take the Senate, crypto critic Elizabeth Warren could end up running the committee that handles these bills – which would make any future attempt a lot harder.
Bottom line:
Clear crypto rules in America aren’t dead. They’re just going to come from regulators for now, not from a law. If you’re an investor or builder, stop watching the Senate – start watching what the SEC does next.
This post Crypto’s Big Rulebook Just Got Voted Down – Here’s What Actually Happened first appeared on BitcoinWorld.
1
329
·
--

Article
1 Week Until SPiCE Central Asia 2026: Key Market Developments & Gaming Leaders to Be HonouredBitcoinWorld1 Week Until SPiCE Central Asia 2026: Key Market Developments & Gaming Leaders to Be Honoured
Next week, the 3rd annual SPiCE Central Asia 2026 returns to The Biltmore Hotel Tbilisi, Georgia, on 24–25 September, bringing together leading operators, technology providers and gaming experts from across Central Asia and the Caucasus. Specialists in AI, marketing and compliance, alongside senior industry representatives, will share practical insights from their experience in the region.
With regulation, compliance, payments, localisation and market entry among the key considerations for businesses, discussions over the two days will focus on the practical realities of operating in diverse markets. The highly anticipated SPiCE Central Asia Awards 2026 will also take place on the evening of 24 September, recognising outstanding professionals and organisations across the region’s gaming industry.
Highlights on the Agenda
This year’s agenda will cover prime opportunities and emerging developments in Central Asia and the Caucasus, alongside dedicated networking and industry recognition.
Day 1 | Thursday, 24 September
Central Asia’s Gaming Market: Regulation, Investment & Future Growth
AI, AML & Risk Management: The Future of Compliance
Georgia’s Export-Only Online Gaming Model: A New Opportunity for International Operators
Women Driving Innovation Across Gaming & Fintech in Central Asia
SPiCE Central Asia Awards 2026 – an evening recognising outstanding companies, professionals and achievements across the region’s gaming industry
Day 2 | Friday, 25 September
Women in Gaming: Building Inclusive Leadership & Future Talent
Fintech-Enabled Payments: Strengthening Trust & Security in the Region’s Online Gaming Market
Localisation Strategies That Drive Player Engagement
Prediction Markets & the Future of Digital Wagering: Where Are We Heading?
Farewell Networking Drinks – closing out two days of industry discussion with drinks and a final opportunity to connect with fellow industry leaders
Hear from the Region’s Renowned Gaming Leaders & Innovators
Dito Khvichia, Managing Partner, Justice League Law Firm
Gennady Shemrayev, Marketing Director, Olimpbet Central Asia
George Mamulaishvili, Head of Administration, Georgian Gambling Association
Maka Gorgadze, CMO, Casino Adjara
Tania Sianko, Employer Branding & Comms Strategist | ex-Evolution Regional EB & Comms Lead
AND MANY MORE!
Honouring the Region’s Top Performers
The SPiCE Central Asia Awards 2026 will celebrate the professionals, companies and achievements making their mark on the region’s gaming industry.
Nominations for four categories – Technology Provider of the Year, Payment Provider of the Year, Innovation of the Year and Operator of the Year – remain open until Wednesday, 16 September. The shortlist will be announced on 18 September, ahead of the winners being revealed at the awards ceremony on 24 September.
View the award categories and nominate a leader: https://www.spiceseries.com/sca-award-nomination
Last Chance to Secure a Spot
With only one week left until SPiCE Central Asia 2026 kicks off, limited places are still available for those looking to connect with prominent leaders from across Central Asia and the Caucasus.
Register here: https://www.spiceseries.com/sca
For sponsorship or exhibition enquiries, contact:
Lou-Mari Burnett, Chief Operating Officer, Eventus International
loumari@eventus-international.com
+27 82 907 5850
This post 1 Week Until SPiCE Central Asia 2026: Key Market Developments & Gaming Leaders to Be Honoured first appeared on BitcoinWorld.
1 Week Until SPiCE Central Asia 2026: Key Market Developments & Gaming Leaders to Be Honoured
BitcoinWorld1 Week Until SPiCE Central Asia 2026: Key Market Developments & Gaming Leaders to Be Honoured
Next week, the 3rd annual SPiCE Central Asia 2026 returns to The Biltmore Hotel Tbilisi, Georgia, on 24–25 September, bringing together leading operators, technology providers and gaming experts from across Central Asia and the Caucasus. Specialists in AI, marketing and compliance, alongside senior industry representatives, will share practical insights from their experience in the region.
With regulation, compliance, payments, localisation and market entry among the key considerations for businesses, discussions over the two days will focus on the practical realities of operating in diverse markets. The highly anticipated SPiCE Central Asia Awards 2026 will also take place on the evening of 24 September, recognising outstanding professionals and organisations across the region’s gaming industry.
Highlights on the Agenda
This year’s agenda will cover prime opportunities and emerging developments in Central Asia and the Caucasus, alongside dedicated networking and industry recognition.
Day 1 | Thursday, 24 September
Central Asia’s Gaming Market: Regulation, Investment & Future Growth
AI, AML & Risk Management: The Future of Compliance
Georgia’s Export-Only Online Gaming Model: A New Opportunity for International Operators
Women Driving Innovation Across Gaming & Fintech in Central Asia
SPiCE Central Asia Awards 2026 – an evening recognising outstanding companies, professionals and achievements across the region’s gaming industry
Day 2 | Friday, 25 September
Women in Gaming: Building Inclusive Leadership & Future Talent
Fintech-Enabled Payments: Strengthening Trust & Security in the Region’s Online Gaming Market
Localisation Strategies That Drive Player Engagement
Prediction Markets & the Future of Digital Wagering: Where Are We Heading?
Farewell Networking Drinks – closing out two days of industry discussion with drinks and a final opportunity to connect with fellow industry leaders
Hear from the Region’s Renowned Gaming Leaders & Innovators
Dito Khvichia, Managing Partner, Justice League Law Firm
Gennady Shemrayev, Marketing Director, Olimpbet Central Asia
George Mamulaishvili, Head of Administration, Georgian Gambling Association
Maka Gorgadze, CMO, Casino Adjara
Tania Sianko, Employer Branding & Comms Strategist | ex-Evolution Regional EB & Comms Lead
AND MANY MORE!
Honouring the Region’s Top Performers
The SPiCE Central Asia Awards 2026 will celebrate the professionals, companies and achievements making their mark on the region’s gaming industry.
Nominations for four categories – Technology Provider of the Year, Payment Provider of the Year, Innovation of the Year and Operator of the Year – remain open until Wednesday, 16 September. The shortlist will be announced on 18 September, ahead of the winners being revealed at the awards ceremony on 24 September.
View the award categories and nominate a leader: https://www.spiceseries.com/sca-award-nomination
Last Chance to Secure a Spot
With only one week left until SPiCE Central Asia 2026 kicks off, limited places are still available for those looking to connect with prominent leaders from across Central Asia and the Caucasus.
Register here: https://www.spiceseries.com/sca
For sponsorship or exhibition enquiries, contact:
Lou-Mari Burnett, Chief Operating Officer, Eventus International
loumari@eventus-international.com
+27 82 907 5850
This post 1 Week Until SPiCE Central Asia 2026: Key Market Developments & Gaming Leaders to Be Honoured first appeared on BitcoinWorld.
Next week, the 3rd annual SPiCE Central Asia 2026 returns to The Biltmore Hotel Tbilisi, Georgia, on 24–25 September, bringing together leading operators, technology providers and gaming experts from across Central Asia and the Caucasus. Specialists in AI, marketing and compliance, alongside senior industry representatives, will share practical insights from their experience in the region.
With regulation, compliance, payments, localisation and market entry among the key considerations for businesses, discussions over the two days will focus on the practical realities of operating in diverse markets. The highly anticipated SPiCE Central Asia Awards 2026 will also take place on the evening of 24 September, recognising outstanding professionals and organisations across the region’s gaming industry.
Highlights on the Agenda
This year’s agenda will cover prime opportunities and emerging developments in Central Asia and the Caucasus, alongside dedicated networking and industry recognition.
Day 1 | Thursday, 24 September
Central Asia’s Gaming Market: Regulation, Investment & Future Growth
AI, AML & Risk Management: The Future of Compliance
Georgia’s Export-Only Online Gaming Model: A New Opportunity for International Operators
Women Driving Innovation Across Gaming & Fintech in Central Asia
SPiCE Central Asia Awards 2026 – an evening recognising outstanding companies, professionals and achievements across the region’s gaming industry
Day 2 | Friday, 25 September
Women in Gaming: Building Inclusive Leadership & Future Talent
Fintech-Enabled Payments: Strengthening Trust & Security in the Region’s Online Gaming Market
Localisation Strategies That Drive Player Engagement
Prediction Markets & the Future of Digital Wagering: Where Are We Heading?
Farewell Networking Drinks – closing out two days of industry discussion with drinks and a final opportunity to connect with fellow industry leaders
Hear from the Region’s Renowned Gaming Leaders & Innovators
Dito Khvichia, Managing Partner, Justice League Law Firm
Gennady Shemrayev, Marketing Director, Olimpbet Central Asia
George Mamulaishvili, Head of Administration, Georgian Gambling Association
Maka Gorgadze, CMO, Casino Adjara
Tania Sianko, Employer Branding & Comms Strategist | ex-Evolution Regional EB & Comms Lead
AND MANY MORE!
Honouring the Region’s Top Performers
The SPiCE Central Asia Awards 2026 will celebrate the professionals, companies and achievements making their mark on the region’s gaming industry.
Nominations for four categories – Technology Provider of the Year, Payment Provider of the Year, Innovation of the Year and Operator of the Year – remain open until Wednesday, 16 September. The shortlist will be announced on 18 September, ahead of the winners being revealed at the awards ceremony on 24 September.
View the award categories and nominate a leader: https://www.spiceseries.com/sca-award-nomination
Last Chance to Secure a Spot
With only one week left until SPiCE Central Asia 2026 kicks off, limited places are still available for those looking to connect with prominent leaders from across Central Asia and the Caucasus.
Register here: https://www.spiceseries.com/sca
For sponsorship or exhibition enquiries, contact:
Lou-Mari Burnett, Chief Operating Officer, Eventus International
loumari@eventus-international.com
+27 82 907 5850
This post 1 Week Until SPiCE Central Asia 2026: Key Market Developments & Gaming Leaders to Be Honoured first appeared on BitcoinWorld.
147
·
--

Article
BiG Africa Summit 2027 Returns to Botswana for Its 13th EditionBitcoinWorldBiG Africa Summit 2027 Returns to Botswana for Its 13th Edition
The BiG Africa Summit 2027 will return to Gaborone, Botswana, from 1 – 4 February 2027 for its 13th annual edition, welcoming regulators, operators and senior industry figures from across Africa’s betting and iGaming sector to The Grand Palm Hotel Casino and Convention Resort.BiG Africa Summit 2027 Returns to Botswana for Its 13th Edition
Since its launch in 2014, the BiG Africa Summit has grown into an established meeting point for the continent’s gaming industry. This four-day event connects key stakeholders for focused discussion, market insight and further action.
Supported by the Botswana Gambling Authority, the event continues to serve as a key platform for direct dialogue between regulators and the industry.
Mr Moruntshi Kemorwale, Chief Executive Officer of the Botswana Gambling Authority, commented:
“The Gambling Authority is pleased to support the 13th annual BiG Africa Summit 2027 in Gaborone. The summit provides an important platform for regulators, policymakers and industry leaders to strengthen collaboration, share knowledge and shape the future of Africa’s rapidly evolving gambling sector. As the host regulator, we look forward to welcoming delegates to Botswana and contributing to conversations that advance responsible, sustainable and technology-enabled gambling across the continent.”
Four Days in Gaborone
The 2027 summit will offer four days of industry discussion, networking and business opportunities in the heart of Botswana’s capital.
Day 1 will welcome attendees to Gaborone and provide the first opportunity to connect with fellow industry leaders.
Days 2 and 3 will form the core of the summit, bringing together expertise, insight, and networking opportunities, all focused on the challenges and regulatory developments shaping gaming markets across Africa.
Day 4 will conclude the programme with further opportunities for attendees to strengthen relationships and round off their time in beautiful Botswana.
Full agenda and speaker announcements will follow.
Access Africa’s Gaming Decision-Makers
The BiG Africa Summit 2027 will bring together regulators, operators, technology and service providers, legal and compliance experts, investors and senior decision-makers from across the African and international gaming industry.
For attendees, the value lies in direct access to the leaders influencing regulation, entering and expanding within Africa’s markets, developing new technologies and building the partnerships driving the industry forward.
Whether focused on market entry, regulation, investment, technology or commercial growth, the BiG Africa Summit provides an opportunity to connect with the stakeholders shaping the industry.
Early Bird Offers Now Available
Make the first move and join Africa’s gaming industry in Gaborone from 1 – 4 February 2027 for the historic 13th edition of one of the continent’s longest-running gaming industry gatherings.
Register here: https://www.bigafricasummit.com/
This post BiG Africa Summit 2027 Returns to Botswana for Its 13th Edition first appeared on BitcoinWorld.
BiG Africa Summit 2027 Returns to Botswana for Its 13th Edition
BitcoinWorldBiG Africa Summit 2027 Returns to Botswana for Its 13th Edition
The BiG Africa Summit 2027 will return to Gaborone, Botswana, from 1 – 4 February 2027 for its 13th annual edition, welcoming regulators, operators and senior industry figures from across Africa’s betting and iGaming sector to The Grand Palm Hotel Casino and Convention Resort.BiG Africa Summit 2027 Returns to Botswana for Its 13th Edition
Since its launch in 2014, the BiG Africa Summit has grown into an established meeting point for the continent’s gaming industry. This four-day event connects key stakeholders for focused discussion, market insight and further action.
Supported by the Botswana Gambling Authority, the event continues to serve as a key platform for direct dialogue between regulators and the industry.
Mr Moruntshi Kemorwale, Chief Executive Officer of the Botswana Gambling Authority, commented:
“The Gambling Authority is pleased to support the 13th annual BiG Africa Summit 2027 in Gaborone. The summit provides an important platform for regulators, policymakers and industry leaders to strengthen collaboration, share knowledge and shape the future of Africa’s rapidly evolving gambling sector. As the host regulator, we look forward to welcoming delegates to Botswana and contributing to conversations that advance responsible, sustainable and technology-enabled gambling across the continent.”
Four Days in Gaborone
The 2027 summit will offer four days of industry discussion, networking and business opportunities in the heart of Botswana’s capital.
Day 1 will welcome attendees to Gaborone and provide the first opportunity to connect with fellow industry leaders.
Days 2 and 3 will form the core of the summit, bringing together expertise, insight, and networking opportunities, all focused on the challenges and regulatory developments shaping gaming markets across Africa.
Day 4 will conclude the programme with further opportunities for attendees to strengthen relationships and round off their time in beautiful Botswana.
Full agenda and speaker announcements will follow.
Access Africa’s Gaming Decision-Makers
The BiG Africa Summit 2027 will bring together regulators, operators, technology and service providers, legal and compliance experts, investors and senior decision-makers from across the African and international gaming industry.
For attendees, the value lies in direct access to the leaders influencing regulation, entering and expanding within Africa’s markets, developing new technologies and building the partnerships driving the industry forward.
Whether focused on market entry, regulation, investment, technology or commercial growth, the BiG Africa Summit provides an opportunity to connect with the stakeholders shaping the industry.
Early Bird Offers Now Available
Make the first move and join Africa’s gaming industry in Gaborone from 1 – 4 February 2027 for the historic 13th edition of one of the continent’s longest-running gaming industry gatherings.
Register here: https://www.bigafricasummit.com/
This post BiG Africa Summit 2027 Returns to Botswana for Its 13th Edition first appeared on BitcoinWorld.
The BiG Africa Summit 2027 will return to Gaborone, Botswana, from 1 – 4 February 2027 for its 13th annual edition, welcoming regulators, operators and senior industry figures from across Africa’s betting and iGaming sector to The Grand Palm Hotel Casino and Convention Resort.BiG Africa Summit 2027 Returns to Botswana for Its 13th Edition
Since its launch in 2014, the BiG Africa Summit has grown into an established meeting point for the continent’s gaming industry. This four-day event connects key stakeholders for focused discussion, market insight and further action.
Supported by the Botswana Gambling Authority, the event continues to serve as a key platform for direct dialogue between regulators and the industry.
Mr Moruntshi Kemorwale, Chief Executive Officer of the Botswana Gambling Authority, commented:
“The Gambling Authority is pleased to support the 13th annual BiG Africa Summit 2027 in Gaborone. The summit provides an important platform for regulators, policymakers and industry leaders to strengthen collaboration, share knowledge and shape the future of Africa’s rapidly evolving gambling sector. As the host regulator, we look forward to welcoming delegates to Botswana and contributing to conversations that advance responsible, sustainable and technology-enabled gambling across the continent.”
Four Days in Gaborone
The 2027 summit will offer four days of industry discussion, networking and business opportunities in the heart of Botswana’s capital.
Day 1 will welcome attendees to Gaborone and provide the first opportunity to connect with fellow industry leaders.
Days 2 and 3 will form the core of the summit, bringing together expertise, insight, and networking opportunities, all focused on the challenges and regulatory developments shaping gaming markets across Africa.
Day 4 will conclude the programme with further opportunities for attendees to strengthen relationships and round off their time in beautiful Botswana.
Full agenda and speaker announcements will follow.
Access Africa’s Gaming Decision-Makers
The BiG Africa Summit 2027 will bring together regulators, operators, technology and service providers, legal and compliance experts, investors and senior decision-makers from across the African and international gaming industry.
For attendees, the value lies in direct access to the leaders influencing regulation, entering and expanding within Africa’s markets, developing new technologies and building the partnerships driving the industry forward.
Whether focused on market entry, regulation, investment, technology or commercial growth, the BiG Africa Summit provides an opportunity to connect with the stakeholders shaping the industry.
Early Bird Offers Now Available
Make the first move and join Africa’s gaming industry in Gaborone from 1 – 4 February 2027 for the historic 13th edition of one of the continent’s longest-running gaming industry gatherings.
Register here: https://www.bigafricasummit.com/
This post BiG Africa Summit 2027 Returns to Botswana for Its 13th Edition first appeared on BitcoinWorld.
245
·
--
Article
Bybit Recognized By Korean National Police Agency for Contribution to Cybercrime Response and Sec...BitcoinWorldBybit Recognized by Korean National Police Agency for Contribution to Cybercrime Response and Security Cooperation
Recognition at ISCR 2026 highlights Bybit’s ongoing collaboration with law enforcement and regulators to trace illicit funds, share intelligence and strengthen the global response to crypto-related cybercrime
DUBAI, UAE, Sept. 16, 2026 /PRNewswire/ — Bybit, the world’s second-largest cryptocurrency exchange by trading volume, has been recognized by the Korean National Police Agency (KNPA) for its contribution to cybercrime investigations and international cooperation. At the 27th International Symposium on Cybercrime Response (ISCR 2026), held in Seoul from August 27–28, the KNPA presented Bybit with a Certificate of Appreciation in recognition of its contribution to strengthening cooperation between the two organizations, particularly in the investigation of cybercrime. The certificate was presented on stage by Yoo Jae-seong, Acting Commissioner General of the Korean National Police Agency, and received on behalf of Bybit by Coco Heng, Head of Law Enforcement at Bybit.
Bybit Recognized by Korean National Police Agency for Contribution to Cybercrime Response and Security Cooperation
Bybit was nominated by the Korean National Police Agency for the recognition. The company was the only cryptocurrency exchange to receive the Certificate of Appreciation at ISCR 2026, underscoring the importance of collaboration between the digital-asset industry and law enforcement in addressing increasingly sophisticated cybercrime.
ISCR is hosted annually by the Korean National Police Agency’s Investigation Bureau and brings together government, industry and academia to advance cybercrime response and cybersecurity cooperation. The 2026 symposium focused on “Perfect Cube: Three Dimensions for Shaping New Digital Order,” highlighting standards, technology and cooperation as key pillars for building a safer digital environment.
Strengthening cooperation beyond the platform
Bybit’s approach to security extends beyond protecting its own platform. The company works with law enforcement agencies, regulators, blockchain intelligence providers and industry partners to support investigations, trace illicit funds and provide relevant intelligence that can help authorities identify the movement of stolen or fraud-linked assets.
Through its law enforcement function, Bybit responds to requests from authorities across jurisdictions and works with investigators to support the tracing of digital assets and the development of actionable intelligence. This cooperation is increasingly important as cybercriminal groups move assets across multiple blockchains, platforms and jurisdictions.
“Cybercrime does not stop at borders, and neither should the cooperation needed to fight it,” said Coco Heng, Head of Law Enforcement at Bybit. “Our responsibility is not only to protect our users and our platform, but also to work constructively with law enforcement and regulators when digital assets are connected to criminal activity. The recognition from the Korean National Police Agency is a meaningful acknowledgement of that work. We are grateful for the trust placed in our team and remain committed to sharing intelligence, supporting investigations and helping make the digital-asset ecosystem harder for criminals to exploit.”
Turning security data into action
The recognition follows the publication of Bybit’s H1 2026 Risk & Security Report, which details the company’s continued investment in security, risk controls and cybercrime prevention.
According to the report, Bybit intercepted more than $700 million in potential user losses during the first half of 2026, following the review of more than 30,000 suspicious withdrawal requests. The company also identified approximately $212 million in potential fraud-linked on-chain funds and blacklisted more than 10,000 malicious addresses.
Bybit expanded its monitoring to cover 100% of business-relevant on-chain activity, including listed token contracts, ecosystem contracts and the company’s cold, warm and hot wallets. During the period, the company handled 10 security incidents involving listed token projects, with zero resulting losses to the platform.
The report also details the growing role of AI in Bybit’s security operations. More than 100,000 security alerts were processed with AI-assisted analysis during H1 2026, while AI-assisted security auditing identified high-severity vulnerabilities at three to five times the rate of manual review. Bybit also reduced the time required to move from security assessment to testing from approximately two weeks to two hours.
For Bybit, these capabilities are part of a broader shift from responding to individual incidents toward building an always-on security framework that combines technology, intelligence, human expertise and external cooperation.
Building a safer digital-asset ecosystem
As digital-asset adoption expands, Bybit believes effective cybercrime response requires stronger coordination between private-sector platforms and public-sector authorities.
The company will continue to strengthen its security infrastructure while expanding cooperation with law enforcement agencies, regulators and industry partners globally. Bybit’s objective is to help detect threats earlier, accelerate investigations and make illicit activity more difficult to execute and profit from.
The recognition at ISCR 2026 represents an important milestone in that effort and reinforces Bybit’s commitment to contributing to a safer and more trusted digital-asset ecosystem.
#Bybit / #NewFinancialPlatform
About Bybit
Bybit is The New Financial Platform.
We believe every person should have access to every financial opportunity on earth. That’s why we’re building the first intelligent platform that connects anyone, anywhere to the world’s finance.
Trusted by more than 80 million users worldwide, Bybit brings together investing, trading, payments, and wealth-building in a single secure and intelligent ecosystem. Through the combination of AI-powered technology, deep global liquidity, robust security, and transparent operations, Bybit makes global finance more accessible, efficient, and empowering for everyone.
Built for everyone. Powered by intelligence. Open to the world.
Learn more at Bybit.com. For more details about Bybit, please visit Bybit Press For media inquiries, please contact: media@bybit.com For updates, please follow: Bybit’s Communities and Social Media
Discord | Facebook | Instagram | LinkedIn | Reddit | Telegram | TikTok | X | Youtube
SOURCE Bybit
This post Bybit Recognized by Korean National Police Agency for Contribution to Cybercrime Response and Security Cooperation first appeared on BitcoinWorld.
Bybit Recognized By Korean National Police Agency for Contribution to Cybercrime Response and Sec...
BitcoinWorldBybit Recognized by Korean National Police Agency for Contribution to Cybercrime Response and Security Cooperation
Recognition at ISCR 2026 highlights Bybit’s ongoing collaboration with law enforcement and regulators to trace illicit funds, share intelligence and strengthen the global response to crypto-related cybercrime
DUBAI, UAE, Sept. 16, 2026 /PRNewswire/ — Bybit, the world’s second-largest cryptocurrency exchange by trading volume, has been recognized by the Korean National Police Agency (KNPA) for its contribution to cybercrime investigations and international cooperation. At the 27th International Symposium on Cybercrime Response (ISCR 2026), held in Seoul from August 27–28, the KNPA presented Bybit with a Certificate of Appreciation in recognition of its contribution to strengthening cooperation between the two organizations, particularly in the investigation of cybercrime. The certificate was presented on stage by Yoo Jae-seong, Acting Commissioner General of the Korean National Police Agency, and received on behalf of Bybit by Coco Heng, Head of Law Enforcement at Bybit.
Bybit Recognized by Korean National Police Agency for Contribution to Cybercrime Response and Security Cooperation
Bybit was nominated by the Korean National Police Agency for the recognition. The company was the only cryptocurrency exchange to receive the Certificate of Appreciation at ISCR 2026, underscoring the importance of collaboration between the digital-asset industry and law enforcement in addressing increasingly sophisticated cybercrime.
ISCR is hosted annually by the Korean National Police Agency’s Investigation Bureau and brings together government, industry and academia to advance cybercrime response and cybersecurity cooperation. The 2026 symposium focused on “Perfect Cube: Three Dimensions for Shaping New Digital Order,” highlighting standards, technology and cooperation as key pillars for building a safer digital environment.
Strengthening cooperation beyond the platform
Bybit’s approach to security extends beyond protecting its own platform. The company works with law enforcement agencies, regulators, blockchain intelligence providers and industry partners to support investigations, trace illicit funds and provide relevant intelligence that can help authorities identify the movement of stolen or fraud-linked assets.
Through its law enforcement function, Bybit responds to requests from authorities across jurisdictions and works with investigators to support the tracing of digital assets and the development of actionable intelligence. This cooperation is increasingly important as cybercriminal groups move assets across multiple blockchains, platforms and jurisdictions.
“Cybercrime does not stop at borders, and neither should the cooperation needed to fight it,” said Coco Heng, Head of Law Enforcement at Bybit. “Our responsibility is not only to protect our users and our platform, but also to work constructively with law enforcement and regulators when digital assets are connected to criminal activity. The recognition from the Korean National Police Agency is a meaningful acknowledgement of that work. We are grateful for the trust placed in our team and remain committed to sharing intelligence, supporting investigations and helping make the digital-asset ecosystem harder for criminals to exploit.”
Turning security data into action
The recognition follows the publication of Bybit’s H1 2026 Risk & Security Report, which details the company’s continued investment in security, risk controls and cybercrime prevention.
According to the report, Bybit intercepted more than $700 million in potential user losses during the first half of 2026, following the review of more than 30,000 suspicious withdrawal requests. The company also identified approximately $212 million in potential fraud-linked on-chain funds and blacklisted more than 10,000 malicious addresses.
Bybit expanded its monitoring to cover 100% of business-relevant on-chain activity, including listed token contracts, ecosystem contracts and the company’s cold, warm and hot wallets. During the period, the company handled 10 security incidents involving listed token projects, with zero resulting losses to the platform.
The report also details the growing role of AI in Bybit’s security operations. More than 100,000 security alerts were processed with AI-assisted analysis during H1 2026, while AI-assisted security auditing identified high-severity vulnerabilities at three to five times the rate of manual review. Bybit also reduced the time required to move from security assessment to testing from approximately two weeks to two hours.
For Bybit, these capabilities are part of a broader shift from responding to individual incidents toward building an always-on security framework that combines technology, intelligence, human expertise and external cooperation.
Building a safer digital-asset ecosystem
As digital-asset adoption expands, Bybit believes effective cybercrime response requires stronger coordination between private-sector platforms and public-sector authorities.
The company will continue to strengthen its security infrastructure while expanding cooperation with law enforcement agencies, regulators and industry partners globally. Bybit’s objective is to help detect threats earlier, accelerate investigations and make illicit activity more difficult to execute and profit from.
The recognition at ISCR 2026 represents an important milestone in that effort and reinforces Bybit’s commitment to contributing to a safer and more trusted digital-asset ecosystem.
#Bybit / #NewFinancialPlatform
About Bybit
Bybit is The New Financial Platform.
We believe every person should have access to every financial opportunity on earth. That’s why we’re building the first intelligent platform that connects anyone, anywhere to the world’s finance.
Trusted by more than 80 million users worldwide, Bybit brings together investing, trading, payments, and wealth-building in a single secure and intelligent ecosystem. Through the combination of AI-powered technology, deep global liquidity, robust security, and transparent operations, Bybit makes global finance more accessible, efficient, and empowering for everyone.
Built for everyone. Powered by intelligence. Open to the world.
Learn more at Bybit.com. For more details about Bybit, please visit Bybit Press For media inquiries, please contact: media@bybit.com For updates, please follow: Bybit’s Communities and Social Media
Discord | Facebook | Instagram | LinkedIn | Reddit | Telegram | TikTok | X | Youtube
SOURCE Bybit
This post Bybit Recognized by Korean National Police Agency for Contribution to Cybercrime Response and Security Cooperation first appeared on BitcoinWorld.
Recognition at ISCR 2026 highlights Bybit’s ongoing collaboration with law enforcement and regulators to trace illicit funds, share intelligence and strengthen the global response to crypto-related cybercrime
DUBAI, UAE, Sept. 16, 2026 /PRNewswire/ — Bybit, the world’s second-largest cryptocurrency exchange by trading volume, has been recognized by the Korean National Police Agency (KNPA) for its contribution to cybercrime investigations and international cooperation. At the 27th International Symposium on Cybercrime Response (ISCR 2026), held in Seoul from August 27–28, the KNPA presented Bybit with a Certificate of Appreciation in recognition of its contribution to strengthening cooperation between the two organizations, particularly in the investigation of cybercrime. The certificate was presented on stage by Yoo Jae-seong, Acting Commissioner General of the Korean National Police Agency, and received on behalf of Bybit by Coco Heng, Head of Law Enforcement at Bybit.
Bybit Recognized by Korean National Police Agency for Contribution to Cybercrime Response and Security Cooperation
Bybit was nominated by the Korean National Police Agency for the recognition. The company was the only cryptocurrency exchange to receive the Certificate of Appreciation at ISCR 2026, underscoring the importance of collaboration between the digital-asset industry and law enforcement in addressing increasingly sophisticated cybercrime.
ISCR is hosted annually by the Korean National Police Agency’s Investigation Bureau and brings together government, industry and academia to advance cybercrime response and cybersecurity cooperation. The 2026 symposium focused on “Perfect Cube: Three Dimensions for Shaping New Digital Order,” highlighting standards, technology and cooperation as key pillars for building a safer digital environment.
Strengthening cooperation beyond the platform
Bybit’s approach to security extends beyond protecting its own platform. The company works with law enforcement agencies, regulators, blockchain intelligence providers and industry partners to support investigations, trace illicit funds and provide relevant intelligence that can help authorities identify the movement of stolen or fraud-linked assets.
Through its law enforcement function, Bybit responds to requests from authorities across jurisdictions and works with investigators to support the tracing of digital assets and the development of actionable intelligence. This cooperation is increasingly important as cybercriminal groups move assets across multiple blockchains, platforms and jurisdictions.
“Cybercrime does not stop at borders, and neither should the cooperation needed to fight it,” said Coco Heng, Head of Law Enforcement at Bybit. “Our responsibility is not only to protect our users and our platform, but also to work constructively with law enforcement and regulators when digital assets are connected to criminal activity. The recognition from the Korean National Police Agency is a meaningful acknowledgement of that work. We are grateful for the trust placed in our team and remain committed to sharing intelligence, supporting investigations and helping make the digital-asset ecosystem harder for criminals to exploit.”
Turning security data into action
The recognition follows the publication of Bybit’s H1 2026 Risk & Security Report, which details the company’s continued investment in security, risk controls and cybercrime prevention.
According to the report, Bybit intercepted more than $700 million in potential user losses during the first half of 2026, following the review of more than 30,000 suspicious withdrawal requests. The company also identified approximately $212 million in potential fraud-linked on-chain funds and blacklisted more than 10,000 malicious addresses.
Bybit expanded its monitoring to cover 100% of business-relevant on-chain activity, including listed token contracts, ecosystem contracts and the company’s cold, warm and hot wallets. During the period, the company handled 10 security incidents involving listed token projects, with zero resulting losses to the platform.
The report also details the growing role of AI in Bybit’s security operations. More than 100,000 security alerts were processed with AI-assisted analysis during H1 2026, while AI-assisted security auditing identified high-severity vulnerabilities at three to five times the rate of manual review. Bybit also reduced the time required to move from security assessment to testing from approximately two weeks to two hours.
For Bybit, these capabilities are part of a broader shift from responding to individual incidents toward building an always-on security framework that combines technology, intelligence, human expertise and external cooperation.
Building a safer digital-asset ecosystem
As digital-asset adoption expands, Bybit believes effective cybercrime response requires stronger coordination between private-sector platforms and public-sector authorities.
The company will continue to strengthen its security infrastructure while expanding cooperation with law enforcement agencies, regulators and industry partners globally. Bybit’s objective is to help detect threats earlier, accelerate investigations and make illicit activity more difficult to execute and profit from.
The recognition at ISCR 2026 represents an important milestone in that effort and reinforces Bybit’s commitment to contributing to a safer and more trusted digital-asset ecosystem.
#Bybit / #NewFinancialPlatform
About Bybit
Bybit is The New Financial Platform.
We believe every person should have access to every financial opportunity on earth. That’s why we’re building the first intelligent platform that connects anyone, anywhere to the world’s finance.
Trusted by more than 80 million users worldwide, Bybit brings together investing, trading, payments, and wealth-building in a single secure and intelligent ecosystem. Through the combination of AI-powered technology, deep global liquidity, robust security, and transparent operations, Bybit makes global finance more accessible, efficient, and empowering for everyone.
Built for everyone. Powered by intelligence. Open to the world.
Learn more at Bybit.com. For more details about Bybit, please visit Bybit Press For media inquiries, please contact: media@bybit.com For updates, please follow: Bybit’s Communities and Social Media
Discord | Facebook | Instagram | LinkedIn | Reddit | Telegram | TikTok | X | Youtube
SOURCE Bybit
This post Bybit Recognized by Korean National Police Agency for Contribution to Cybercrime Response and Security Cooperation first appeared on BitcoinWorld.
256
·
--
Article
KuCoin Goes Live on Arc At Mainnet Launch, Broadening Access to Onchain FinanceBitcoinWorldKuCoin Goes Live on Arc at Mainnet Launch, Broadening Access to Onchain Finance
PROVIDENCIALES, Turks and Caicos Islands, Sept. 16, 2026 /PRNewswire/ — KuCoin, a leading global crypto platform built on trust, today announced that it is live on Arc as a mainnet launch partner, enabling eligible users to move USDC directly between KuCoin and Arc from day one.As real-world financial activity moves onchain, exchanges are increasingly important in connecting established markets with emerging financial networks. By supporting Arc at launch, KuCoin expands the network options available for USDC and provides a practical access point to an ecosystem built around payments, treasury management, tokenized assets and programmable finance.
For users, the integration reduces the steps required to access supported applications on Arc. For businesses and institutions, it provides an additional route for funding eligible onchain workflows with USDC as the ecosystem develops.
“The next phase of blockchain adoption will be defined not only by what can be built onchain, but by how reliably users and institutions can access it,” said BC Wong, CEO of KuCoin. “As one of the first global exchanges to support Arc at mainnet launch, KuCoin is helping connect established digital-asset markets with emerging infrastructure for real-world financial activity. Early exchange support helps establish the accessibility, trust and market connectivity needed for traditional and onchain finance to work together at scale.”
With this launch support, KuCoin continues to expand the network options available to users and make supported onchain applications easier to access.
About KuCoin
Founded in 2017, KuCoin is a leading global crypto platform built on trust and security, serving over 45 million users across 200+ countries and regions. Known for its reliability and user-first approach, the platform combines advanced technology, deep liquidity, and strong security safeguards to deliver a seamless trading experience. KuCoin provides access to 1,500+ digital assets through a broad product suite and remains committed to building transparent, compliant, and user-centric digital asset infrastructure for the future of finance, backed by SOC 2 Type II, ISO/IEC 27001:2022, ISO/IEC 27701:2019, ISO 22301:2019 and ISO/IEC 42001:2023 certifications. In recent years, we have built a strong global compliance foundation, marked by key milestones including AUSTRAC registration in Australia, a MiCA license in Europe, and regulatory progress in other markets.
Learn more at www.kucoin.com.
Disclaimers:
Arc is an open L1 blockchain launched by Arc Network Services LLC (“Arc LLC”) and operated by a permissioned validator set. Arc LLC provides software services only and does not offer regulated financial or advisory services. Arc has not been reviewed or approved by the New York State Department of Financial Services or any other regulatory authority.
The Arc network is provided “as is” and “as available.” Use of Arc involves inherent risks associated with blockchain technology, including smart contract vulnerabilities, network disruptions, and the absence of recourse for transaction errors or losses. The ability to transact on Arc depends on the ability to obtain and use USDC to pay gas fees. Neither Arc LLC nor any permissioned validator is responsible for the content, accuracy, legality, or functionality of third-party applications, protocols, or services built on or integrated with Arc. You are solely responsible for features or services you provide to users, including obtaining any necessary licenses or approvals and otherwise complying with applicable laws.
All Arc features may be modified, delayed, or cancelled at any time without notice. Nothing herein constitutes a commitment, warranty, guarantee or legal, regulatory, tax, or investment advice.
SOURCE KuCoin
This post KuCoin Goes Live on Arc at Mainnet Launch, Broadening Access to Onchain Finance first appeared on BitcoinWorld.
KuCoin Goes Live on Arc At Mainnet Launch, Broadening Access to Onchain Finance
BitcoinWorldKuCoin Goes Live on Arc at Mainnet Launch, Broadening Access to Onchain Finance
PROVIDENCIALES, Turks and Caicos Islands, Sept. 16, 2026 /PRNewswire/ — KuCoin, a leading global crypto platform built on trust, today announced that it is live on Arc as a mainnet launch partner, enabling eligible users to move USDC directly between KuCoin and Arc from day one.As real-world financial activity moves onchain, exchanges are increasingly important in connecting established markets with emerging financial networks. By supporting Arc at launch, KuCoin expands the network options available for USDC and provides a practical access point to an ecosystem built around payments, treasury management, tokenized assets and programmable finance.
For users, the integration reduces the steps required to access supported applications on Arc. For businesses and institutions, it provides an additional route for funding eligible onchain workflows with USDC as the ecosystem develops.
“The next phase of blockchain adoption will be defined not only by what can be built onchain, but by how reliably users and institutions can access it,” said BC Wong, CEO of KuCoin. “As one of the first global exchanges to support Arc at mainnet launch, KuCoin is helping connect established digital-asset markets with emerging infrastructure for real-world financial activity. Early exchange support helps establish the accessibility, trust and market connectivity needed for traditional and onchain finance to work together at scale.”
With this launch support, KuCoin continues to expand the network options available to users and make supported onchain applications easier to access.
About KuCoin
Founded in 2017, KuCoin is a leading global crypto platform built on trust and security, serving over 45 million users across 200+ countries and regions. Known for its reliability and user-first approach, the platform combines advanced technology, deep liquidity, and strong security safeguards to deliver a seamless trading experience. KuCoin provides access to 1,500+ digital assets through a broad product suite and remains committed to building transparent, compliant, and user-centric digital asset infrastructure for the future of finance, backed by SOC 2 Type II, ISO/IEC 27001:2022, ISO/IEC 27701:2019, ISO 22301:2019 and ISO/IEC 42001:2023 certifications. In recent years, we have built a strong global compliance foundation, marked by key milestones including AUSTRAC registration in Australia, a MiCA license in Europe, and regulatory progress in other markets.
Learn more at www.kucoin.com.
Disclaimers:
Arc is an open L1 blockchain launched by Arc Network Services LLC (“Arc LLC”) and operated by a permissioned validator set. Arc LLC provides software services only and does not offer regulated financial or advisory services. Arc has not been reviewed or approved by the New York State Department of Financial Services or any other regulatory authority.
The Arc network is provided “as is” and “as available.” Use of Arc involves inherent risks associated with blockchain technology, including smart contract vulnerabilities, network disruptions, and the absence of recourse for transaction errors or losses. The ability to transact on Arc depends on the ability to obtain and use USDC to pay gas fees. Neither Arc LLC nor any permissioned validator is responsible for the content, accuracy, legality, or functionality of third-party applications, protocols, or services built on or integrated with Arc. You are solely responsible for features or services you provide to users, including obtaining any necessary licenses or approvals and otherwise complying with applicable laws.
All Arc features may be modified, delayed, or cancelled at any time without notice. Nothing herein constitutes a commitment, warranty, guarantee or legal, regulatory, tax, or investment advice.
SOURCE KuCoin
This post KuCoin Goes Live on Arc at Mainnet Launch, Broadening Access to Onchain Finance first appeared on BitcoinWorld.
PROVIDENCIALES, Turks and Caicos Islands, Sept. 16, 2026 /PRNewswire/ — KuCoin, a leading global crypto platform built on trust, today announced that it is live on Arc as a mainnet launch partner, enabling eligible users to move USDC directly between KuCoin and Arc from day one.As real-world financial activity moves onchain, exchanges are increasingly important in connecting established markets with emerging financial networks. By supporting Arc at launch, KuCoin expands the network options available for USDC and provides a practical access point to an ecosystem built around payments, treasury management, tokenized assets and programmable finance.
For users, the integration reduces the steps required to access supported applications on Arc. For businesses and institutions, it provides an additional route for funding eligible onchain workflows with USDC as the ecosystem develops.
“The next phase of blockchain adoption will be defined not only by what can be built onchain, but by how reliably users and institutions can access it,” said BC Wong, CEO of KuCoin. “As one of the first global exchanges to support Arc at mainnet launch, KuCoin is helping connect established digital-asset markets with emerging infrastructure for real-world financial activity. Early exchange support helps establish the accessibility, trust and market connectivity needed for traditional and onchain finance to work together at scale.”
With this launch support, KuCoin continues to expand the network options available to users and make supported onchain applications easier to access.
About KuCoin
Founded in 2017, KuCoin is a leading global crypto platform built on trust and security, serving over 45 million users across 200+ countries and regions. Known for its reliability and user-first approach, the platform combines advanced technology, deep liquidity, and strong security safeguards to deliver a seamless trading experience. KuCoin provides access to 1,500+ digital assets through a broad product suite and remains committed to building transparent, compliant, and user-centric digital asset infrastructure for the future of finance, backed by SOC 2 Type II, ISO/IEC 27001:2022, ISO/IEC 27701:2019, ISO 22301:2019 and ISO/IEC 42001:2023 certifications. In recent years, we have built a strong global compliance foundation, marked by key milestones including AUSTRAC registration in Australia, a MiCA license in Europe, and regulatory progress in other markets.
Learn more at www.kucoin.com.
Disclaimers:
Arc is an open L1 blockchain launched by Arc Network Services LLC (“Arc LLC”) and operated by a permissioned validator set. Arc LLC provides software services only and does not offer regulated financial or advisory services. Arc has not been reviewed or approved by the New York State Department of Financial Services or any other regulatory authority.
The Arc network is provided “as is” and “as available.” Use of Arc involves inherent risks associated with blockchain technology, including smart contract vulnerabilities, network disruptions, and the absence of recourse for transaction errors or losses. The ability to transact on Arc depends on the ability to obtain and use USDC to pay gas fees. Neither Arc LLC nor any permissioned validator is responsible for the content, accuracy, legality, or functionality of third-party applications, protocols, or services built on or integrated with Arc. You are solely responsible for features or services you provide to users, including obtaining any necessary licenses or approvals and otherwise complying with applicable laws.
All Arc features may be modified, delayed, or cancelled at any time without notice. Nothing herein constitutes a commitment, warranty, guarantee or legal, regulatory, tax, or investment advice.
SOURCE KuCoin
This post KuCoin Goes Live on Arc at Mainnet Launch, Broadening Access to Onchain Finance first appeared on BitcoinWorld.
2
1
175
·
--
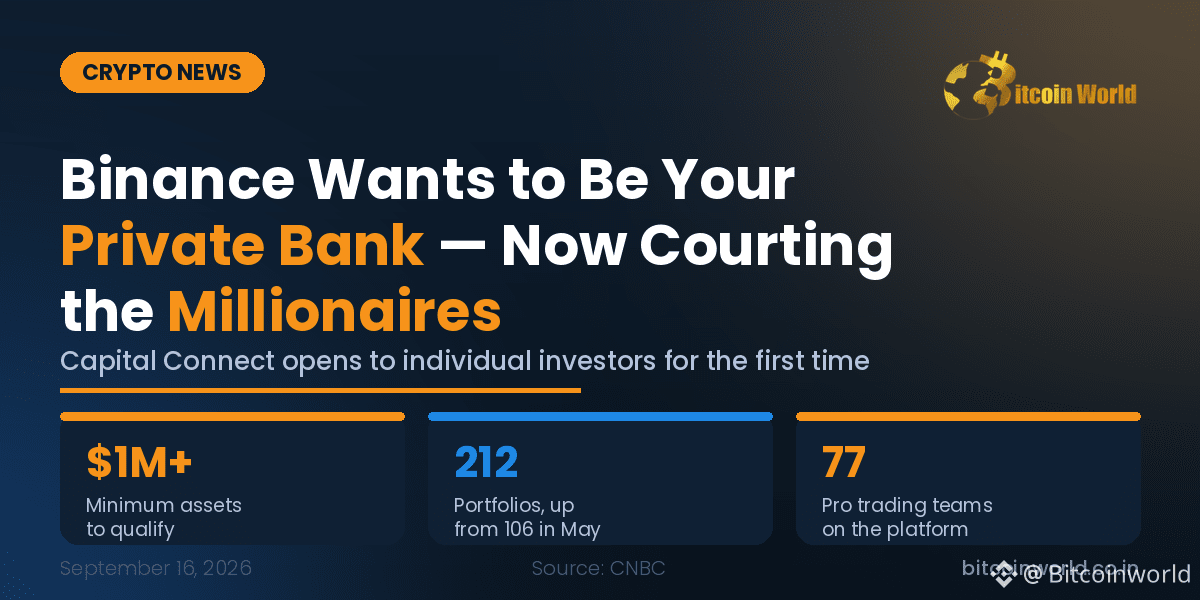
Article
Binance Wants to Be Your Private Bank Now – and It’s Coming for the MillionairesBitcoinWorldBinance Wants to Be Your Private Bank Now – And It’s Coming for the Millionaires
Key Takeaways
Binance is letting individual investors into Capital Connect for the first time – a platform that used to be institutions-only.
To get in, you need at least $1 million in assets (or VIP 3 status on the exchange).
Once inside, you can shop through professional trading strategies and put your money into the ones you like, a bit like picking a fund manager.
The real headline: crypto’s biggest exchange is now going after the wealthy clients that private banks have always considered their own.
For a long time, the story went one way. Traditional finance chased crypto. Big banks rolled out Bitcoin ETFs, wealth advisors fielded awkward questions from rich clients, and Wall Street slowly made peace with digital assets. Binance’s newest move quietly turns that whole thing around.
The exchange is opening Capital Connect to individual investors for the first time. Until now, only institutions could get in. From here on, anyone who clears the bar – holding at least $1 million in assets, or reaching VIP 3 status – can join, compare strategies built by professional trading teams, and allocate their money directly.
So why does this matter?
Because this isn’t just another button on the trading screen. Binance is stepping into asset management – the exact business private banks and giants like BlackRock treat as sacred ground. And according to Catherine Chen, who runs Binance’s VIP and institutional arm, the demand was already there. In her words, this is simply Binance answering what wealthy users were already asking for.
How it actually works?
is refreshingly simple. Capital Connect runs on Binance’s Portfolio Accounts system, which quietly handles the boring-but-important stuff – fees, risk tracking, performance data. The trading teams focus purely on strategy. Chen compares it to “separately managed accounts” in traditional finance: you back a strategy without the manager having to build an entire fund from scratch. Less paperwork, faster setup. And crucially, your assets stay on Binance – the trading teams can’t withdraw them.
Here’s how we got here:
May 2023 – Capital Connect launches as an institutions-only matchmaking service.
October 2024 – Binance Wealth arrives for high-net-worth clients.
January 2026 – Binance Prestige targets the ultra-rich with $10 million-plus.
April 2026 – Capital Connect gets rebuilt on Portfolio Accounts.
September 2026 – It opens to individuals, now with 212 portfolios from 77 trading teams, up from just 106 and 35 back in May.
That growth curve tells you everything. This thing is scaling fast.
The smart read:
Binance has been losing spot-market share and battling regulators for years. Wealth management offers what trading fees never could – steady, sticky, relationship-driven revenue that doesn’t vanish when the market dips.
What’s next:
Traditional wealth managers should pay attention. The question is no longer if banks will offer crypto – it’s whether crypto firms will simply out-execute them. Regulation stays the big wildcard, since courting millionaires worldwide invites scrutiny everywhere.
The bottom line:
Binance isn’t just adding a product. It’s betting the private bank of the future might not be a bank at all – and it wants to build it first.
This post Binance Wants to Be Your Private Bank Now – And It’s Coming for the Millionaires first appeared on BitcoinWorld.
Binance Wants to Be Your Private Bank Now – and It’s Coming for the Millionaires
BitcoinWorldBinance Wants to Be Your Private Bank Now – And It’s Coming for the Millionaires
Key Takeaways
Binance is letting individual investors into Capital Connect for the first time – a platform that used to be institutions-only.
To get in, you need at least $1 million in assets (or VIP 3 status on the exchange).
Once inside, you can shop through professional trading strategies and put your money into the ones you like, a bit like picking a fund manager.
The real headline: crypto’s biggest exchange is now going after the wealthy clients that private banks have always considered their own.
For a long time, the story went one way. Traditional finance chased crypto. Big banks rolled out Bitcoin ETFs, wealth advisors fielded awkward questions from rich clients, and Wall Street slowly made peace with digital assets. Binance’s newest move quietly turns that whole thing around.
The exchange is opening Capital Connect to individual investors for the first time. Until now, only institutions could get in. From here on, anyone who clears the bar – holding at least $1 million in assets, or reaching VIP 3 status – can join, compare strategies built by professional trading teams, and allocate their money directly.
So why does this matter?
Because this isn’t just another button on the trading screen. Binance is stepping into asset management – the exact business private banks and giants like BlackRock treat as sacred ground. And according to Catherine Chen, who runs Binance’s VIP and institutional arm, the demand was already there. In her words, this is simply Binance answering what wealthy users were already asking for.
How it actually works?
is refreshingly simple. Capital Connect runs on Binance’s Portfolio Accounts system, which quietly handles the boring-but-important stuff – fees, risk tracking, performance data. The trading teams focus purely on strategy. Chen compares it to “separately managed accounts” in traditional finance: you back a strategy without the manager having to build an entire fund from scratch. Less paperwork, faster setup. And crucially, your assets stay on Binance – the trading teams can’t withdraw them.
Here’s how we got here:
May 2023 – Capital Connect launches as an institutions-only matchmaking service.
October 2024 – Binance Wealth arrives for high-net-worth clients.
January 2026 – Binance Prestige targets the ultra-rich with $10 million-plus.
April 2026 – Capital Connect gets rebuilt on Portfolio Accounts.
September 2026 – It opens to individuals, now with 212 portfolios from 77 trading teams, up from just 106 and 35 back in May.
That growth curve tells you everything. This thing is scaling fast.
The smart read:
Binance has been losing spot-market share and battling regulators for years. Wealth management offers what trading fees never could – steady, sticky, relationship-driven revenue that doesn’t vanish when the market dips.
What’s next:
Traditional wealth managers should pay attention. The question is no longer if banks will offer crypto – it’s whether crypto firms will simply out-execute them. Regulation stays the big wildcard, since courting millionaires worldwide invites scrutiny everywhere.
The bottom line:
Binance isn’t just adding a product. It’s betting the private bank of the future might not be a bank at all – and it wants to build it first.
This post Binance Wants to Be Your Private Bank Now – And It’s Coming for the Millionaires first appeared on BitcoinWorld.
Key Takeaways
Binance is letting individual investors into Capital Connect for the first time – a platform that used to be institutions-only.
To get in, you need at least $1 million in assets (or VIP 3 status on the exchange).
Once inside, you can shop through professional trading strategies and put your money into the ones you like, a bit like picking a fund manager.
The real headline: crypto’s biggest exchange is now going after the wealthy clients that private banks have always considered their own.
For a long time, the story went one way. Traditional finance chased crypto. Big banks rolled out Bitcoin ETFs, wealth advisors fielded awkward questions from rich clients, and Wall Street slowly made peace with digital assets. Binance’s newest move quietly turns that whole thing around.
The exchange is opening Capital Connect to individual investors for the first time. Until now, only institutions could get in. From here on, anyone who clears the bar – holding at least $1 million in assets, or reaching VIP 3 status – can join, compare strategies built by professional trading teams, and allocate their money directly.
So why does this matter?
Because this isn’t just another button on the trading screen. Binance is stepping into asset management – the exact business private banks and giants like BlackRock treat as sacred ground. And according to Catherine Chen, who runs Binance’s VIP and institutional arm, the demand was already there. In her words, this is simply Binance answering what wealthy users were already asking for.
How it actually works?
is refreshingly simple. Capital Connect runs on Binance’s Portfolio Accounts system, which quietly handles the boring-but-important stuff – fees, risk tracking, performance data. The trading teams focus purely on strategy. Chen compares it to “separately managed accounts” in traditional finance: you back a strategy without the manager having to build an entire fund from scratch. Less paperwork, faster setup. And crucially, your assets stay on Binance – the trading teams can’t withdraw them.
Here’s how we got here:
May 2023 – Capital Connect launches as an institutions-only matchmaking service.
October 2024 – Binance Wealth arrives for high-net-worth clients.
January 2026 – Binance Prestige targets the ultra-rich with $10 million-plus.
April 2026 – Capital Connect gets rebuilt on Portfolio Accounts.
September 2026 – It opens to individuals, now with 212 portfolios from 77 trading teams, up from just 106 and 35 back in May.
That growth curve tells you everything. This thing is scaling fast.
The smart read:
Binance has been losing spot-market share and battling regulators for years. Wealth management offers what trading fees never could – steady, sticky, relationship-driven revenue that doesn’t vanish when the market dips.
What’s next:
Traditional wealth managers should pay attention. The question is no longer if banks will offer crypto – it’s whether crypto firms will simply out-execute them. Regulation stays the big wildcard, since courting millionaires worldwide invites scrutiny everywhere.
The bottom line:
Binance isn’t just adding a product. It’s betting the private bank of the future might not be a bank at all – and it wants to build it first.
This post Binance Wants to Be Your Private Bank Now – And It’s Coming for the Millionaires first appeared on BitcoinWorld.
193
·
--
Article
CoinDCX Partners With Tether Gold to Bring Tokenized Gold XAUT to Indian Investors; Launches SIP ...BitcoinWorldCoinDCX Partners with Tether Gold to Bring Tokenized Gold XAUT to Indian Investors; Launches SIP Starting at INR 100
Bangalore, Karnataka, India
CoinDCX, India’s largest crypto exchange, today announced a strategic collaboration with Tether Gold (XAUT), the world’s largest tokenized gold product by market capitalization, to make tokenized gold more accessible to Indian investors. As part of the collaboration, XAUT is now available for trading on CoinDCX, alongside the launch of XAUT SIP, allowing users to start investing in tokenized gold with as little as INR 100.
The launch marks another step in CoinDCX’s mission to democratize access to innovative digital assets by bringing globally recognized tokenized real-world assets (RWAs) to Indian users through a simple and secure investment experience.
Tokenized gold is emerging as one of the fastest-growing categories within the real-world asset (RWA) ecosystem. Unlike traditional gold investment options, tokenized gold combines the intrinsic value of physical gold with blockchain technology, enabling investors to own fractional exposure, trade seamlessly, and access their holdings digitally.
XAUT, issued by Tether Gold, represents ownership of physical gold and is backed by allocated gold reserves held in secure vaults. Each XAUT token corresponds to ownership of one troy ounce of physical gold, offering investors a digital representation of one of the world’s most trusted stores of value.
With the introduction of XAUT SIP, Indian investors can build disciplined, long-term exposure to gold through systematic investments, mirroring the familiarity of mutual fund SIPs while leveraging blockchain-based infrastructure.
“Indian investors have consistently demonstrated a strong affinity for gold as a long-term store of value. Through our partnership with Tether Gold, we’re bringing that familiarity into the digital era by making tokenized gold accessible, affordable, and easy to invest in. With XAUT and the introduction of SIPs starting at just INR 100, we’re lowering the barriers to investing in blockchain-based real-world assets while giving users access to a globally recognized digital representation of physical gold,” said Mridul Gupta, Founding Partner – CoinDCX.
As investor interest expands beyond crypto into tokenized real-world assets, CoinDCX believes products such as XAUT will play an increasingly important role in diversified digital portfolios. The convergence of traditional assets and blockchain technology is creating new investment opportunities that combine the transparency, accessibility, and efficiency of digital assets with the stability of established asset classes.
The launch also reinforces CoinDCX’s broader strategy of expanding beyond traditional crypto assets by introducing globally relevant investment products that cater to evolving investor preferences. By offering innovative digital assets alongside intuitive investment features such as SIPs, CoinDCX continues to simplify access to the next generation of financial products for Indian users.
With growing global momentum around tokenized real-world assets—including gold, treasuries, and other traditional financial instruments—CoinDCX remains committed to bringing trusted, high-quality digital assets to India while maintaining a secure, compliant, and user-centric investment experience.
About DCX Group
Founded in 2018 CoinDCX was established with a mission to make crypto accessible to Indians in a simple and compliant manner, CoinDCX is today India’s largest exchange, trusted by over 2 crore users. Today, the company has evolved into DCX Group, a multi-entity ecosystem with touchpoints across India and international markets. In 2024, the company took its first step towards international expansion with the acquisition of Dubai- based BitOasis, MENA’s leading virtual assets broker-dealer. In 2025, BitOasis expanded into Bahrain, further strengthening the Group’s presence in the region. Beyond exchanges, the Group powers the Web3 economy through CoinDCX Ventures, which has backed more than 15 pioneering projects, and Okto, its Web3 wallet with global presence. The Group is backed by global investors including Pantera, Steadview Capital, Kingsway, Polychain Capital, B Capital Group, Bain Capital Ventures, Cadenza, Draper Dragon, Republic, Kindred, and Coinbase Ventures.
About Tether Gold (XAUT)
Tether Gold (XAUT) is a digital asset offered by TG Commodities, S.A. de C.V. One full XAUT token represents one troy fine ounce of gold on a London Good Delivery bar. The token can be traded or moved easily at any time, anywhere in the world, and can be transferred to any on-chain address. The allocated gold is identifiable with a unique serial number, purity, and weight, and is redeemable in the form of physical gold.
Important Note:
This press announcement is not an offer to sell or the solicitation of an offer to buy Tether Gold (XAUT). TG Commodities, S.A de C.V. will only sell or redeem XAUT pursuant to its gold token terms of sale and service available (as of the date of this press release) at https://gold.tether.to/legal
This post CoinDCX Partners with Tether Gold to Bring Tokenized Gold XAUT to Indian Investors; Launches SIP Starting at INR 100 first appeared on BitcoinWorld.
CoinDCX Partners With Tether Gold to Bring Tokenized Gold XAUT to Indian Investors; Launches SIP ...
BitcoinWorldCoinDCX Partners with Tether Gold to Bring Tokenized Gold XAUT to Indian Investors; Launches SIP Starting at INR 100
Bangalore, Karnataka, India
CoinDCX, India’s largest crypto exchange, today announced a strategic collaboration with Tether Gold (XAUT), the world’s largest tokenized gold product by market capitalization, to make tokenized gold more accessible to Indian investors. As part of the collaboration, XAUT is now available for trading on CoinDCX, alongside the launch of XAUT SIP, allowing users to start investing in tokenized gold with as little as INR 100.
The launch marks another step in CoinDCX’s mission to democratize access to innovative digital assets by bringing globally recognized tokenized real-world assets (RWAs) to Indian users through a simple and secure investment experience.
Tokenized gold is emerging as one of the fastest-growing categories within the real-world asset (RWA) ecosystem. Unlike traditional gold investment options, tokenized gold combines the intrinsic value of physical gold with blockchain technology, enabling investors to own fractional exposure, trade seamlessly, and access their holdings digitally.
XAUT, issued by Tether Gold, represents ownership of physical gold and is backed by allocated gold reserves held in secure vaults. Each XAUT token corresponds to ownership of one troy ounce of physical gold, offering investors a digital representation of one of the world’s most trusted stores of value.
With the introduction of XAUT SIP, Indian investors can build disciplined, long-term exposure to gold through systematic investments, mirroring the familiarity of mutual fund SIPs while leveraging blockchain-based infrastructure.
“Indian investors have consistently demonstrated a strong affinity for gold as a long-term store of value. Through our partnership with Tether Gold, we’re bringing that familiarity into the digital era by making tokenized gold accessible, affordable, and easy to invest in. With XAUT and the introduction of SIPs starting at just INR 100, we’re lowering the barriers to investing in blockchain-based real-world assets while giving users access to a globally recognized digital representation of physical gold,” said Mridul Gupta, Founding Partner – CoinDCX.
As investor interest expands beyond crypto into tokenized real-world assets, CoinDCX believes products such as XAUT will play an increasingly important role in diversified digital portfolios. The convergence of traditional assets and blockchain technology is creating new investment opportunities that combine the transparency, accessibility, and efficiency of digital assets with the stability of established asset classes.
The launch also reinforces CoinDCX’s broader strategy of expanding beyond traditional crypto assets by introducing globally relevant investment products that cater to evolving investor preferences. By offering innovative digital assets alongside intuitive investment features such as SIPs, CoinDCX continues to simplify access to the next generation of financial products for Indian users.
With growing global momentum around tokenized real-world assets—including gold, treasuries, and other traditional financial instruments—CoinDCX remains committed to bringing trusted, high-quality digital assets to India while maintaining a secure, compliant, and user-centric investment experience.
About DCX Group
Founded in 2018 CoinDCX was established with a mission to make crypto accessible to Indians in a simple and compliant manner, CoinDCX is today India’s largest exchange, trusted by over 2 crore users. Today, the company has evolved into DCX Group, a multi-entity ecosystem with touchpoints across India and international markets. In 2024, the company took its first step towards international expansion with the acquisition of Dubai- based BitOasis, MENA’s leading virtual assets broker-dealer. In 2025, BitOasis expanded into Bahrain, further strengthening the Group’s presence in the region. Beyond exchanges, the Group powers the Web3 economy through CoinDCX Ventures, which has backed more than 15 pioneering projects, and Okto, its Web3 wallet with global presence. The Group is backed by global investors including Pantera, Steadview Capital, Kingsway, Polychain Capital, B Capital Group, Bain Capital Ventures, Cadenza, Draper Dragon, Republic, Kindred, and Coinbase Ventures.
About Tether Gold (XAUT)
Tether Gold (XAUT) is a digital asset offered by TG Commodities, S.A. de C.V. One full XAUT token represents one troy fine ounce of gold on a London Good Delivery bar. The token can be traded or moved easily at any time, anywhere in the world, and can be transferred to any on-chain address. The allocated gold is identifiable with a unique serial number, purity, and weight, and is redeemable in the form of physical gold.
Important Note:
This press announcement is not an offer to sell or the solicitation of an offer to buy Tether Gold (XAUT). TG Commodities, S.A de C.V. will only sell or redeem XAUT pursuant to its gold token terms of sale and service available (as of the date of this press release) at https://gold.tether.to/legal
This post CoinDCX Partners with Tether Gold to Bring Tokenized Gold XAUT to Indian Investors; Launches SIP Starting at INR 100 first appeared on BitcoinWorld.
Bangalore, Karnataka, India
CoinDCX, India’s largest crypto exchange, today announced a strategic collaboration with Tether Gold (XAUT), the world’s largest tokenized gold product by market capitalization, to make tokenized gold more accessible to Indian investors. As part of the collaboration, XAUT is now available for trading on CoinDCX, alongside the launch of XAUT SIP, allowing users to start investing in tokenized gold with as little as INR 100.
The launch marks another step in CoinDCX’s mission to democratize access to innovative digital assets by bringing globally recognized tokenized real-world assets (RWAs) to Indian users through a simple and secure investment experience.
Tokenized gold is emerging as one of the fastest-growing categories within the real-world asset (RWA) ecosystem. Unlike traditional gold investment options, tokenized gold combines the intrinsic value of physical gold with blockchain technology, enabling investors to own fractional exposure, trade seamlessly, and access their holdings digitally.
XAUT, issued by Tether Gold, represents ownership of physical gold and is backed by allocated gold reserves held in secure vaults. Each XAUT token corresponds to ownership of one troy ounce of physical gold, offering investors a digital representation of one of the world’s most trusted stores of value.
With the introduction of XAUT SIP, Indian investors can build disciplined, long-term exposure to gold through systematic investments, mirroring the familiarity of mutual fund SIPs while leveraging blockchain-based infrastructure.
“Indian investors have consistently demonstrated a strong affinity for gold as a long-term store of value. Through our partnership with Tether Gold, we’re bringing that familiarity into the digital era by making tokenized gold accessible, affordable, and easy to invest in. With XAUT and the introduction of SIPs starting at just INR 100, we’re lowering the barriers to investing in blockchain-based real-world assets while giving users access to a globally recognized digital representation of physical gold,” said Mridul Gupta, Founding Partner – CoinDCX.
As investor interest expands beyond crypto into tokenized real-world assets, CoinDCX believes products such as XAUT will play an increasingly important role in diversified digital portfolios. The convergence of traditional assets and blockchain technology is creating new investment opportunities that combine the transparency, accessibility, and efficiency of digital assets with the stability of established asset classes.
The launch also reinforces CoinDCX’s broader strategy of expanding beyond traditional crypto assets by introducing globally relevant investment products that cater to evolving investor preferences. By offering innovative digital assets alongside intuitive investment features such as SIPs, CoinDCX continues to simplify access to the next generation of financial products for Indian users.
With growing global momentum around tokenized real-world assets—including gold, treasuries, and other traditional financial instruments—CoinDCX remains committed to bringing trusted, high-quality digital assets to India while maintaining a secure, compliant, and user-centric investment experience.
About DCX Group
Founded in 2018 CoinDCX was established with a mission to make crypto accessible to Indians in a simple and compliant manner, CoinDCX is today India’s largest exchange, trusted by over 2 crore users. Today, the company has evolved into DCX Group, a multi-entity ecosystem with touchpoints across India and international markets. In 2024, the company took its first step towards international expansion with the acquisition of Dubai- based BitOasis, MENA’s leading virtual assets broker-dealer. In 2025, BitOasis expanded into Bahrain, further strengthening the Group’s presence in the region. Beyond exchanges, the Group powers the Web3 economy through CoinDCX Ventures, which has backed more than 15 pioneering projects, and Okto, its Web3 wallet with global presence. The Group is backed by global investors including Pantera, Steadview Capital, Kingsway, Polychain Capital, B Capital Group, Bain Capital Ventures, Cadenza, Draper Dragon, Republic, Kindred, and Coinbase Ventures.
About Tether Gold (XAUT)
Tether Gold (XAUT) is a digital asset offered by TG Commodities, S.A. de C.V. One full XAUT token represents one troy fine ounce of gold on a London Good Delivery bar. The token can be traded or moved easily at any time, anywhere in the world, and can be transferred to any on-chain address. The allocated gold is identifiable with a unique serial number, purity, and weight, and is redeemable in the form of physical gold.
Important Note:
This press announcement is not an offer to sell or the solicitation of an offer to buy Tether Gold (XAUT). TG Commodities, S.A de C.V. will only sell or redeem XAUT pursuant to its gold token terms of sale and service available (as of the date of this press release) at https://gold.tether.to/legal
This post CoinDCX Partners with Tether Gold to Bring Tokenized Gold XAUT to Indian Investors; Launches SIP Starting at INR 100 first appeared on BitcoinWorld.
202
·
--
Article
ViaBTC Partners With Mempool to Expand Access to BTC Transaction Acceleration ServicesBitcoinWorldViaBTC Partners with Mempool to Expand Access to BTC Transaction Acceleration Services
HONG KONG, Sept. 16, 2026 /PRNewswire/ — ViaBTC, a leading global multi-cryptocurrency mining pool, today announced a partnership with Mempool to expand access to Bitcoin transaction acceleration services. Under the partnership, ViaBTC will use its Bitcoin mining pool infrastructure and expertise in block construction and transaction processing to accelerate eligible transactions, helping more users get their Bitcoin transactions confirmed sooner.
Bitcoin transactions can remain unconfirmed for extended periods when the network is congested or transaction fees are too low. To help users address these delays, ViaBTC became one of the first providers to launch a Bitcoin transaction accelerator in 2016, offering free and paid options. It has continued to refine the product and its underlying technology ever since. As of September 16, 2026, ViaBTC has accelerated more than 800,000 BTC transactions.
The partnership marks another step in ViaBTC’s efforts to build partnerships across the Bitcoin infrastructure ecosystem. Since its launch in 2016, ViaBTC has navigated multiple market cycles and Bitcoin halvings, building a decade of experience in mining pool operations and technology development. That experience underpins its services for miners worldwide and supports the expansion of offerings such as transaction acceleration. Working with Mempool extends the reach of ViaBTC’s mining pool infrastructure, bringing its technical expertise to more applications across the Bitcoin ecosystem.
Haipo Yang, Founder and CEO of ViaBTC, said that miners’ long-term trust is built on reliable day-to-day operations and sustained investment in technology and service. Whatever the market does, ViaBTC puts the security, stability, and efficiency of its mining pool first. The partnership with Mempool marks another step in expanding the company’s ecosystem collaboration, drawing on years of technical and operational experience. Going forward, ViaBTC will stay focused on what miners need, strengthening its infrastructure to support their long-term growth and the continued operation of the Bitcoin network.
The partnership will not change how users access or use the ViaBTC Transaction Accelerator. Users can continue to submit eligible transaction IDs through the ViaBTC website and mobile app, where they can also view their acceleration history and request status.
ViaBTC will continue to strengthen the security, stability, and efficiency of its mining pool infrastructure while improving its products and services for miners. It will also explore further partnerships with block explorers, wallets, and other Bitcoin infrastructure providers to bring its technology to more applications. Through continued investment in technology and collaboration, ViaBTC aims to serve miners worldwide while providing reliable infrastructure for a broader range of needs across the Bitcoin ecosystem.
About ViaBTC
ViaBTC is a multi-cryptocurrency mining pool serving miners worldwide. Launched in 2016, it specializes in secure, stable, and efficient Proof-of-Work (PoW) mining services, supporting major PoW cryptocurrencies including BTC, LTC/DOGE, BCH, ZEC, and KAS. ViaBTC has served more than 2 million users across over 150 countries and regions. Its BTC, LTC/DOGE merged-mining, BCH, and ZEC pools rank among the world’s leading mining pools.
This post ViaBTC Partners with Mempool to Expand Access to BTC Transaction Acceleration Services first appeared on BitcoinWorld.
ViaBTC Partners With Mempool to Expand Access to BTC Transaction Acceleration Services
BitcoinWorldViaBTC Partners with Mempool to Expand Access to BTC Transaction Acceleration Services
HONG KONG, Sept. 16, 2026 /PRNewswire/ — ViaBTC, a leading global multi-cryptocurrency mining pool, today announced a partnership with Mempool to expand access to Bitcoin transaction acceleration services. Under the partnership, ViaBTC will use its Bitcoin mining pool infrastructure and expertise in block construction and transaction processing to accelerate eligible transactions, helping more users get their Bitcoin transactions confirmed sooner.
Bitcoin transactions can remain unconfirmed for extended periods when the network is congested or transaction fees are too low. To help users address these delays, ViaBTC became one of the first providers to launch a Bitcoin transaction accelerator in 2016, offering free and paid options. It has continued to refine the product and its underlying technology ever since. As of September 16, 2026, ViaBTC has accelerated more than 800,000 BTC transactions.
The partnership marks another step in ViaBTC’s efforts to build partnerships across the Bitcoin infrastructure ecosystem. Since its launch in 2016, ViaBTC has navigated multiple market cycles and Bitcoin halvings, building a decade of experience in mining pool operations and technology development. That experience underpins its services for miners worldwide and supports the expansion of offerings such as transaction acceleration. Working with Mempool extends the reach of ViaBTC’s mining pool infrastructure, bringing its technical expertise to more applications across the Bitcoin ecosystem.
Haipo Yang, Founder and CEO of ViaBTC, said that miners’ long-term trust is built on reliable day-to-day operations and sustained investment in technology and service. Whatever the market does, ViaBTC puts the security, stability, and efficiency of its mining pool first. The partnership with Mempool marks another step in expanding the company’s ecosystem collaboration, drawing on years of technical and operational experience. Going forward, ViaBTC will stay focused on what miners need, strengthening its infrastructure to support their long-term growth and the continued operation of the Bitcoin network.
The partnership will not change how users access or use the ViaBTC Transaction Accelerator. Users can continue to submit eligible transaction IDs through the ViaBTC website and mobile app, where they can also view their acceleration history and request status.
ViaBTC will continue to strengthen the security, stability, and efficiency of its mining pool infrastructure while improving its products and services for miners. It will also explore further partnerships with block explorers, wallets, and other Bitcoin infrastructure providers to bring its technology to more applications. Through continued investment in technology and collaboration, ViaBTC aims to serve miners worldwide while providing reliable infrastructure for a broader range of needs across the Bitcoin ecosystem.
About ViaBTC
ViaBTC is a multi-cryptocurrency mining pool serving miners worldwide. Launched in 2016, it specializes in secure, stable, and efficient Proof-of-Work (PoW) mining services, supporting major PoW cryptocurrencies including BTC, LTC/DOGE, BCH, ZEC, and KAS. ViaBTC has served more than 2 million users across over 150 countries and regions. Its BTC, LTC/DOGE merged-mining, BCH, and ZEC pools rank among the world’s leading mining pools.
This post ViaBTC Partners with Mempool to Expand Access to BTC Transaction Acceleration Services first appeared on BitcoinWorld.
HONG KONG, Sept. 16, 2026 /PRNewswire/ — ViaBTC, a leading global multi-cryptocurrency mining pool, today announced a partnership with Mempool to expand access to Bitcoin transaction acceleration services. Under the partnership, ViaBTC will use its Bitcoin mining pool infrastructure and expertise in block construction and transaction processing to accelerate eligible transactions, helping more users get their Bitcoin transactions confirmed sooner.
Bitcoin transactions can remain unconfirmed for extended periods when the network is congested or transaction fees are too low. To help users address these delays, ViaBTC became one of the first providers to launch a Bitcoin transaction accelerator in 2016, offering free and paid options. It has continued to refine the product and its underlying technology ever since. As of September 16, 2026, ViaBTC has accelerated more than 800,000 BTC transactions.
The partnership marks another step in ViaBTC’s efforts to build partnerships across the Bitcoin infrastructure ecosystem. Since its launch in 2016, ViaBTC has navigated multiple market cycles and Bitcoin halvings, building a decade of experience in mining pool operations and technology development. That experience underpins its services for miners worldwide and supports the expansion of offerings such as transaction acceleration. Working with Mempool extends the reach of ViaBTC’s mining pool infrastructure, bringing its technical expertise to more applications across the Bitcoin ecosystem.
Haipo Yang, Founder and CEO of ViaBTC, said that miners’ long-term trust is built on reliable day-to-day operations and sustained investment in technology and service. Whatever the market does, ViaBTC puts the security, stability, and efficiency of its mining pool first. The partnership with Mempool marks another step in expanding the company’s ecosystem collaboration, drawing on years of technical and operational experience. Going forward, ViaBTC will stay focused on what miners need, strengthening its infrastructure to support their long-term growth and the continued operation of the Bitcoin network.
The partnership will not change how users access or use the ViaBTC Transaction Accelerator. Users can continue to submit eligible transaction IDs through the ViaBTC website and mobile app, where they can also view their acceleration history and request status.
ViaBTC will continue to strengthen the security, stability, and efficiency of its mining pool infrastructure while improving its products and services for miners. It will also explore further partnerships with block explorers, wallets, and other Bitcoin infrastructure providers to bring its technology to more applications. Through continued investment in technology and collaboration, ViaBTC aims to serve miners worldwide while providing reliable infrastructure for a broader range of needs across the Bitcoin ecosystem.
About ViaBTC
ViaBTC is a multi-cryptocurrency mining pool serving miners worldwide. Launched in 2016, it specializes in secure, stable, and efficient Proof-of-Work (PoW) mining services, supporting major PoW cryptocurrencies including BTC, LTC/DOGE, BCH, ZEC, and KAS. ViaBTC has served more than 2 million users across over 150 countries and regions. Its BTC, LTC/DOGE merged-mining, BCH, and ZEC pools rank among the world’s leading mining pools.
This post ViaBTC Partners with Mempool to Expand Access to BTC Transaction Acceleration Services first appeared on BitcoinWorld.
173
·
--
Article
ARTPRICE NEWS: the 18TH LYON BIENNALE of CONTEMPORARY ART IS NOW OPENBitcoinWorldARTPRICE NEWS: THE 18TH LYON BIENNALE OF CONTEMPORARY ART IS NOW OPEN
Passer d’un rêve à l’autre — Passing from One Dream to Another
19 September – 13 December 202611 venues • 120 artists • nearly 400 works
PARIS, Sept. 15, 2026 /PRNewswire/ — From Saturday 19 September, the 18th Lyon Biennale of Contemporary Art opens its doors to the public. Until 13 December 2026, Passer d’un rêve à l’autre (Passing from One Dream to Another) invites everyone to experience a generous Biennale unfolding across 11 venues in Lyon and its metropolitan area, bringing together 120 artists and nearly 400 works.
Curated by Catherine Nichols, the 18th edition takes visitors on a journey through the city and its wider territory, encompassing major exhibition sites, museums, heritage venues and unexpected spaces.
18th Lyon Biennale Contemporary Art 8th Lyon Biennale Contemporary Art – 09.19 – 12.13.26 To pass from one dream to another
At the heart of this edition, Les Grandes Locos, the Biennale’s main venue, hosts a major part of the exhibition. The journey continues across ten other venues, including the Museum of Contemporary Art Lyon (macLYON), the Museum of Fine Arts of Lyon, the Musée des Tissus, exceptionally reopening its doors for the Biennale, and the LPA Saint-Antoine car park.
DISCOVER THE BIENNALE UNTIL 13 DECEMBER
For almost three months, visitors are free to create their own itinerary and experience the Biennale at their own pace.
The Biennale Pass provides access to all 11 venues, with one visit to each venue, whenever visitors choose, until 13 December 2026.
Priced from €18 to €25, the Pass makes it possible to explore the entire Biennale and return throughout the autumn to continue the experience.
Admission is free for visitors under 15, students in the Auvergne-Rhône-Alpes region and art students. Reduced rates are available for visitors under 26.
Designed to welcome the widest possible audience, the Biennale is accessible from the age of 3 and introduces new accessibility initiatives this year, including easy-to-read exhibition labels.
Visitors wishing to explore the exhibition further can book a guided tour for an additional €3, while an audio guide is available at the three main venues for an additional €3.
ONE PASS, 11 VENUES, UNTIL 13 DECEMBER
With my Pass, I can visit each venue once, whenever I want, until 13 December!
18th Lyon Biennale of Contemporary Art
Passer d’un rêve à l’autre — Passing from One Dream to Another
19 September – 13 December 2026
ART AND SOCIAL SCIENCES: REFLECTING ON A CHANGING WORLD
The 18th Lyon Biennale of Contemporary Art explores the human connections at the heart of the economy. Curated by art historian and author Catherine Nichols, it extends a line of inquiry informed by her work on creativity and social transformation. It invites us to consider a fundamental question: How can our capacity to create and tell stories open up other ways of living together?
In Lyon, the themes of dreams and passage give new expression to this inquiry: transforming the constraints of the present through imagination and collective action to build a future for which we share responsibility.
This reflection resonates with Dialogue Between a Thinker and AI, by Thierry Ehrmann, founder of Artprice and creator of the Adobe of Chaos. In the face of the anthropological shock of artificial intelligence, the book explores a profoundly humanist third path: grounding our dialogue with technology in free will, the transmission of knowledge, and critical thinking. Art and social sciences play an essential role in this approach, helping us understand the transformations reshaping our societies and economies and illuminating the choices that carry consequences for us all.
The book circulates freely in English as a RAW Typescript at dialoguebetweenathinkerandai.com
Images: [https://imgpublic.artprice.com/img/wp/sites/11/2026/07/img1-BAC26_VISUEL_V.jpg] [https://imgpublic.artprice.com/img/wp/sites/11/2026/07/img2-BIENNALE_LYON_BAC26_BLOC-MARQUE_EN_DATES.jpg] [https://imgpublic.artprice.com/img/wp/sites/11/2026/07/LOGO-labiennaledelyon.jpg]
About:
Artprice by Artmarket (Euroclear: 7478 – Bloomberg: PRC – Reuters: ARTF) and La Demeure du Chaos/Abode of Chaos are partnering with the 18th Lyon Biennale, curated by Catherine Nichols and under the artistic direction of Isabelle Bertolotti.
This collaboration brings together two major players in the art world, both deeply rooted in Lyon while maintaining a strong international outlook. For more than forty years, the Lyon Biennale has supported the evolution of contemporary art and helped establish the Lyon metropolitan area as a leading platform for artists, art professionals, and audiences from around the world. Artprice, the global leader in art market information, has for many decades documented the transformations of the international art scene and the careers of the artists who shape it.
Media Contact : Thierry Ehrmann, ir@artmarket.com
SOURCE Artmarket.com
This post ARTPRICE NEWS: THE 18TH LYON BIENNALE OF CONTEMPORARY ART IS NOW OPEN first appeared on BitcoinWorld.
ARTPRICE NEWS: the 18TH LYON BIENNALE of CONTEMPORARY ART IS NOW OPEN
BitcoinWorldARTPRICE NEWS: THE 18TH LYON BIENNALE OF CONTEMPORARY ART IS NOW OPEN
Passer d’un rêve à l’autre — Passing from One Dream to Another
19 September – 13 December 202611 venues • 120 artists • nearly 400 works
PARIS, Sept. 15, 2026 /PRNewswire/ — From Saturday 19 September, the 18th Lyon Biennale of Contemporary Art opens its doors to the public. Until 13 December 2026, Passer d’un rêve à l’autre (Passing from One Dream to Another) invites everyone to experience a generous Biennale unfolding across 11 venues in Lyon and its metropolitan area, bringing together 120 artists and nearly 400 works.
Curated by Catherine Nichols, the 18th edition takes visitors on a journey through the city and its wider territory, encompassing major exhibition sites, museums, heritage venues and unexpected spaces.
18th Lyon Biennale Contemporary Art 8th Lyon Biennale Contemporary Art – 09.19 – 12.13.26 To pass from one dream to another
At the heart of this edition, Les Grandes Locos, the Biennale’s main venue, hosts a major part of the exhibition. The journey continues across ten other venues, including the Museum of Contemporary Art Lyon (macLYON), the Museum of Fine Arts of Lyon, the Musée des Tissus, exceptionally reopening its doors for the Biennale, and the LPA Saint-Antoine car park.
DISCOVER THE BIENNALE UNTIL 13 DECEMBER
For almost three months, visitors are free to create their own itinerary and experience the Biennale at their own pace.
The Biennale Pass provides access to all 11 venues, with one visit to each venue, whenever visitors choose, until 13 December 2026.
Priced from €18 to €25, the Pass makes it possible to explore the entire Biennale and return throughout the autumn to continue the experience.
Admission is free for visitors under 15, students in the Auvergne-Rhône-Alpes region and art students. Reduced rates are available for visitors under 26.
Designed to welcome the widest possible audience, the Biennale is accessible from the age of 3 and introduces new accessibility initiatives this year, including easy-to-read exhibition labels.
Visitors wishing to explore the exhibition further can book a guided tour for an additional €3, while an audio guide is available at the three main venues for an additional €3.
ONE PASS, 11 VENUES, UNTIL 13 DECEMBER
With my Pass, I can visit each venue once, whenever I want, until 13 December!
18th Lyon Biennale of Contemporary Art
Passer d’un rêve à l’autre — Passing from One Dream to Another
19 September – 13 December 2026
ART AND SOCIAL SCIENCES: REFLECTING ON A CHANGING WORLD
The 18th Lyon Biennale of Contemporary Art explores the human connections at the heart of the economy. Curated by art historian and author Catherine Nichols, it extends a line of inquiry informed by her work on creativity and social transformation. It invites us to consider a fundamental question: How can our capacity to create and tell stories open up other ways of living together?
In Lyon, the themes of dreams and passage give new expression to this inquiry: transforming the constraints of the present through imagination and collective action to build a future for which we share responsibility.
This reflection resonates with Dialogue Between a Thinker and AI, by Thierry Ehrmann, founder of Artprice and creator of the Adobe of Chaos. In the face of the anthropological shock of artificial intelligence, the book explores a profoundly humanist third path: grounding our dialogue with technology in free will, the transmission of knowledge, and critical thinking. Art and social sciences play an essential role in this approach, helping us understand the transformations reshaping our societies and economies and illuminating the choices that carry consequences for us all.
The book circulates freely in English as a RAW Typescript at dialoguebetweenathinkerandai.com
Images: [https://imgpublic.artprice.com/img/wp/sites/11/2026/07/img1-BAC26_VISUEL_V.jpg] [https://imgpublic.artprice.com/img/wp/sites/11/2026/07/img2-BIENNALE_LYON_BAC26_BLOC-MARQUE_EN_DATES.jpg] [https://imgpublic.artprice.com/img/wp/sites/11/2026/07/LOGO-labiennaledelyon.jpg]
About:
Artprice by Artmarket (Euroclear: 7478 – Bloomberg: PRC – Reuters: ARTF) and La Demeure du Chaos/Abode of Chaos are partnering with the 18th Lyon Biennale, curated by Catherine Nichols and under the artistic direction of Isabelle Bertolotti.
This collaboration brings together two major players in the art world, both deeply rooted in Lyon while maintaining a strong international outlook. For more than forty years, the Lyon Biennale has supported the evolution of contemporary art and helped establish the Lyon metropolitan area as a leading platform for artists, art professionals, and audiences from around the world. Artprice, the global leader in art market information, has for many decades documented the transformations of the international art scene and the careers of the artists who shape it.
Media Contact : Thierry Ehrmann, ir@artmarket.com
SOURCE Artmarket.com
This post ARTPRICE NEWS: THE 18TH LYON BIENNALE OF CONTEMPORARY ART IS NOW OPEN first appeared on BitcoinWorld.
Passer d’un rêve à l’autre — Passing from One Dream to Another
19 September – 13 December 202611 venues • 120 artists • nearly 400 works
PARIS, Sept. 15, 2026 /PRNewswire/ — From Saturday 19 September, the 18th Lyon Biennale of Contemporary Art opens its doors to the public. Until 13 December 2026, Passer d’un rêve à l’autre (Passing from One Dream to Another) invites everyone to experience a generous Biennale unfolding across 11 venues in Lyon and its metropolitan area, bringing together 120 artists and nearly 400 works.
Curated by Catherine Nichols, the 18th edition takes visitors on a journey through the city and its wider territory, encompassing major exhibition sites, museums, heritage venues and unexpected spaces.
18th Lyon Biennale Contemporary Art 8th Lyon Biennale Contemporary Art – 09.19 – 12.13.26 To pass from one dream to another
At the heart of this edition, Les Grandes Locos, the Biennale’s main venue, hosts a major part of the exhibition. The journey continues across ten other venues, including the Museum of Contemporary Art Lyon (macLYON), the Museum of Fine Arts of Lyon, the Musée des Tissus, exceptionally reopening its doors for the Biennale, and the LPA Saint-Antoine car park.
DISCOVER THE BIENNALE UNTIL 13 DECEMBER
For almost three months, visitors are free to create their own itinerary and experience the Biennale at their own pace.
The Biennale Pass provides access to all 11 venues, with one visit to each venue, whenever visitors choose, until 13 December 2026.
Priced from €18 to €25, the Pass makes it possible to explore the entire Biennale and return throughout the autumn to continue the experience.
Admission is free for visitors under 15, students in the Auvergne-Rhône-Alpes region and art students. Reduced rates are available for visitors under 26.
Designed to welcome the widest possible audience, the Biennale is accessible from the age of 3 and introduces new accessibility initiatives this year, including easy-to-read exhibition labels.
Visitors wishing to explore the exhibition further can book a guided tour for an additional €3, while an audio guide is available at the three main venues for an additional €3.
ONE PASS, 11 VENUES, UNTIL 13 DECEMBER
With my Pass, I can visit each venue once, whenever I want, until 13 December!
18th Lyon Biennale of Contemporary Art
Passer d’un rêve à l’autre — Passing from One Dream to Another
19 September – 13 December 2026
ART AND SOCIAL SCIENCES: REFLECTING ON A CHANGING WORLD
The 18th Lyon Biennale of Contemporary Art explores the human connections at the heart of the economy. Curated by art historian and author Catherine Nichols, it extends a line of inquiry informed by her work on creativity and social transformation. It invites us to consider a fundamental question: How can our capacity to create and tell stories open up other ways of living together?
In Lyon, the themes of dreams and passage give new expression to this inquiry: transforming the constraints of the present through imagination and collective action to build a future for which we share responsibility.
This reflection resonates with Dialogue Between a Thinker and AI, by Thierry Ehrmann, founder of Artprice and creator of the Adobe of Chaos. In the face of the anthropological shock of artificial intelligence, the book explores a profoundly humanist third path: grounding our dialogue with technology in free will, the transmission of knowledge, and critical thinking. Art and social sciences play an essential role in this approach, helping us understand the transformations reshaping our societies and economies and illuminating the choices that carry consequences for us all.
The book circulates freely in English as a RAW Typescript at dialoguebetweenathinkerandai.com
Images: [https://imgpublic.artprice.com/img/wp/sites/11/2026/07/img1-BAC26_VISUEL_V.jpg] [https://imgpublic.artprice.com/img/wp/sites/11/2026/07/img2-BIENNALE_LYON_BAC26_BLOC-MARQUE_EN_DATES.jpg] [https://imgpublic.artprice.com/img/wp/sites/11/2026/07/LOGO-labiennaledelyon.jpg]
About:
Artprice by Artmarket (Euroclear: 7478 – Bloomberg: PRC – Reuters: ARTF) and La Demeure du Chaos/Abode of Chaos are partnering with the 18th Lyon Biennale, curated by Catherine Nichols and under the artistic direction of Isabelle Bertolotti.
This collaboration brings together two major players in the art world, both deeply rooted in Lyon while maintaining a strong international outlook. For more than forty years, the Lyon Biennale has supported the evolution of contemporary art and helped establish the Lyon metropolitan area as a leading platform for artists, art professionals, and audiences from around the world. Artprice, the global leader in art market information, has for many decades documented the transformations of the international art scene and the careers of the artists who shape it.
Media Contact : Thierry Ehrmann, ir@artmarket.com
SOURCE Artmarket.com
This post ARTPRICE NEWS: THE 18TH LYON BIENNALE OF CONTEMPORARY ART IS NOW OPEN first appeared on BitcoinWorld.
205
·
--
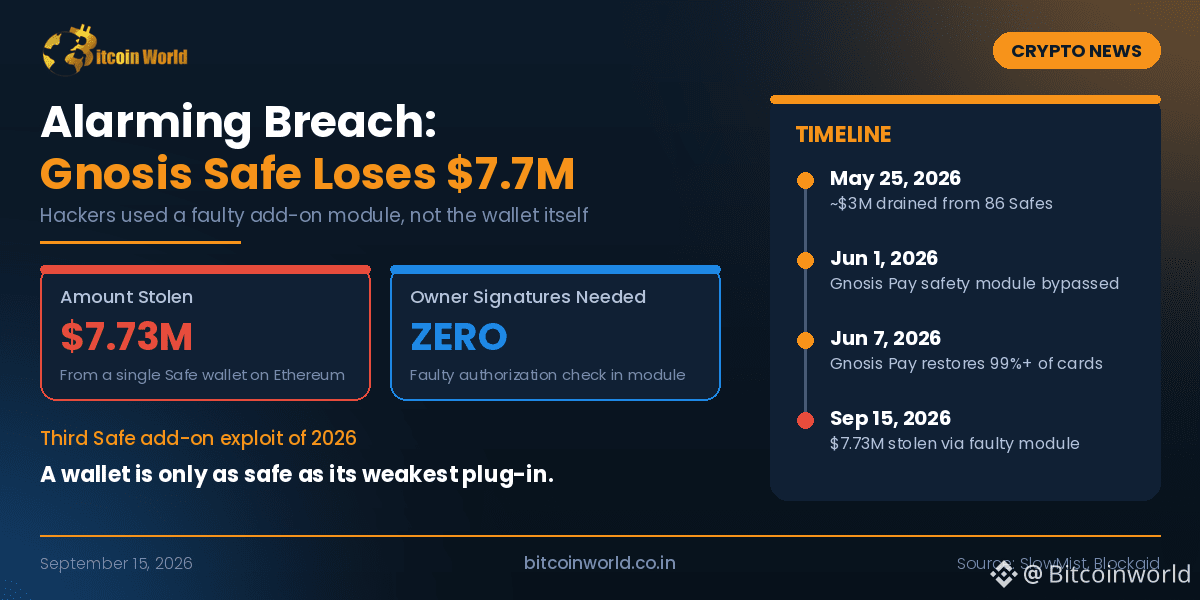
Article
Gnosis Safe Wallet Loses $7.7 Million, and Hackers Never Had to Crack ItBitcoinWorldGnosis Safe Wallet Loses $7.7 Million, and Hackers Never Had to Crack It
Key Takeaways
Hackers stole about $7.73 million from one Gnosis Safe wallet on September 15, 2026.
They didn’t break the wallet itself. They got in through an add-on tool connected to it.
The stolen money was passed through a trading pool the hackers set up, which made it harder to trace.
This is the third time this year that Safe wallet add-ons have been used to steal funds.
First, what is a Gnosis Safe?
Think of a Gnosis Safe as a bank locker that needs several keys to open. Companies, crypto funds and wealthy investors use it because no single person can move the money alone. That is why it has a reputation as one of the safest places to keep crypto.
Safe also lets owners plug in extra tools, called modules, that handle routine work automatically, such as moving funds to earn interest. The catch is that these tools can move money without asking for all those keys.
What went wrong
The wallet belonged to a big investor who had connected one of these automatic tools. That tool had a faulty security check. It was supposed to confirm who was giving the orders, and it didn’t do that properly.
The hackers noticed the flaw and used the tool to move the money into a trading pool they had created themselves. From there, they swapped it for other coins and walked away. The wallet owners never approved anything.
In simple terms, the locker was strong, but a side door had been left unlocked.
How it unfolded this year
May 25: About $3 million was taken from 86 Safe wallets in roughly two hours through a faulty add-on.
June 1: Hackers found a way past a safety feature in Gnosis Pay, the crypto debit card service built on Safe.
June 7: Gnosis Pay had normal card services working again for more than 99% of its users.
September 15: The $7.73 million theft happened, starting with one large transfer and followed by smaller ones over the next hour.
Why this should worry people
All three attacks follow the same pattern. The main wallet held up, but the extra tools attached to it failed. Security firms spotted this latest theft quickly, yet they still couldn’t stop it, because these transfers happen in seconds.
The fake trading pool was also a smart move by the hackers. It let them swap stolen coins on their own terms without depending on anyone else.
What happens next
We will likely see stricter checks before these add-ons can be connected to wallets. Limits on how much an add-on can move, and waiting periods before large transfers, may become standard. Wallet apps may also start warning users when a connected tool looks risky.
Conclusion
This theft doesn’t mean Gnosis Safe is broken. It does show that a wallet is only as safe as the weakest tool plugged into it. If you use a Safe, check which add-ons are connected today, and remove any you don’t recognise or no longer use.
This post Gnosis Safe Wallet Loses $7.7 Million, and Hackers Never Had to Crack It first appeared on BitcoinWorld.
Gnosis Safe Wallet Loses $7.7 Million, and Hackers Never Had to Crack It
BitcoinWorldGnosis Safe Wallet Loses $7.7 Million, and Hackers Never Had to Crack It
Key Takeaways
Hackers stole about $7.73 million from one Gnosis Safe wallet on September 15, 2026.
They didn’t break the wallet itself. They got in through an add-on tool connected to it.
The stolen money was passed through a trading pool the hackers set up, which made it harder to trace.
This is the third time this year that Safe wallet add-ons have been used to steal funds.
First, what is a Gnosis Safe?
Think of a Gnosis Safe as a bank locker that needs several keys to open. Companies, crypto funds and wealthy investors use it because no single person can move the money alone. That is why it has a reputation as one of the safest places to keep crypto.
Safe also lets owners plug in extra tools, called modules, that handle routine work automatically, such as moving funds to earn interest. The catch is that these tools can move money without asking for all those keys.
What went wrong
The wallet belonged to a big investor who had connected one of these automatic tools. That tool had a faulty security check. It was supposed to confirm who was giving the orders, and it didn’t do that properly.
The hackers noticed the flaw and used the tool to move the money into a trading pool they had created themselves. From there, they swapped it for other coins and walked away. The wallet owners never approved anything.
In simple terms, the locker was strong, but a side door had been left unlocked.
How it unfolded this year
May 25: About $3 million was taken from 86 Safe wallets in roughly two hours through a faulty add-on.
June 1: Hackers found a way past a safety feature in Gnosis Pay, the crypto debit card service built on Safe.
June 7: Gnosis Pay had normal card services working again for more than 99% of its users.
September 15: The $7.73 million theft happened, starting with one large transfer and followed by smaller ones over the next hour.
Why this should worry people
All three attacks follow the same pattern. The main wallet held up, but the extra tools attached to it failed. Security firms spotted this latest theft quickly, yet they still couldn’t stop it, because these transfers happen in seconds.
The fake trading pool was also a smart move by the hackers. It let them swap stolen coins on their own terms without depending on anyone else.
What happens next
We will likely see stricter checks before these add-ons can be connected to wallets. Limits on how much an add-on can move, and waiting periods before large transfers, may become standard. Wallet apps may also start warning users when a connected tool looks risky.
Conclusion
This theft doesn’t mean Gnosis Safe is broken. It does show that a wallet is only as safe as the weakest tool plugged into it. If you use a Safe, check which add-ons are connected today, and remove any you don’t recognise or no longer use.
This post Gnosis Safe Wallet Loses $7.7 Million, and Hackers Never Had to Crack It first appeared on BitcoinWorld.
Key Takeaways
Hackers stole about $7.73 million from one Gnosis Safe wallet on September 15, 2026.
They didn’t break the wallet itself. They got in through an add-on tool connected to it.
The stolen money was passed through a trading pool the hackers set up, which made it harder to trace.
This is the third time this year that Safe wallet add-ons have been used to steal funds.
First, what is a Gnosis Safe?
Think of a Gnosis Safe as a bank locker that needs several keys to open. Companies, crypto funds and wealthy investors use it because no single person can move the money alone. That is why it has a reputation as one of the safest places to keep crypto.
Safe also lets owners plug in extra tools, called modules, that handle routine work automatically, such as moving funds to earn interest. The catch is that these tools can move money without asking for all those keys.
What went wrong
The wallet belonged to a big investor who had connected one of these automatic tools. That tool had a faulty security check. It was supposed to confirm who was giving the orders, and it didn’t do that properly.
The hackers noticed the flaw and used the tool to move the money into a trading pool they had created themselves. From there, they swapped it for other coins and walked away. The wallet owners never approved anything.
In simple terms, the locker was strong, but a side door had been left unlocked.
How it unfolded this year
May 25: About $3 million was taken from 86 Safe wallets in roughly two hours through a faulty add-on.
June 1: Hackers found a way past a safety feature in Gnosis Pay, the crypto debit card service built on Safe.
June 7: Gnosis Pay had normal card services working again for more than 99% of its users.
September 15: The $7.73 million theft happened, starting with one large transfer and followed by smaller ones over the next hour.
Why this should worry people
All three attacks follow the same pattern. The main wallet held up, but the extra tools attached to it failed. Security firms spotted this latest theft quickly, yet they still couldn’t stop it, because these transfers happen in seconds.
The fake trading pool was also a smart move by the hackers. It let them swap stolen coins on their own terms without depending on anyone else.
What happens next
We will likely see stricter checks before these add-ons can be connected to wallets. Limits on how much an add-on can move, and waiting periods before large transfers, may become standard. Wallet apps may also start warning users when a connected tool looks risky.
Conclusion
This theft doesn’t mean Gnosis Safe is broken. It does show that a wallet is only as safe as the weakest tool plugged into it. If you use a Safe, check which add-ons are connected today, and remove any you don’t recognise or no longer use.
This post Gnosis Safe Wallet Loses $7.7 Million, and Hackers Never Had to Crack It first appeared on BitcoinWorld.
201
·
--
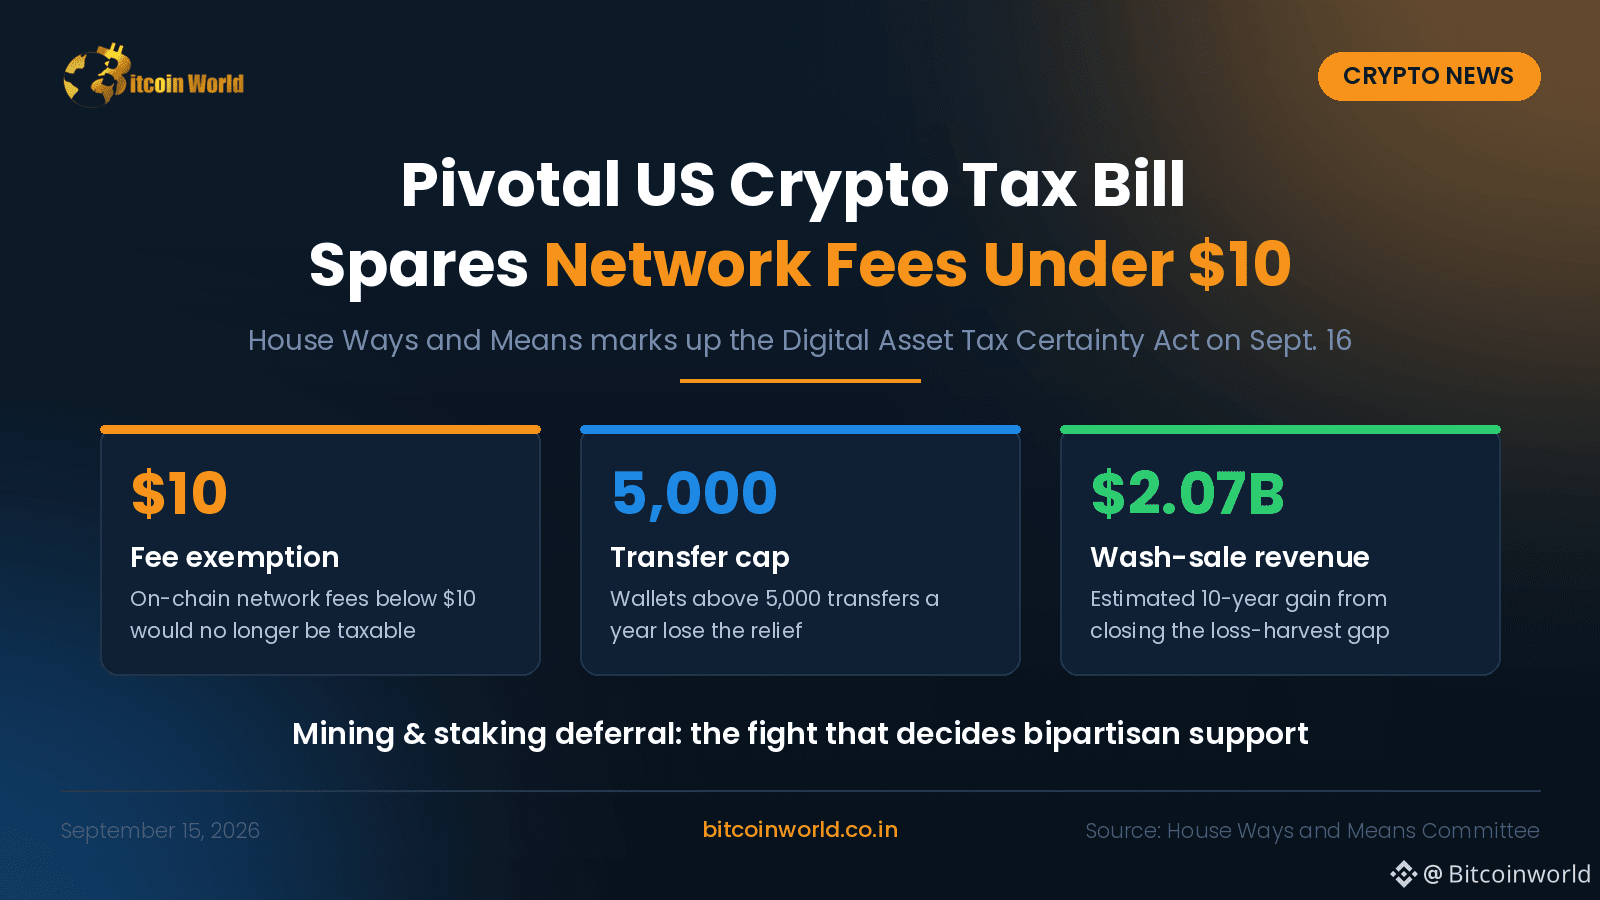
Article
Washington’s Crypto Tax Bill Targets the $2 Gas Fee Problem, and Delays the Harder FightsBitcoinWorldWashington’s Crypto Tax Bill Targets the $2 Gas Fee Problem, and Delays the Harder Fights
Key Takeaways
The House Ways and Means Committee has released H.R. 10357, the 114-page Digital Asset Tax Certainty Act, and will mark it up on September 16.
Blockchain network fees under $10 would no longer create a taxable event, but wallets with more than 5,000 transfers in the prior year would not get this relief.
Closing the crypto wash-sale gap would raise revenue, while deferring tax on mining and staking rewards would cost it. The deferral is the most likely provision to be cut.
The bill will probably not become law in 2026. Its real purpose is to set up the 2027 Congress.
Ask any American who has used Ethereum what makes crypto taxes painful, and many won’t mention their big trades. They’ll mention the small stuff. Under current rules, paying a network fee with a token counts as disposing of that token, so even a 40-cent gas payment can require a capital gain or loss calculation. For people who actually use crypto rather than just hold it, the paperwork can end up costing more than the transactions themselves.
House Ways and Means Chair Jason Smith’s new bill is the first serious attempt from Congress’s tax-writing committee to fix this.
Why it matters
The $10 fee exemption is small in dollar terms, but it removes a lot of friction. Swaps, bridges, and transfers all carry fees, so almost every active user benefits. The 5,000-transfer cutoff shows what lawmakers intend: they want to help ordinary users, not trading bots. High-frequency traders would stay under full reporting.
The exemption is also narrow. It appears to cover only on-chain network fees, not exchange trading fees or spreads. Crypto payments for everyday purchases still wouldn’t be tax-free. The bill doesn’t include the broad de minimis exemption for small purchases that the industry has long wanted.
Timeline
June 8, 2026: Reps. Carey and Arrington introduce H.R. 9172, which would apply wash-sale rules to digital assets.
June 9: Ways and Means hears testimony from Coinbase, Fidelity, Coin Center, and NYU’s Tax Law Center.
September 13: Reports say Republicans are considering dropping the mining and staking deferral.
September 14: The bill text is published. It draws on earlier bipartisan work by Reps. Horsford and Miller.
September 15: The Senate holds its cloture vote on the CLARITY Act.
September 16, 10 a.m. ET: Committee markup.
The trade-off inside the bill
The bill is structured as a revenue trade. Crypto traders can currently sell at a loss, buy the same asset back immediately, and still claim the deduction, which stock investors can’t do. Closing that gap is estimated to raise about $2.07 billion over a decade. Letting miners and stakers defer tax on newly created tokens until they sell them would cost about $2.96 billion.
That deferral is the provision to watch. Rep. Steven Horsford is the committee’s most outspoken Democratic supporter of crypto and a key swing vote. If Republicans remove the deferral or cap it at five years, they could lose his support. Either way, Wednesday’s vote will show whether crypto tax policy can remain bipartisan.
What comes next
The House goes on recess this week and won’t return until after the November election, so floor action this year is unlikely. Even so, a bill that has cleared committee gives the next Congress a starting point. The Treasury and IRS would then write the detailed rules. Watch whether the $10 threshold or the 5,000-transfer limit changes through amendments, since either would signal how generous the final law might be.
Conclusion
This bill won’t settle crypto taxation, but it changes the question from whether Congress will act to how the details will be written. The fee exemption helps everyday users. The wash-sale change brings crypto in line with stocks. The staking fight will show how much bipartisan support crypto actually has. The outcome of Wednesday’s markup will shape how 2027 begins.
This post Washington’s Crypto Tax Bill Targets the $2 Gas Fee Problem, and Delays the Harder Fights first appeared on BitcoinWorld.
Washington’s Crypto Tax Bill Targets the $2 Gas Fee Problem, and Delays the Harder Fights
BitcoinWorldWashington’s Crypto Tax Bill Targets the $2 Gas Fee Problem, and Delays the Harder Fights
Key Takeaways
The House Ways and Means Committee has released H.R. 10357, the 114-page Digital Asset Tax Certainty Act, and will mark it up on September 16.
Blockchain network fees under $10 would no longer create a taxable event, but wallets with more than 5,000 transfers in the prior year would not get this relief.
Closing the crypto wash-sale gap would raise revenue, while deferring tax on mining and staking rewards would cost it. The deferral is the most likely provision to be cut.
The bill will probably not become law in 2026. Its real purpose is to set up the 2027 Congress.
Ask any American who has used Ethereum what makes crypto taxes painful, and many won’t mention their big trades. They’ll mention the small stuff. Under current rules, paying a network fee with a token counts as disposing of that token, so even a 40-cent gas payment can require a capital gain or loss calculation. For people who actually use crypto rather than just hold it, the paperwork can end up costing more than the transactions themselves.
House Ways and Means Chair Jason Smith’s new bill is the first serious attempt from Congress’s tax-writing committee to fix this.
Why it matters
The $10 fee exemption is small in dollar terms, but it removes a lot of friction. Swaps, bridges, and transfers all carry fees, so almost every active user benefits. The 5,000-transfer cutoff shows what lawmakers intend: they want to help ordinary users, not trading bots. High-frequency traders would stay under full reporting.
The exemption is also narrow. It appears to cover only on-chain network fees, not exchange trading fees or spreads. Crypto payments for everyday purchases still wouldn’t be tax-free. The bill doesn’t include the broad de minimis exemption for small purchases that the industry has long wanted.
Timeline
June 8, 2026: Reps. Carey and Arrington introduce H.R. 9172, which would apply wash-sale rules to digital assets.
June 9: Ways and Means hears testimony from Coinbase, Fidelity, Coin Center, and NYU’s Tax Law Center.
September 13: Reports say Republicans are considering dropping the mining and staking deferral.
September 14: The bill text is published. It draws on earlier bipartisan work by Reps. Horsford and Miller.
September 15: The Senate holds its cloture vote on the CLARITY Act.
September 16, 10 a.m. ET: Committee markup.
The trade-off inside the bill
The bill is structured as a revenue trade. Crypto traders can currently sell at a loss, buy the same asset back immediately, and still claim the deduction, which stock investors can’t do. Closing that gap is estimated to raise about $2.07 billion over a decade. Letting miners and stakers defer tax on newly created tokens until they sell them would cost about $2.96 billion.
That deferral is the provision to watch. Rep. Steven Horsford is the committee’s most outspoken Democratic supporter of crypto and a key swing vote. If Republicans remove the deferral or cap it at five years, they could lose his support. Either way, Wednesday’s vote will show whether crypto tax policy can remain bipartisan.
What comes next
The House goes on recess this week and won’t return until after the November election, so floor action this year is unlikely. Even so, a bill that has cleared committee gives the next Congress a starting point. The Treasury and IRS would then write the detailed rules. Watch whether the $10 threshold or the 5,000-transfer limit changes through amendments, since either would signal how generous the final law might be.
Conclusion
This bill won’t settle crypto taxation, but it changes the question from whether Congress will act to how the details will be written. The fee exemption helps everyday users. The wash-sale change brings crypto in line with stocks. The staking fight will show how much bipartisan support crypto actually has. The outcome of Wednesday’s markup will shape how 2027 begins.
This post Washington’s Crypto Tax Bill Targets the $2 Gas Fee Problem, and Delays the Harder Fights first appeared on BitcoinWorld.
Key Takeaways
The House Ways and Means Committee has released H.R. 10357, the 114-page Digital Asset Tax Certainty Act, and will mark it up on September 16.
Blockchain network fees under $10 would no longer create a taxable event, but wallets with more than 5,000 transfers in the prior year would not get this relief.
Closing the crypto wash-sale gap would raise revenue, while deferring tax on mining and staking rewards would cost it. The deferral is the most likely provision to be cut.
The bill will probably not become law in 2026. Its real purpose is to set up the 2027 Congress.
Ask any American who has used Ethereum what makes crypto taxes painful, and many won’t mention their big trades. They’ll mention the small stuff. Under current rules, paying a network fee with a token counts as disposing of that token, so even a 40-cent gas payment can require a capital gain or loss calculation. For people who actually use crypto rather than just hold it, the paperwork can end up costing more than the transactions themselves.
House Ways and Means Chair Jason Smith’s new bill is the first serious attempt from Congress’s tax-writing committee to fix this.
Why it matters
The $10 fee exemption is small in dollar terms, but it removes a lot of friction. Swaps, bridges, and transfers all carry fees, so almost every active user benefits. The 5,000-transfer cutoff shows what lawmakers intend: they want to help ordinary users, not trading bots. High-frequency traders would stay under full reporting.
The exemption is also narrow. It appears to cover only on-chain network fees, not exchange trading fees or spreads. Crypto payments for everyday purchases still wouldn’t be tax-free. The bill doesn’t include the broad de minimis exemption for small purchases that the industry has long wanted.
Timeline
June 8, 2026: Reps. Carey and Arrington introduce H.R. 9172, which would apply wash-sale rules to digital assets.
June 9: Ways and Means hears testimony from Coinbase, Fidelity, Coin Center, and NYU’s Tax Law Center.
September 13: Reports say Republicans are considering dropping the mining and staking deferral.
September 14: The bill text is published. It draws on earlier bipartisan work by Reps. Horsford and Miller.
September 15: The Senate holds its cloture vote on the CLARITY Act.
September 16, 10 a.m. ET: Committee markup.
The trade-off inside the bill
The bill is structured as a revenue trade. Crypto traders can currently sell at a loss, buy the same asset back immediately, and still claim the deduction, which stock investors can’t do. Closing that gap is estimated to raise about $2.07 billion over a decade. Letting miners and stakers defer tax on newly created tokens until they sell them would cost about $2.96 billion.
That deferral is the provision to watch. Rep. Steven Horsford is the committee’s most outspoken Democratic supporter of crypto and a key swing vote. If Republicans remove the deferral or cap it at five years, they could lose his support. Either way, Wednesday’s vote will show whether crypto tax policy can remain bipartisan.
What comes next
The House goes on recess this week and won’t return until after the November election, so floor action this year is unlikely. Even so, a bill that has cleared committee gives the next Congress a starting point. The Treasury and IRS would then write the detailed rules. Watch whether the $10 threshold or the 5,000-transfer limit changes through amendments, since either would signal how generous the final law might be.
Conclusion
This bill won’t settle crypto taxation, but it changes the question from whether Congress will act to how the details will be written. The fee exemption helps everyday users. The wash-sale change brings crypto in line with stocks. The staking fight will show how much bipartisan support crypto actually has. The outcome of Wednesday’s markup will shape how 2027 begins.
This post Washington’s Crypto Tax Bill Targets the $2 Gas Fee Problem, and Delays the Harder Fights first appeared on BitcoinWorld.
242
·
--
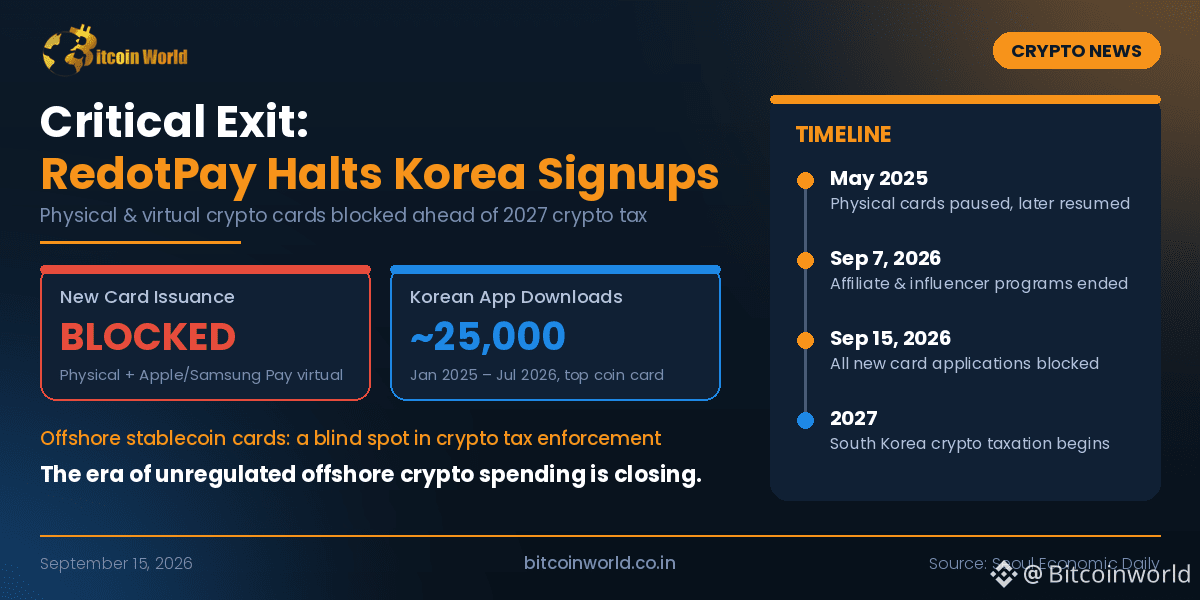
Article
RedotPay Shuts Its Door in South Korea As the Crypto Tax Clock TicksBitcoinWorldRedotPay Shuts Its Door in South Korea as the Crypto Tax Clock Ticks
Key Takeaways
RedotPay has stopped issuing both physical and virtual crypto cards to new users in South Korea.
The company ended its Korean affiliate and influencer referral programs on September 7, days before the block surfaced.
This is the platform’s second Korean pullback. The first, in May 2025, only covered physical cards.
The move comes just months before South Korea’s crypto taxation regime begins, and offshore stablecoin cards have been flagged as a tax-enforcement blind spot.
For many Korean crypto holders, RedotPay offered a simple way around the country’s strict separation between digital assets and everyday banking. You loaded Tether (USDT) into an app, added a virtual card to Apple Pay or Samsung Pay, and spent at any Visa merchant. That route is now closed to newcomers. Anyone in Korea who tries to apply is told that card applications are temporarily unavailable in their region.
Why this matters
The retreat itself is less important than when it happened. South Korea plans to begin taxing crypto gains next year. Stablecoin spending is taxable too, because every card swipe can quietly realize a gain. The problem for authorities is that transactions on an offshore Hong Kong platform cannot easily be tracked in real time. RedotPay was the most popular product in this category: its app was downloaded roughly 25,000 times in Korea between January 2025 and July 2026, more than any rival coin card.
RedotPay has not publicly explained its decision. The sequence of events, however, looks like a deliberate wind-down rather than a technical glitch. When a company cuts its marketing channels first and then closes onboarding, it usually expects regulatory friction and is limiting its exposure before that friction arrives.
Timeline
January 2025: RedotPay’s Korean download growth begins in the tracked period.
May 2025: New physical card issuance is halted in Korea. Virtual cards remain available.
Later in 2025: Physical card issuance resumes after several months.
July 2026: Korean downloads reach about 25,000.
September 7, 2026: Affiliate programs with partners and influencers are terminated.
September 15, 2026: Reports confirm a full block on new physical and virtual cards.
2027: South Korea’s crypto taxation is scheduled to take effect.
The expert view
Blocking virtual cards is the telling detail. Virtual cards are cheap to issue and were the product’s growth engine, so cutting them points to a compliance calculation rather than a cost-saving one. Offshore payment firms increasingly understand that serving a market without local licensing becomes riskier once tax authorities start looking for gaps.
What comes next
Existing users should expect closer scrutiny, and possibly future limits on how they use their current cards. Demand will not disappear, though. It is likely to shift toward smaller offshore competitors, peer-to-peer channels, or, ideally, domestic won-based stablecoin products operating inside Korea’s regulatory perimeter. Regulators may also press card networks such as Visa over how cross-border crypto spending is monitored.
Conclusion
RedotPay’s exit signals where Korea’s crypto market is heading. The era of loosely regulated offshore spending tools is ending, and oversight tied to taxation is taking its place. For users, convenience now carries compliance risk. For the industry, the message is that growth in Korea will increasingly depend on working with local regulators rather than around them.
This post RedotPay Shuts Its Door in South Korea as the Crypto Tax Clock Ticks first appeared on BitcoinWorld.
RedotPay Shuts Its Door in South Korea As the Crypto Tax Clock Ticks
BitcoinWorldRedotPay Shuts Its Door in South Korea as the Crypto Tax Clock Ticks
Key Takeaways
RedotPay has stopped issuing both physical and virtual crypto cards to new users in South Korea.
The company ended its Korean affiliate and influencer referral programs on September 7, days before the block surfaced.
This is the platform’s second Korean pullback. The first, in May 2025, only covered physical cards.
The move comes just months before South Korea’s crypto taxation regime begins, and offshore stablecoin cards have been flagged as a tax-enforcement blind spot.
For many Korean crypto holders, RedotPay offered a simple way around the country’s strict separation between digital assets and everyday banking. You loaded Tether (USDT) into an app, added a virtual card to Apple Pay or Samsung Pay, and spent at any Visa merchant. That route is now closed to newcomers. Anyone in Korea who tries to apply is told that card applications are temporarily unavailable in their region.
Why this matters
The retreat itself is less important than when it happened. South Korea plans to begin taxing crypto gains next year. Stablecoin spending is taxable too, because every card swipe can quietly realize a gain. The problem for authorities is that transactions on an offshore Hong Kong platform cannot easily be tracked in real time. RedotPay was the most popular product in this category: its app was downloaded roughly 25,000 times in Korea between January 2025 and July 2026, more than any rival coin card.
RedotPay has not publicly explained its decision. The sequence of events, however, looks like a deliberate wind-down rather than a technical glitch. When a company cuts its marketing channels first and then closes onboarding, it usually expects regulatory friction and is limiting its exposure before that friction arrives.
Timeline
January 2025: RedotPay’s Korean download growth begins in the tracked period.
May 2025: New physical card issuance is halted in Korea. Virtual cards remain available.
Later in 2025: Physical card issuance resumes after several months.
July 2026: Korean downloads reach about 25,000.
September 7, 2026: Affiliate programs with partners and influencers are terminated.
September 15, 2026: Reports confirm a full block on new physical and virtual cards.
2027: South Korea’s crypto taxation is scheduled to take effect.
The expert view
Blocking virtual cards is the telling detail. Virtual cards are cheap to issue and were the product’s growth engine, so cutting them points to a compliance calculation rather than a cost-saving one. Offshore payment firms increasingly understand that serving a market without local licensing becomes riskier once tax authorities start looking for gaps.
What comes next
Existing users should expect closer scrutiny, and possibly future limits on how they use their current cards. Demand will not disappear, though. It is likely to shift toward smaller offshore competitors, peer-to-peer channels, or, ideally, domestic won-based stablecoin products operating inside Korea’s regulatory perimeter. Regulators may also press card networks such as Visa over how cross-border crypto spending is monitored.
Conclusion
RedotPay’s exit signals where Korea’s crypto market is heading. The era of loosely regulated offshore spending tools is ending, and oversight tied to taxation is taking its place. For users, convenience now carries compliance risk. For the industry, the message is that growth in Korea will increasingly depend on working with local regulators rather than around them.
This post RedotPay Shuts Its Door in South Korea as the Crypto Tax Clock Ticks first appeared on BitcoinWorld.
Key Takeaways
RedotPay has stopped issuing both physical and virtual crypto cards to new users in South Korea.
The company ended its Korean affiliate and influencer referral programs on September 7, days before the block surfaced.
This is the platform’s second Korean pullback. The first, in May 2025, only covered physical cards.
The move comes just months before South Korea’s crypto taxation regime begins, and offshore stablecoin cards have been flagged as a tax-enforcement blind spot.
For many Korean crypto holders, RedotPay offered a simple way around the country’s strict separation between digital assets and everyday banking. You loaded Tether (USDT) into an app, added a virtual card to Apple Pay or Samsung Pay, and spent at any Visa merchant. That route is now closed to newcomers. Anyone in Korea who tries to apply is told that card applications are temporarily unavailable in their region.
Why this matters
The retreat itself is less important than when it happened. South Korea plans to begin taxing crypto gains next year. Stablecoin spending is taxable too, because every card swipe can quietly realize a gain. The problem for authorities is that transactions on an offshore Hong Kong platform cannot easily be tracked in real time. RedotPay was the most popular product in this category: its app was downloaded roughly 25,000 times in Korea between January 2025 and July 2026, more than any rival coin card.
RedotPay has not publicly explained its decision. The sequence of events, however, looks like a deliberate wind-down rather than a technical glitch. When a company cuts its marketing channels first and then closes onboarding, it usually expects regulatory friction and is limiting its exposure before that friction arrives.
Timeline
January 2025: RedotPay’s Korean download growth begins in the tracked period.
May 2025: New physical card issuance is halted in Korea. Virtual cards remain available.
Later in 2025: Physical card issuance resumes after several months.
July 2026: Korean downloads reach about 25,000.
September 7, 2026: Affiliate programs with partners and influencers are terminated.
September 15, 2026: Reports confirm a full block on new physical and virtual cards.
2027: South Korea’s crypto taxation is scheduled to take effect.
The expert view
Blocking virtual cards is the telling detail. Virtual cards are cheap to issue and were the product’s growth engine, so cutting them points to a compliance calculation rather than a cost-saving one. Offshore payment firms increasingly understand that serving a market without local licensing becomes riskier once tax authorities start looking for gaps.
What comes next
Existing users should expect closer scrutiny, and possibly future limits on how they use their current cards. Demand will not disappear, though. It is likely to shift toward smaller offshore competitors, peer-to-peer channels, or, ideally, domestic won-based stablecoin products operating inside Korea’s regulatory perimeter. Regulators may also press card networks such as Visa over how cross-border crypto spending is monitored.
Conclusion
RedotPay’s exit signals where Korea’s crypto market is heading. The era of loosely regulated offshore spending tools is ending, and oversight tied to taxation is taking its place. For users, convenience now carries compliance risk. For the industry, the message is that growth in Korea will increasingly depend on working with local regulators rather than around them.
This post RedotPay Shuts Its Door in South Korea as the Crypto Tax Clock Ticks first appeared on BitcoinWorld.
1
196
·
--

Article
BRICS Delhi Declaration 2026: I Read All 120 Paragraphs So You Don’t Have toBitcoinWorldBRICS Delhi Declaration 2026: I Read All 120 Paragraphs So You Don’t Have To
Key Takeaways
Leaders signed the New Delhi Declaration on 12 September 2026, with India in the chair.
India spent months selling a CBDC link. The word “CBDC” isn’t in the final text.
Paragraph 42 goes after illegal virtual asset flows and scam compounds.
Paragraph 95 flags quantum computing for the financial sector, which nobody is talking about yet.
Everyone is asking me what the Delhi Declaration is, so here it is plainly. It’s the joint statement BRICS heads of state agreed on at Bharat Mandapam, themed “Building for Resilience, Innovation, Cooperation and Sustainability.” It’s long, it’s dry, and it sets the bloc’s position for the next twelve months. That’s why I read it properly instead of reacting to headlines.
How we got here
Kazan, 2024: BRICS launches the Cross-Border Payments Initiative.
Rio, 2025: leaders back interoperability between national payment systems.
Late 2025: India takes over the chairship.
January 2026: the RBI proposes connecting member central bank digital currencies for trade and tourism, with currency swaps to handle imbalances.
February 2026: India hosts the AI Impact Summit, endorsed by 88 countries.
Through 2026: more than 400 meetings across 30 Indian cities feed the draft.
May 2026: the New Development Bank meets in Moscow.
10 September: Reuters reports India is still pushing the CBDC link against resistance.
11 September: India and Russia talk digital settlement as trade nears $60 billion.
12 September: adopted unanimously.
13 September: summit wraps.
So, is there crypto in it?
Yes, but not where people are looking.
Paragraph 90 is the payments paragraph. It notes the Payment Task Force’s work on interoperability and local-currency settlement, then adds that there’s no one-size-fits-all approach. I’ve read enough of these to know what that phrasing means. It means someone said no. There is no CBDC link and no shared token.
Paragraph 42 is the one that will actually affect your business. It puts illegal virtual asset flows in the same sentence as terror financing and money laundering, and names cross-border scam compounds exploiting payment rails.
Paragraph 95 is my quiet favourite. The Fintech Working Group is looking at quantum computing in finance. Give that five years.
My honest read
These documents move at the speed of the least willing member. China isn’t putting CIPS under a shared rail. Russia wants sanctions-proof settlement yesterday. The Gulf members are pegged to the dollar. Vague wording is what unanimity costs. Real de-dollarisation here is happening through bilateral invoicing, not a BRICS coin.
What I’m watching
NDB local-currency lending, the proposed Risk Lab at GIFT City, and paragraph 94’s quiet workshop on settlement and depositary systems.
Conclusion
Delhi gave us no crypto policy. It gave us a compliance signal and a stalled payments file. If you run an exchange in India, paragraph 42 reaches you long before paragraph 90 ever does.
This post BRICS Delhi Declaration 2026: I Read All 120 Paragraphs So You Don’t Have To first appeared on BitcoinWorld.
BRICS Delhi Declaration 2026: I Read All 120 Paragraphs So You Don’t Have to
BitcoinWorldBRICS Delhi Declaration 2026: I Read All 120 Paragraphs So You Don’t Have To
Key Takeaways
Leaders signed the New Delhi Declaration on 12 September 2026, with India in the chair.
India spent months selling a CBDC link. The word “CBDC” isn’t in the final text.
Paragraph 42 goes after illegal virtual asset flows and scam compounds.
Paragraph 95 flags quantum computing for the financial sector, which nobody is talking about yet.
Everyone is asking me what the Delhi Declaration is, so here it is plainly. It’s the joint statement BRICS heads of state agreed on at Bharat Mandapam, themed “Building for Resilience, Innovation, Cooperation and Sustainability.” It’s long, it’s dry, and it sets the bloc’s position for the next twelve months. That’s why I read it properly instead of reacting to headlines.
How we got here
Kazan, 2024: BRICS launches the Cross-Border Payments Initiative.
Rio, 2025: leaders back interoperability between national payment systems.
Late 2025: India takes over the chairship.
January 2026: the RBI proposes connecting member central bank digital currencies for trade and tourism, with currency swaps to handle imbalances.
February 2026: India hosts the AI Impact Summit, endorsed by 88 countries.
Through 2026: more than 400 meetings across 30 Indian cities feed the draft.
May 2026: the New Development Bank meets in Moscow.
10 September: Reuters reports India is still pushing the CBDC link against resistance.
11 September: India and Russia talk digital settlement as trade nears $60 billion.
12 September: adopted unanimously.
13 September: summit wraps.
So, is there crypto in it?
Yes, but not where people are looking.
Paragraph 90 is the payments paragraph. It notes the Payment Task Force’s work on interoperability and local-currency settlement, then adds that there’s no one-size-fits-all approach. I’ve read enough of these to know what that phrasing means. It means someone said no. There is no CBDC link and no shared token.
Paragraph 42 is the one that will actually affect your business. It puts illegal virtual asset flows in the same sentence as terror financing and money laundering, and names cross-border scam compounds exploiting payment rails.
Paragraph 95 is my quiet favourite. The Fintech Working Group is looking at quantum computing in finance. Give that five years.
My honest read
These documents move at the speed of the least willing member. China isn’t putting CIPS under a shared rail. Russia wants sanctions-proof settlement yesterday. The Gulf members are pegged to the dollar. Vague wording is what unanimity costs. Real de-dollarisation here is happening through bilateral invoicing, not a BRICS coin.
What I’m watching
NDB local-currency lending, the proposed Risk Lab at GIFT City, and paragraph 94’s quiet workshop on settlement and depositary systems.
Conclusion
Delhi gave us no crypto policy. It gave us a compliance signal and a stalled payments file. If you run an exchange in India, paragraph 42 reaches you long before paragraph 90 ever does.
This post BRICS Delhi Declaration 2026: I Read All 120 Paragraphs So You Don’t Have To first appeared on BitcoinWorld.
Key Takeaways
Leaders signed the New Delhi Declaration on 12 September 2026, with India in the chair.
India spent months selling a CBDC link. The word “CBDC” isn’t in the final text.
Paragraph 42 goes after illegal virtual asset flows and scam compounds.
Paragraph 95 flags quantum computing for the financial sector, which nobody is talking about yet.
Everyone is asking me what the Delhi Declaration is, so here it is plainly. It’s the joint statement BRICS heads of state agreed on at Bharat Mandapam, themed “Building for Resilience, Innovation, Cooperation and Sustainability.” It’s long, it’s dry, and it sets the bloc’s position for the next twelve months. That’s why I read it properly instead of reacting to headlines.
How we got here
Kazan, 2024: BRICS launches the Cross-Border Payments Initiative.
Rio, 2025: leaders back interoperability between national payment systems.
Late 2025: India takes over the chairship.
January 2026: the RBI proposes connecting member central bank digital currencies for trade and tourism, with currency swaps to handle imbalances.
February 2026: India hosts the AI Impact Summit, endorsed by 88 countries.
Through 2026: more than 400 meetings across 30 Indian cities feed the draft.
May 2026: the New Development Bank meets in Moscow.
10 September: Reuters reports India is still pushing the CBDC link against resistance.
11 September: India and Russia talk digital settlement as trade nears $60 billion.
12 September: adopted unanimously.
13 September: summit wraps.
So, is there crypto in it?
Yes, but not where people are looking.
Paragraph 90 is the payments paragraph. It notes the Payment Task Force’s work on interoperability and local-currency settlement, then adds that there’s no one-size-fits-all approach. I’ve read enough of these to know what that phrasing means. It means someone said no. There is no CBDC link and no shared token.
Paragraph 42 is the one that will actually affect your business. It puts illegal virtual asset flows in the same sentence as terror financing and money laundering, and names cross-border scam compounds exploiting payment rails.
Paragraph 95 is my quiet favourite. The Fintech Working Group is looking at quantum computing in finance. Give that five years.
My honest read
These documents move at the speed of the least willing member. China isn’t putting CIPS under a shared rail. Russia wants sanctions-proof settlement yesterday. The Gulf members are pegged to the dollar. Vague wording is what unanimity costs. Real de-dollarisation here is happening through bilateral invoicing, not a BRICS coin.
What I’m watching
NDB local-currency lending, the proposed Risk Lab at GIFT City, and paragraph 94’s quiet workshop on settlement and depositary systems.
Conclusion
Delhi gave us no crypto policy. It gave us a compliance signal and a stalled payments file. If you run an exchange in India, paragraph 42 reaches you long before paragraph 90 ever does.
This post BRICS Delhi Declaration 2026: I Read All 120 Paragraphs So You Don’t Have To first appeared on BitcoinWorld.
1
510
·
--
Article
LABITCONF 2026 Arrives With Its HODL EditionBitcoinWorld
LABITCONF 2026 arrives with its HODL edition
One of the most recognized Spanish-language events on Bitcoin, Blockchain, and now AI, returns to Buenos Aires to bring together thousands of people to learn, debate, and reflect on the impact and future of these technologies in our lives and businesses.
Buenos Aires, August 2026. For the fifth consecutive year, LABITCONF chooses Argentina to host its 14th edition. The region’s flagship conference and one of the world’s oldest on Bitcoin and Blockchain technology adds Artificial Intelligence this year as a key protagonist in its conversations.
LABITCONF 2026 Arrives With Its HODL Edition
BitcoinWorld
LABITCONF 2026 arrives with its HODL edition
One of the most recognized Spanish-language events on Bitcoin, Blockchain, and now AI, returns to Buenos Aires to bring together thousands of people to learn, debate, and reflect on the impact and future of these technologies in our lives and businesses.
Buenos Aires, August 2026. For the fifth consecutive year, LABITCONF chooses Argentina to host its 14th edition. The region’s flagship conference and one of the world’s oldest on Bitcoin and Blockchain technology adds Artificial Intelligence this year as a key protagonist in its conversations.
LABITCONF 2026 arrives with its HODL edition
One of the most recognized Spanish-language events on Bitcoin, Blockchain, and now AI, returns to Buenos Aires to bring together thousands of people to learn, debate, and reflect on the impact and future of these technologies in our lives and businesses.
Buenos Aires, August 2026. For the fifth consecutive year, LABITCONF chooses Argentina to host its 14th edition. The region’s flagship conference and one of the world’s oldest on Bitcoin and Blockchain technology adds Artificial Intelligence this year as a key protagonist in its conversations.
256
Log in to explore more content
Join global crypto users on Binance Square
⚡️ Get latest and useful information about crypto.
💬 Trusted by the world’s largest crypto exchange.
👍 Discover real insights from verified creators.
Email / Phone number
Trending Topics
BTCBreaks80K
163,143 views
2,643 Discussing
🚨₿ $BTC RECLAIMS $80K — BUT THE REAL BATTLE STARTS NOW! 🔥👀
#Bitcoin has pushed above $80,000, reaching around $80,703 in recent trading as market sentiment recovered despite rate-hike and regulatory concerns.
MarketWatch
+1
💥 BREAKOUT OR TRAP?
The $80K level is now a key area for traders to watch. Strong follow-through could sustain momentum, while profit-taking, leverage, and macroeconomic uncertainty may fuel sharp reversals.
🌊 THE RIPPLE EFFECT:
₿ BTC momentum may influence ETH and altcoin sentiment, but a broad rally isn't guaranteed.
🎯 THE BIG QUESTION: Is Bitcoin preparing for its next major move, or will the market demand a deeper correction first?
🔥 DON'T CHASE THE CANDLE — WATCH VOLUME, LIQUIDITY & MARKET STRUCTURE!
👑 MFI CRYPTO 🚀
💬 BTC ABOVE $85K NEXT? OR A SURPRISE PULLBACK?
#Bitcoin #BTC #Crypto #Altcoins #Ethereum #Trading #Binance #MFiCrypto
#btcbreaks80k
MFI crypto
·5 Likes
·2.8k views
BitcoinMarketCapTopsTesla
3,753 views
203 Discussing
SOLJumpsAbout10%
11,864 views
331 Discussing