
hazikusman
153 Posting

hazikusman
Laporkan
Blokir Pengguna
0 Mengikuti
7 Pengikut
20 Disukai
Posting
·
--
Lihat terjemahan
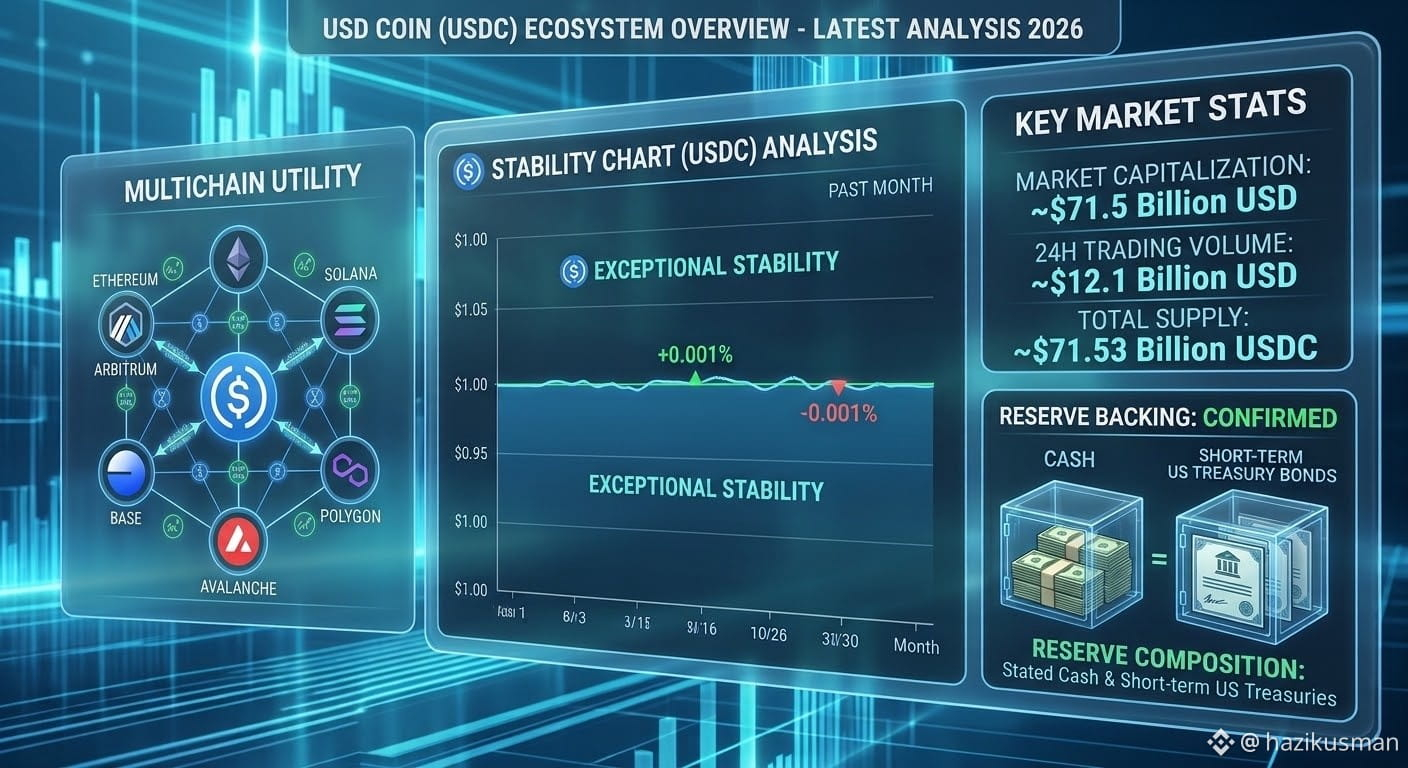
USDC maintains a remarkably stable peg, strictly adhering to the $1.00 USD value with negligible fluctuations. This stability is supported by a significant Market Capitalization, currently circulating at approximately $71.5 Billion USD, making it a vital pillar of liquidity for the entire decentralized finance (DeFi) sector.
Key Technical Pillars:
Fully Backed Reserves: USDC's primary metric of trust is its reserve backing. Monthly attestation reports confirm that USDC is 100% backed by a combination of cash and short-term US Treasury bonds, managed within the US regulatory framework.
Multichain Dominance: USDC has established strong interoperability, moving beyond its Ethereum roots to become a dominant native stablecoin on high-throughput networks like Solana, Polygon, and newer Layer-2 solutions. This cross-chain utility significantly reduces friction and transaction costs for users.
Outlook:
USDC remains the preferred asset for risk-averse institutional market participants and DeFi applications requiring a reliable store of value and unit of account. Future growth is likely to be driven by deeper integrations into traditional payment systems and the continued expansion of real-world asset (RWA) tokenization, where a trusted, stable digital currency is mandatory.
#BinanceSquareTalks #Write2Earn! #USDC
USDC maintains a remarkably stable peg, strictly adhering to the $1.00 USD value with negligible fluctuations. This stability is supported by a significant Market Capitalization, currently circulating at approximately $71.5 Billion USD, making it a vital pillar of liquidity for the entire decentralized finance (DeFi) sector.
Key Technical Pillars:
Fully Backed Reserves: USDC's primary metric of trust is its reserve backing. Monthly attestation reports confirm that USDC is 100% backed by a combination of cash and short-term US Treasury bonds, managed within the US regulatory framework.
Multichain Dominance: USDC has established strong interoperability, moving beyond its Ethereum roots to become a dominant native stablecoin on high-throughput networks like Solana, Polygon, and newer Layer-2 solutions. This cross-chain utility significantly reduces friction and transaction costs for users.
Outlook:
USDC remains the preferred asset for risk-averse institutional market participants and DeFi applications requiring a reliable store of value and unit of account. Future growth is likely to be driven by deeper integrations into traditional payment systems and the continued expansion of real-world asset (RWA) tokenization, where a trusted, stable digital currency is mandatory.
#BinanceSquareTalks #Write2Earn! #USDC
Key Technical Pillars:
Fully Backed Reserves: USDC's primary metric of trust is its reserve backing. Monthly attestation reports confirm that USDC is 100% backed by a combination of cash and short-term US Treasury bonds, managed within the US regulatory framework.
Multichain Dominance: USDC has established strong interoperability, moving beyond its Ethereum roots to become a dominant native stablecoin on high-throughput networks like Solana, Polygon, and newer Layer-2 solutions. This cross-chain utility significantly reduces friction and transaction costs for users.
Outlook:
USDC remains the preferred asset for risk-averse institutional market participants and DeFi applications requiring a reliable store of value and unit of account. Future growth is likely to be driven by deeper integrations into traditional payment systems and the continued expansion of real-world asset (RWA) tokenization, where a trusted, stable digital currency is mandatory.
#BinanceSquareTalks #Write2Earn! #USDC
2
·
--
Lihat terjemahan
$HYPE market is buzzing, and all eyes are back on the "Hype Coins." After a period of consolidation, retail sentiment is exploding, and several assets are flashing massive buy signals. If you are looking for momentum, this is where the action is.
🔍 Latest Market Analysis: What’s Moving?
We are seeing a massive rotation of capital into high-beta altcoins. The formula right now is simple: High Volume + Strong Community Sentiment = Explosive Price Action.
Sentiment Check: The "Fear & Greed Index" is moving towards Extreme Greed for speculative assets. Social media mentions for trending coins are at monthly highs.
Technicals: Many hype assets are breaking out of multiple-week Bull Pennants and Ascending Triangles on the 4H charts. When these charts break resistance with high volume, the moves are swift and violent.
🛡️ The Smart Hype Strategy:
Rule #1: Take Profits Regularly. Hype moves are fast. Do not get greedy. Set laddered profit targets.
Rule #2: Tight Stop-Losses. Protect your capital from the eventual dip. Never trade without a plan.
Rule #3: Confirm Volume. Never chase a pump that doesn't have rising buy volume to support it.
#Hyperium #Write2Earn! #BinanceSquareTalks #besttrader
$HYPE market is buzzing, and all eyes are back on the "Hype Coins." After a period of consolidation, retail sentiment is exploding, and several assets are flashing massive buy signals. If you are looking for momentum, this is where the action is.
🔍 Latest Market Analysis: What’s Moving?
We are seeing a massive rotation of capital into high-beta altcoins. The formula right now is simple: High Volume + Strong Community Sentiment = Explosive Price Action.
Sentiment Check: The "Fear & Greed Index" is moving towards Extreme Greed for speculative assets. Social media mentions for trending coins are at monthly highs.
Technicals: Many hype assets are breaking out of multiple-week Bull Pennants and Ascending Triangles on the 4H charts. When these charts break resistance with high volume, the moves are swift and violent.
🛡️ The Smart Hype Strategy:
Rule #1: Take Profits Regularly. Hype moves are fast. Do not get greedy. Set laddered profit targets.
Rule #2: Tight Stop-Losses. Protect your capital from the eventual dip. Never trade without a plan.
Rule #3: Confirm Volume. Never chase a pump that doesn't have rising buy volume to support it.
#Hyperium #Write2Earn! #BinanceSquareTalks #besttrader
🔍 Latest Market Analysis: What’s Moving?
We are seeing a massive rotation of capital into high-beta altcoins. The formula right now is simple: High Volume + Strong Community Sentiment = Explosive Price Action.
Sentiment Check: The "Fear & Greed Index" is moving towards Extreme Greed for speculative assets. Social media mentions for trending coins are at monthly highs.
Technicals: Many hype assets are breaking out of multiple-week Bull Pennants and Ascending Triangles on the 4H charts. When these charts break resistance with high volume, the moves are swift and violent.
🛡️ The Smart Hype Strategy:
Rule #1: Take Profits Regularly. Hype moves are fast. Do not get greedy. Set laddered profit targets.
Rule #2: Tight Stop-Losses. Protect your capital from the eventual dip. Never trade without a plan.
Rule #3: Confirm Volume. Never chase a pump that doesn't have rising buy volume to support it.
#Hyperium #Write2Earn! #BinanceSquareTalks #besttrader

33
·
--
Lihat terjemahan
Binance Trading Alert: Which Coins to Trade Right Now? 📈
Looking for the best setups on Binance today? Here is a quick market breakdown and strategy guide to help you catch the next big move:
🎯 Top Focus Areas on Binance:
The Market Leaders ($BTC & $ETH):
Always check the big picture first. Keep a close eye on Bitcoin and Ethereum price action to gauge overall market direction before entering altcoins.
High-Momentum Altcoins ($SOL,$SUI, etc.):
Focus on liquid, high-volume assets on Binance that are showing strong relative strength and clean chart structures for swing trades.
Patience Pays Off:
Don't chase green candles. Wait for retests of Key Support Levels or confirmed Breakouts on the 4H/Daily charts.
🛡️ Smart Trading Rules for Binance Futures & Spot:
🛑 Always use a Stop-Loss (SL): Protect your capital first; profits come second.
📊 Check the Indicators: Combine RSI, MACD, and Order Book depth for better entry confirmations.
🧠 Control Your Leverage: If trading futures, avoid over-leveraging—keep risk management tight.
#TopCryptoNews #Write2Earrn #BinanceSquareTalks #BinanceSquareFamily
Binance Trading Alert: Which Coins to Trade Right Now? 📈
Looking for the best setups on Binance today? Here is a quick market breakdown and strategy guide to help you catch the next big move:
🎯 Top Focus Areas on Binance:
The Market Leaders ($BTC & $ETH):
Always check the big picture first. Keep a close eye on Bitcoin and Ethereum price action to gauge overall market direction before entering altcoins.
High-Momentum Altcoins ($SOL,$SUI, etc.):
Focus on liquid, high-volume assets on Binance that are showing strong relative strength and clean chart structures for swing trades.
Patience Pays Off:
Don't chase green candles. Wait for retests of Key Support Levels or confirmed Breakouts on the 4H/Daily charts.
🛡️ Smart Trading Rules for Binance Futures & Spot:
🛑 Always use a Stop-Loss (SL): Protect your capital first; profits come second.
📊 Check the Indicators: Combine RSI, MACD, and Order Book depth for better entry confirmations.
🧠 Control Your Leverage: If trading futures, avoid over-leveraging—keep risk management tight.
#TopCryptoNews #Write2Earrn #BinanceSquareTalks #BinanceSquareFamily
Looking for the best setups on Binance today? Here is a quick market breakdown and strategy guide to help you catch the next big move:
🎯 Top Focus Areas on Binance:
The Market Leaders ($BTC & $ETH):
Always check the big picture first. Keep a close eye on Bitcoin and Ethereum price action to gauge overall market direction before entering altcoins.
High-Momentum Altcoins ($SOL,$SUI, etc.):
Focus on liquid, high-volume assets on Binance that are showing strong relative strength and clean chart structures for swing trades.
Patience Pays Off:
Don't chase green candles. Wait for retests of Key Support Levels or confirmed Breakouts on the 4H/Daily charts.
🛡️ Smart Trading Rules for Binance Futures & Spot:
🛑 Always use a Stop-Loss (SL): Protect your capital first; profits come second.
📊 Check the Indicators: Combine RSI, MACD, and Order Book depth for better entry confirmations.
🧠 Control Your Leverage: If trading futures, avoid over-leveraging—keep risk management tight.
#TopCryptoNews #Write2Earrn #BinanceSquareTalks #BinanceSquareFamily
33
·
--
Lihat terjemahan
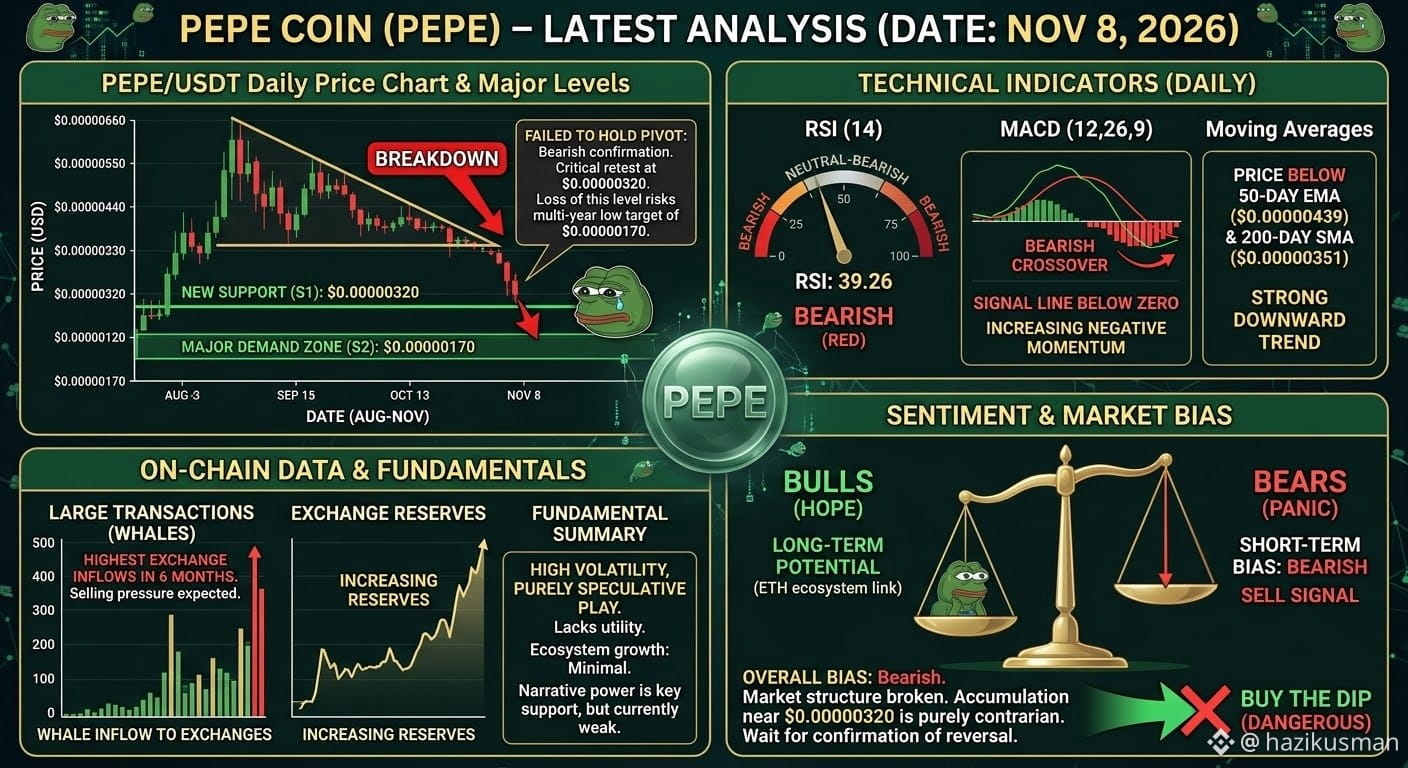
$PEPE is currently consolidating in the $0.0000048 – $0.0000049 range. Immediate resistance is located around $0.0000053 to $0.0000055. A clean breakout above this zone could trigger a rally toward the higher resistance cluster at $0.0000095. On the downside, primary support is established at $0.00000405 – $0.00000420.
Moving Averages & Trend Structure: PEPE continues to hold above its key moving averages, including the 50-day EMA ($0.00000420) and 200-day EMA ($0.00000388). This maintains a constructive, bullish medium-to-long-term trend structure despite short-term fluctuations.
Momentum Indicators:
RSI (14) is sitting at a neutral ~60.8, indicating steady buying interest without entering overbought territory.
MACD remains positive above the signal line, confirming active bullish momentum across daily timeframes.
Market Bias: Neutral short-term (range-bound), Bullish medium-term. Range-bound conditions favor accumulation near the $0.0000042 support level while keeping risk control tight due to elevated market volatility.
#writetoearn #BinanceSquareFamily #ToptrandingCoin #pepe⚡
$PEPE is currently consolidating in the $0.0000048 – $0.0000049 range. Immediate resistance is located around $0.0000053 to $0.0000055. A clean breakout above this zone could trigger a rally toward the higher resistance cluster at $0.0000095. On the downside, primary support is established at $0.00000405 – $0.00000420.
Moving Averages & Trend Structure: PEPE continues to hold above its key moving averages, including the 50-day EMA ($0.00000420) and 200-day EMA ($0.00000388). This maintains a constructive, bullish medium-to-long-term trend structure despite short-term fluctuations.
Momentum Indicators:
RSI (14) is sitting at a neutral ~60.8, indicating steady buying interest without entering overbought territory.
MACD remains positive above the signal line, confirming active bullish momentum across daily timeframes.
Market Bias: Neutral short-term (range-bound), Bullish medium-term. Range-bound conditions favor accumulation near the $0.0000042 support level while keeping risk control tight due to elevated market volatility.
#writetoearn #BinanceSquareFamily #ToptrandingCoin #pepe⚡
Moving Averages & Trend Structure: PEPE continues to hold above its key moving averages, including the 50-day EMA ($0.00000420) and 200-day EMA ($0.00000388). This maintains a constructive, bullish medium-to-long-term trend structure despite short-term fluctuations.
Momentum Indicators:
RSI (14) is sitting at a neutral ~60.8, indicating steady buying interest without entering overbought territory.
MACD remains positive above the signal line, confirming active bullish momentum across daily timeframes.
Market Bias: Neutral short-term (range-bound), Bullish medium-term. Range-bound conditions favor accumulation near the $0.0000042 support level while keeping risk control tight due to elevated market volatility.
#writetoearn #BinanceSquareFamily #ToptrandingCoin #pepe⚡
51
·
--
Lihat terjemahan
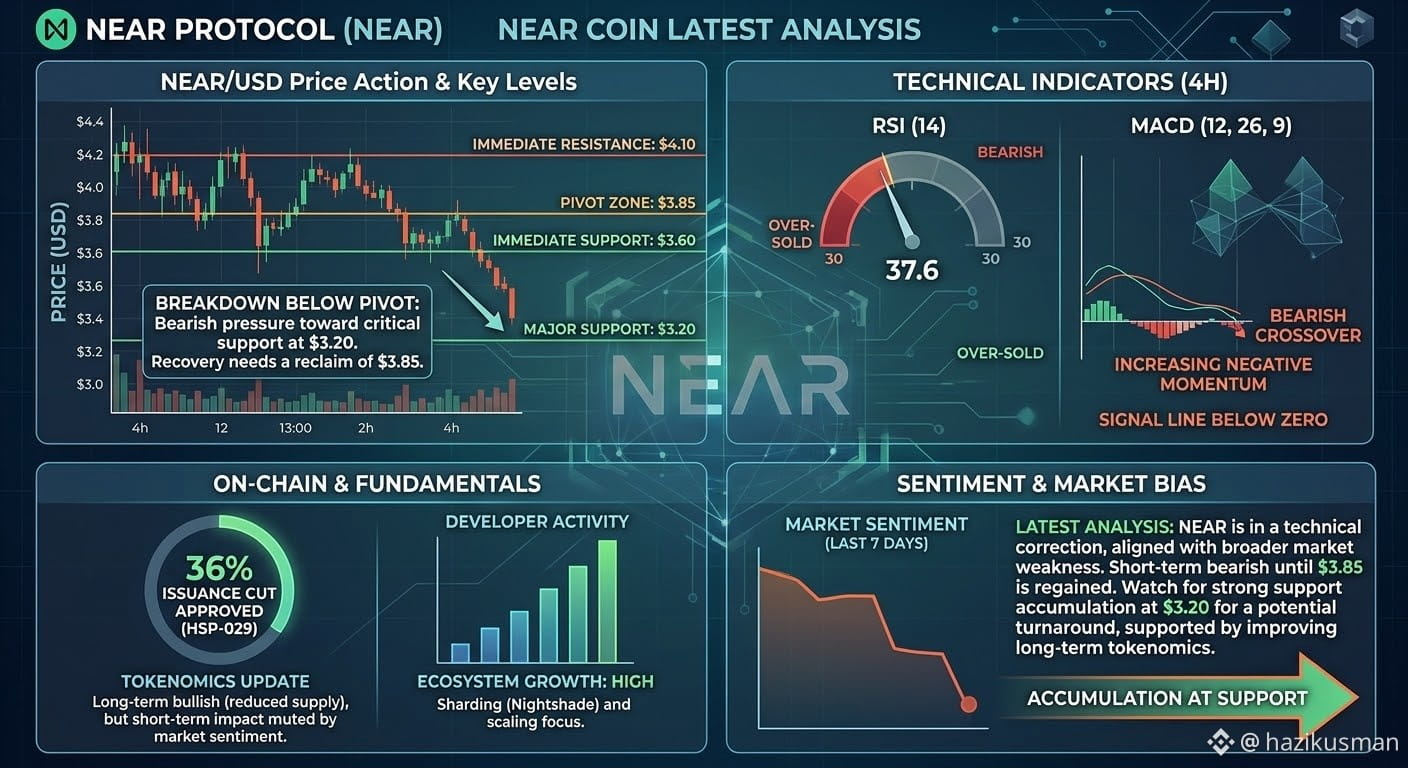
$NEAR has broken below its primary pivot range of $3.85, pulling back toward immediate support around $3.60. A failure to hold $3.60 opens the door for a retest of the strong demand zone at $3.20. Regaining $3.85 is essential to resume a bullish structure toward $4.10+.
Technical Indicators (4H): The 14-period RSI (~37–38) signals approaching over-sold conditions, suggesting momentum may slow down. Meanwhile, the MACD displays a bearish crossover below zero, confirming short-term downward pressure.
Fundamentals & Tokenomics: The approval of HSP-029 (a 36% annual issuance cut) improves long-term supply dynamics, providing strong structural support despite short-term market headwinds.
Market Bias: Neutral to Bearish short-term, Bullish medium-term. Accumulation near the $3.20–$3.60 support range offers potential value for long-term holders.
#besttranding #BinanceSquareTalks
#$NEAR
$NEAR has broken below its primary pivot range of $3.85, pulling back toward immediate support around $3.60. A failure to hold $3.60 opens the door for a retest of the strong demand zone at $3.20. Regaining $3.85 is essential to resume a bullish structure toward $4.10+.
Technical Indicators (4H): The 14-period RSI (~37–38) signals approaching over-sold conditions, suggesting momentum may slow down. Meanwhile, the MACD displays a bearish crossover below zero, confirming short-term downward pressure.
Fundamentals & Tokenomics: The approval of HSP-029 (a 36% annual issuance cut) improves long-term supply dynamics, providing strong structural support despite short-term market headwinds.
Market Bias: Neutral to Bearish short-term, Bullish medium-term. Accumulation near the $3.20–$3.60 support range offers potential value for long-term holders.
#besttranding #BinanceSquareTalks
#$NEAR
Technical Indicators (4H): The 14-period RSI (~37–38) signals approaching over-sold conditions, suggesting momentum may slow down. Meanwhile, the MACD displays a bearish crossover below zero, confirming short-term downward pressure.
Fundamentals & Tokenomics: The approval of HSP-029 (a 36% annual issuance cut) improves long-term supply dynamics, providing strong structural support despite short-term market headwinds.
Market Bias: Neutral to Bearish short-term, Bullish medium-term. Accumulation near the $3.20–$3.60 support range offers potential value for long-term holders.
#besttranding #BinanceSquareTalks
#$NEAR
66
·
--
Lihat terjemahan
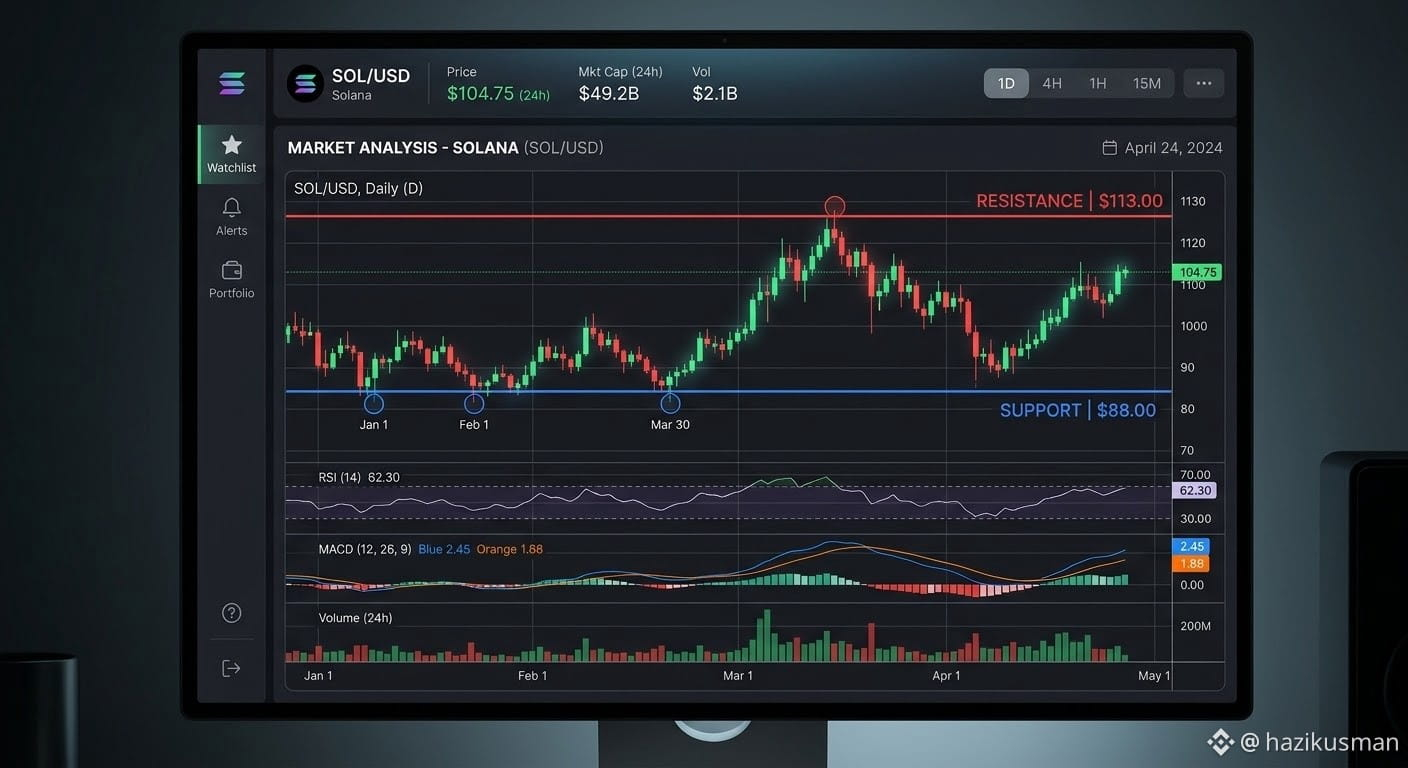
$SOL is trading near $89 - $90, experiencing short-term sell pressure in step with broader crypto market pullbacks. Following a decline over recent weeks, the market structure shows lower high patterns, putting key technical levels under test.
Key Technical Levels
Immediate Support Zone: $87.00 – $88.50 Holding this support floor is critical for buyers to prevent further downside risk toward the $80 psychological level.
Resistance Levels: $98.00 (Short-term) and $113.50 (Major Overhead) Reclaiming the $98 – $100 region is necessary to invalidate the short-term bearish trend and open a path back toward higher range targets around $113.40.
Market Outlook & Drivers
Sentiment: Bearish to neutral in the immediate short term, with 24-hour trading volumes reflecting consolidation rather than aggressive capitulation.
Recovery Forecast: Analysts project a potential baseline recovery into the $104 – $114 range by year-end if SOL consolidates above key moving averages.
#top Solana
#TrendingTopic #BinanceSquareTalks
$SOL is trading near $89 - $90, experiencing short-term sell pressure in step with broader crypto market pullbacks. Following a decline over recent weeks, the market structure shows lower high patterns, putting key technical levels under test.
Key Technical Levels
Immediate Support Zone: $87.00 – $88.50 Holding this support floor is critical for buyers to prevent further downside risk toward the $80 psychological level.
Resistance Levels: $98.00 (Short-term) and $113.50 (Major Overhead) Reclaiming the $98 – $100 region is necessary to invalidate the short-term bearish trend and open a path back toward higher range targets around $113.40.
Market Outlook & Drivers
Sentiment: Bearish to neutral in the immediate short term, with 24-hour trading volumes reflecting consolidation rather than aggressive capitulation.
Recovery Forecast: Analysts project a potential baseline recovery into the $104 – $114 range by year-end if SOL consolidates above key moving averages.
#top Solana
#TrendingTopic #BinanceSquareTalks
Key Technical Levels
Immediate Support Zone: $87.00 – $88.50 Holding this support floor is critical for buyers to prevent further downside risk toward the $80 psychological level.
Resistance Levels: $98.00 (Short-term) and $113.50 (Major Overhead) Reclaiming the $98 – $100 region is necessary to invalidate the short-term bearish trend and open a path back toward higher range targets around $113.40.
Market Outlook & Drivers
Sentiment: Bearish to neutral in the immediate short term, with 24-hour trading volumes reflecting consolidation rather than aggressive capitulation.
Recovery Forecast: Analysts project a potential baseline recovery into the $104 – $114 range by year-end if SOL consolidates above key moving averages.
#top Solana
#TrendingTopic #BinanceSquareTalks
79
·
--
Lihat terjemahan
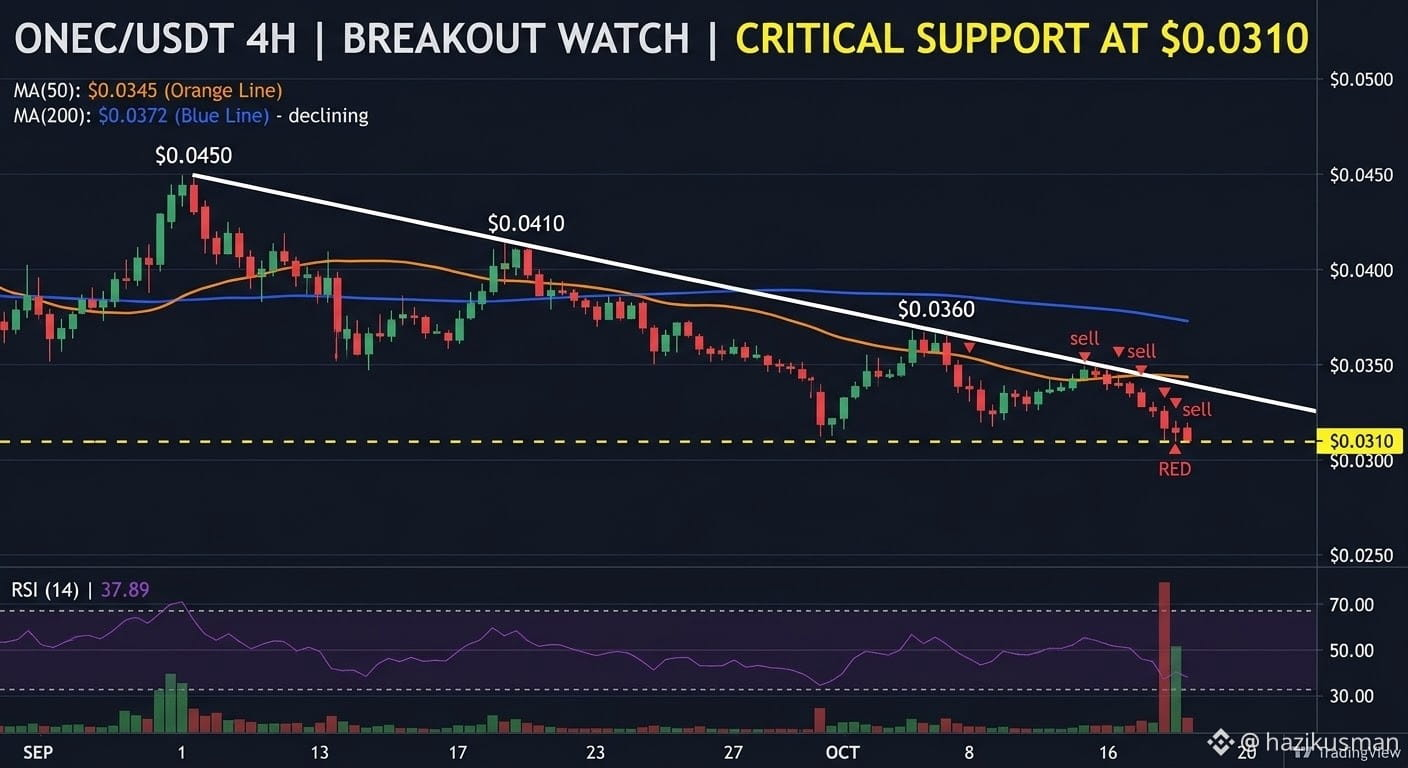
$ONE is trading around $0.000049 to $0.00010 with a low total market capitalization and modest 24-hour trading volume. The overall structure remains low-liquidity and range-bound.
Key Levels:
Resistance: Implied near the $0.00011 – $0.00017 horizontal supply ceiling where recent upside rejections occurred.
Support: Immediate demand sits near $0.000045 – $0.000085. A drop below this zone risks further downside expansion.
Technical Indicators:
RSI & MACD: Long-term momentum indicators reflect a weak/neutral profile with limited directional conviction, typical of micro-cap assets tracking broader crypto market sentiment.
Volume: Low daily volume indicates limited institutional involvement, making the price highly sensitive to single-order volatility.
$ONE is trading around $0.000049 to $0.00010 with a low total market capitalization and modest 24-hour trading volume. The overall structure remains low-liquidity and range-bound.
Key Levels:
Resistance: Implied near the $0.00011 – $0.00017 horizontal supply ceiling where recent upside rejections occurred.
Support: Immediate demand sits near $0.000045 – $0.000085. A drop below this zone risks further downside expansion.
Technical Indicators:
RSI & MACD: Long-term momentum indicators reflect a weak/neutral profile with limited directional conviction, typical of micro-cap assets tracking broader crypto market sentiment.
Volume: Low daily volume indicates limited institutional involvement, making the price highly sensitive to single-order volatility.
Key Levels:
Resistance: Implied near the $0.00011 – $0.00017 horizontal supply ceiling where recent upside rejections occurred.
Support: Immediate demand sits near $0.000045 – $0.000085. A drop below this zone risks further downside expansion.
Technical Indicators:
RSI & MACD: Long-term momentum indicators reflect a weak/neutral profile with limited directional conviction, typical of micro-cap assets tracking broader crypto market sentiment.
Volume: Low daily volume indicates limited institutional involvement, making the price highly sensitive to single-order volatility.
3
·
--
Lihat terjemahan
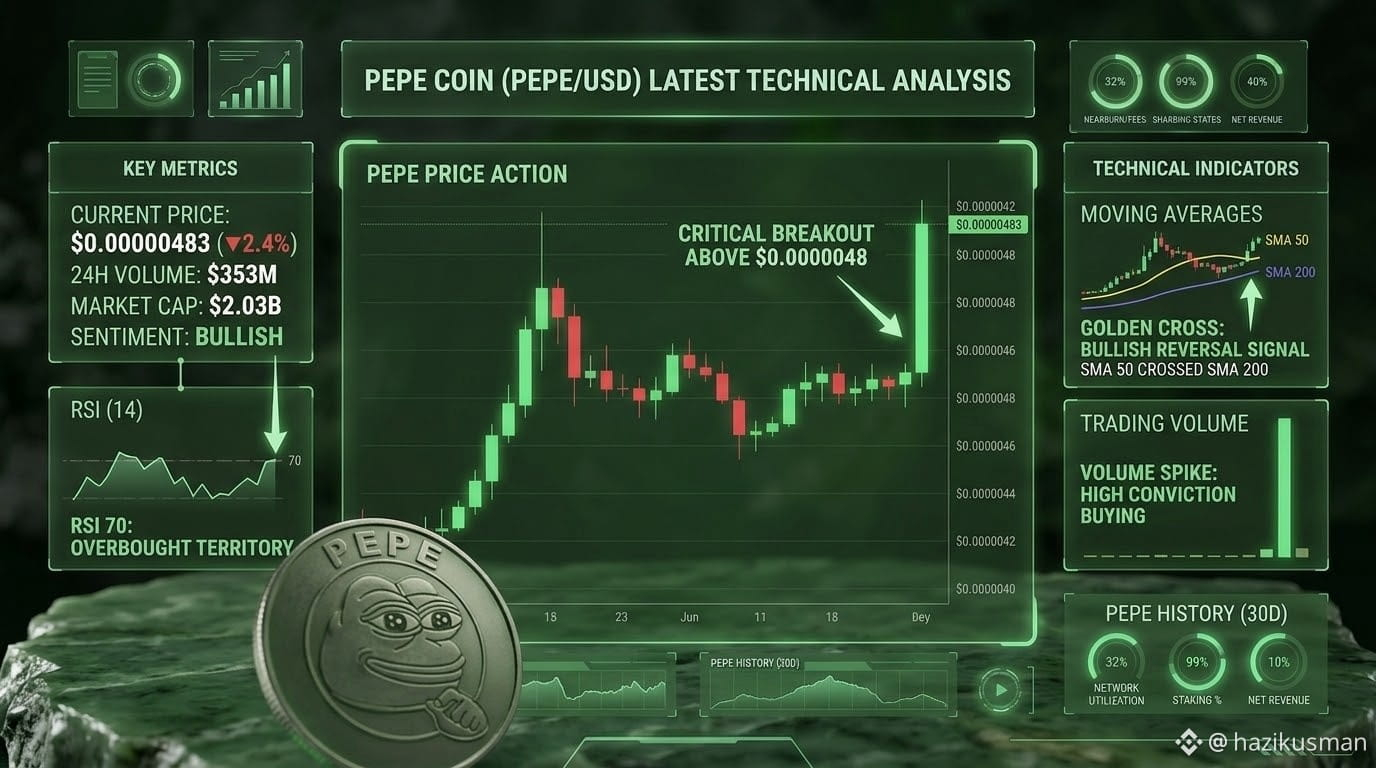
$PEPE (PEPE/USD) is exhibiting significant bullish momentum. The generated 30-day technical analysis infographic captures a critical breakout above the established resistance level of $0.0000048, which has triggered substantial buying conviction, evidenced by a massive spike in trading volume.
The analysis dashboard highlights two primary indicators of a bullish reversal: the successful breakout and a confirmed 'Golden Cross,' where the 50-day SMA has crossed above the 200-day SMA. With a current price of $0.00000483 and strong on-chain volume ($353M), PEPE's sentiment is firmly bullish, although the RSI at 70 indicates the asset has entered overbought territory in the short term, suggesting a potential consolidation or minor pullback.
$PEPE (PEPE/USD) is exhibiting significant bullish momentum. The generated 30-day technical analysis infographic captures a critical breakout above the established resistance level of $0.0000048, which has triggered substantial buying conviction, evidenced by a massive spike in trading volume.
The analysis dashboard highlights two primary indicators of a bullish reversal: the successful breakout and a confirmed 'Golden Cross,' where the 50-day SMA has crossed above the 200-day SMA. With a current price of $0.00000483 and strong on-chain volume ($353M), PEPE's sentiment is firmly bullish, although the RSI at 70 indicates the asset has entered overbought territory in the short term, suggesting a potential consolidation or minor pullback.
The analysis dashboard highlights two primary indicators of a bullish reversal: the successful breakout and a confirmed 'Golden Cross,' where the 50-day SMA has crossed above the 200-day SMA. With a current price of $0.00000483 and strong on-chain volume ($353M), PEPE's sentiment is firmly bullish, although the RSI at 70 indicates the asset has entered overbought territory in the short term, suggesting a potential consolidation or minor pullback.
5
·
--
$NEAR saat ini diperdagangkan di kisaran $3.70 – $3.76 USD, bergerak konsolidatif setelah pengujian ulang pasar secara luas baru-baru ini. Meskipun fluktuasi makro jangka pendek membuat pergerakan harga tetap terbatas dalam kisaran $3.50 – $3.75, indikator teknikal harian menunjukkan tanda-tanda awal peralihan momentum bullish yang didukung oleh persilangan penting pada moving average.
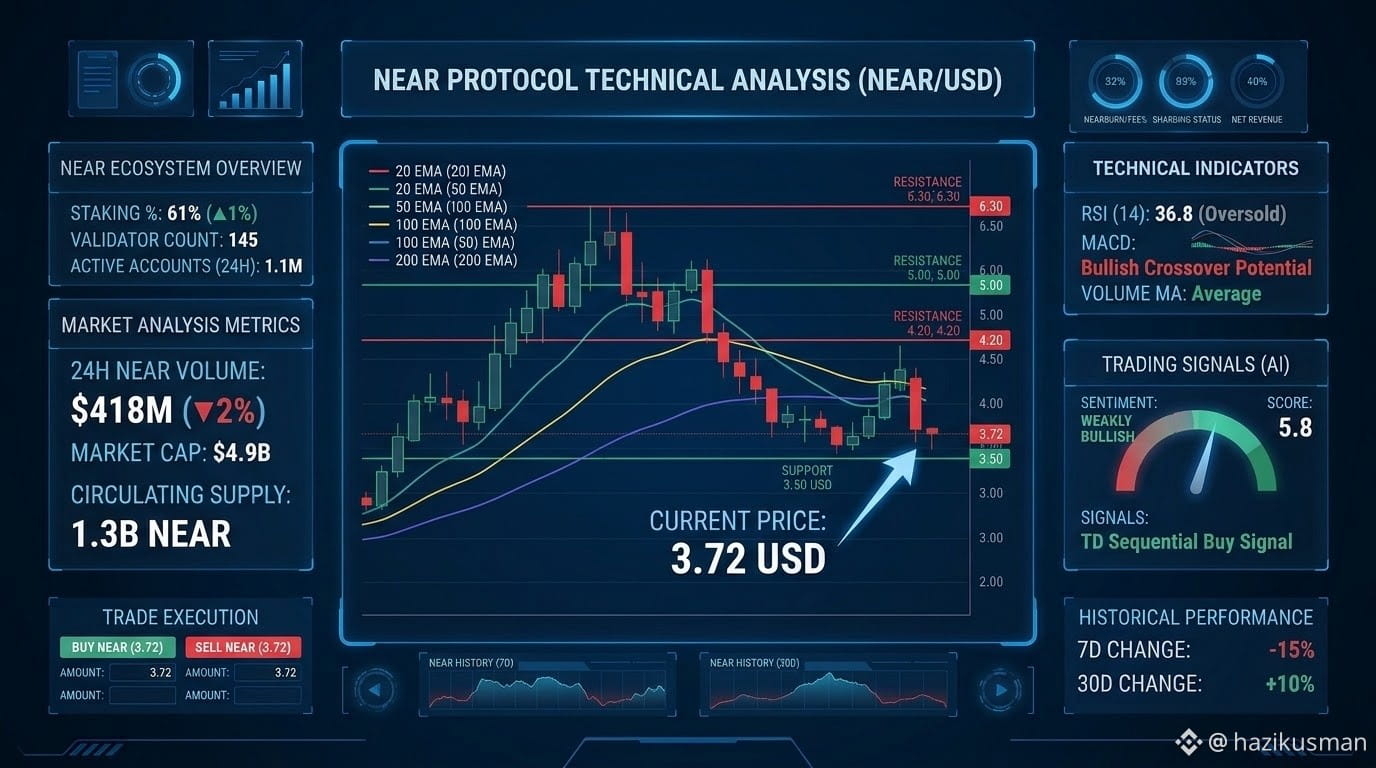
Grafik Analisis Teknikal NEAR Protocol (NEAR/USD) yang menampilkan harga di sekitar $3.72 USD beserta level support, resistance, dan indikator teknikal utama. (Visual yang dihasilkan berdasarkan data pasar)
Metrik Pasar Utama & Ringkasan
Harga Saat Ini: ~$3.72 USD
Volume Perdagangan 24 Jam: ~$410M – $430M USD
Kapitalisasi Pasar: ~$4.91B USD (Peringkat #19)
Zona Support Terdekat: $3.50 – $3.63 USD
Zona Resistance Terdekat: $3.95 – $4.20 USD
Ringkasan Teknikal: Netral hingga Bullish (RSI di sekitar 36.8 [pemulihan dari kondisi jenuh jual], EMA 50 hari di ~$3.33 memberikan support dasar yang kuat)
Poin Penting & Prospek
Pertahanan Support Dasar: NEAR berulang kali mempertahankan zona permintaan $3.50 – $3.60. Bertahan di atas batas bawah ini sangat penting untuk menjaga kekuatan struktural menuju target-target utama di atas.
Posisi Moving Average: EMA 50 hari (~$3.33) bertahan kokoh di bawah harga saat ini, memberikan dukungan tren yang jelas, sementara EMA 200 hari (~$6.32) menjadi sasaran resistance makro utama jangka panjang.
Ekosistem & Katalis AI: Posisi NEAR sebagai blockchain Layer-1 native AI, ditambah keterlibatan institusional yang stabil, terus mendorong adopsi pengguna dan memberikan fondasi fundamental yang kuat bagi potensi kenaikan setelah likuiditas pasar secara luas membaik.
$NEAR saat ini diperdagangkan di kisaran $3.70 – $3.76 USD, bergerak konsolidatif setelah pengujian ulang pasar secara luas baru-baru ini. Meskipun fluktuasi makro jangka pendek membuat pergerakan harga tetap terbatas dalam kisaran $3.50 – $3.75, indikator teknikal harian menunjukkan tanda-tanda awal peralihan momentum bullish yang didukung oleh persilangan penting pada moving average.
Grafik Analisis Teknikal NEAR Protocol (NEAR/USD) yang menampilkan harga di sekitar $3.72 USD beserta level support, resistance, dan indikator teknikal utama. (Visual yang dihasilkan berdasarkan data pasar)
Metrik Pasar Utama & Ringkasan
Harga Saat Ini: ~$3.72 USD
Volume Perdagangan 24 Jam: ~$410M – $430M USD
Kapitalisasi Pasar: ~$4.91B USD (Peringkat #19)
Zona Support Terdekat: $3.50 – $3.63 USD
Zona Resistance Terdekat: $3.95 – $4.20 USD
Ringkasan Teknikal: Netral hingga Bullish (RSI di sekitar 36.8 [pemulihan dari kondisi jenuh jual], EMA 50 hari di ~$3.33 memberikan support dasar yang kuat)
Poin Penting & Prospek
Pertahanan Support Dasar: NEAR berulang kali mempertahankan zona permintaan $3.50 – $3.60. Bertahan di atas batas bawah ini sangat penting untuk menjaga kekuatan struktural menuju target-target utama di atas.
Posisi Moving Average: EMA 50 hari (~$3.33) bertahan kokoh di bawah harga saat ini, memberikan dukungan tren yang jelas, sementara EMA 200 hari (~$6.32) menjadi sasaran resistance makro utama jangka panjang.
Ekosistem & Katalis AI: Posisi NEAR sebagai blockchain Layer-1 native AI, ditambah keterlibatan institusional yang stabil, terus mendorong adopsi pengguna dan memberikan fondasi fundamental yang kuat bagi potensi kenaikan setelah likuiditas pasar secara luas membaik.
Grafik Analisis Teknikal NEAR Protocol (NEAR/USD) yang menampilkan harga di sekitar $3.72 USD beserta level support, resistance, dan indikator teknikal utama. (Visual yang dihasilkan berdasarkan data pasar)
Metrik Pasar Utama & Ringkasan
Harga Saat Ini: ~$3.72 USD
Volume Perdagangan 24 Jam: ~$410M – $430M USD
Kapitalisasi Pasar: ~$4.91B USD (Peringkat #19)
Zona Support Terdekat: $3.50 – $3.63 USD
Zona Resistance Terdekat: $3.95 – $4.20 USD
Ringkasan Teknikal: Netral hingga Bullish (RSI di sekitar 36.8 [pemulihan dari kondisi jenuh jual], EMA 50 hari di ~$3.33 memberikan support dasar yang kuat)
Poin Penting & Prospek
Pertahanan Support Dasar: NEAR berulang kali mempertahankan zona permintaan $3.50 – $3.60. Bertahan di atas batas bawah ini sangat penting untuk menjaga kekuatan struktural menuju target-target utama di atas.
Posisi Moving Average: EMA 50 hari (~$3.33) bertahan kokoh di bawah harga saat ini, memberikan dukungan tren yang jelas, sementara EMA 200 hari (~$6.32) menjadi sasaran resistance makro utama jangka panjang.
Ekosistem & Katalis AI: Posisi NEAR sebagai blockchain Layer-1 native AI, ditambah keterlibatan institusional yang stabil, terus mendorong adopsi pengguna dan memberikan fondasi fundamental yang kuat bagi potensi kenaikan setelah likuiditas pasar secara luas membaik.
6
·
--
Lihat terjemahan
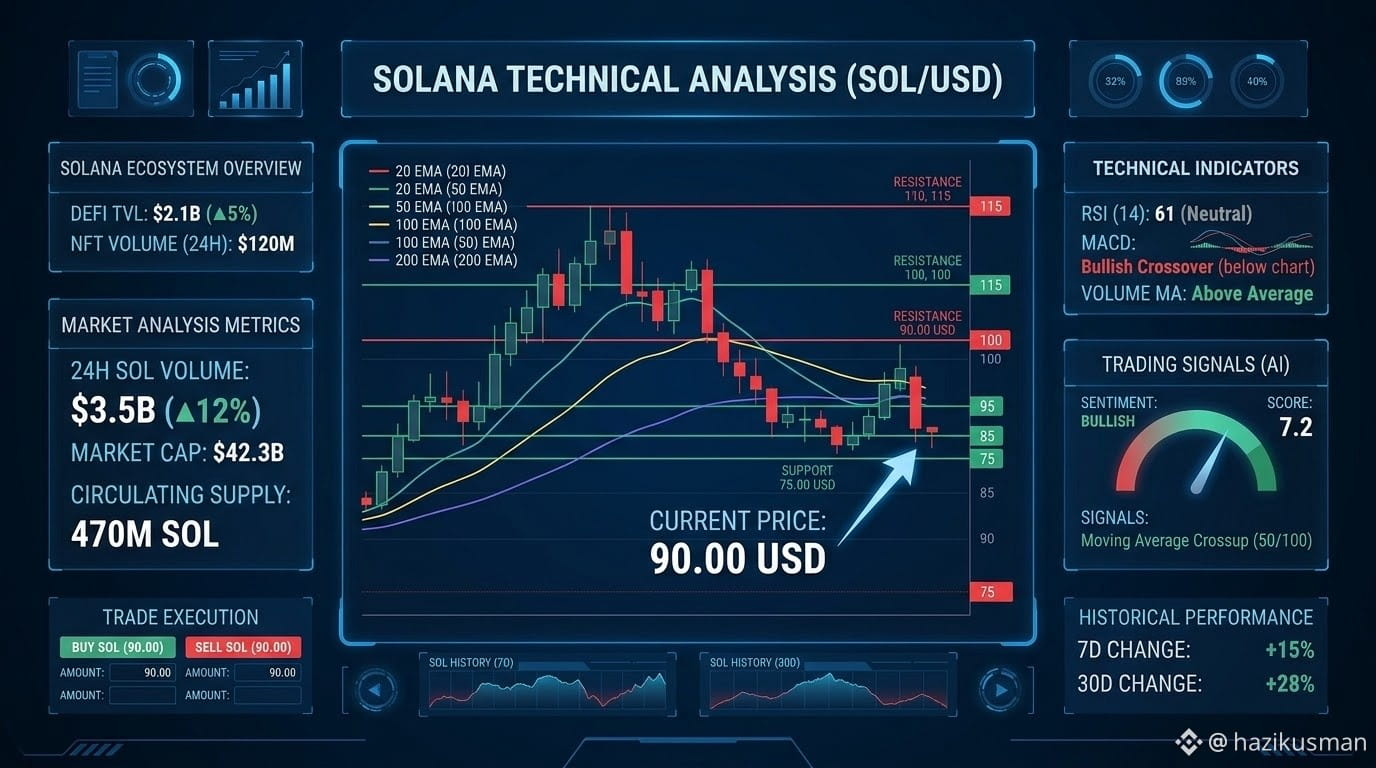
$SOL is currently testing a critical structural boundary as market volatility accelerates. After pulling back toward the $89 – $90 range, the asset is hovering directly near key long-term moving averages.
Current Price: ~$89.00 – $90.50 USD
200-Day Moving Average: ~$88.90 (Serving as primary macro support)
Immediate Support Zone: $87.50 – $89.00
Key Resistance Levels: $95.50 (Short-term hurdle) and $98.70 (100-Day MA)
50-Day Moving Average: ~$108.60 (Required for structural trend reversal)
Key Takeaways & Outlook
200-Day MA Defense: Solana is aggressively testing its 200-day moving average near $88.90. Holding this zone is essential for bulls to prevent deeper drawdowns toward secondary support at $77.00.
On-Chain Fundamentals: Network engagement remains high with robust decentralized exchange (DEX) volume performance relative to market cap, despite recent broader market liquidations and ETF outflows impacting spot momentum.
Trader Focus: A daily close above $98.70 (100-Day MA) would mark the first concrete technical signal of a bullish pivot back toward the $100+ range.
$SOL is currently testing a critical structural boundary as market volatility accelerates. After pulling back toward the $89 – $90 range, the asset is hovering directly near key long-term moving averages.
Current Price: ~$89.00 – $90.50 USD
200-Day Moving Average: ~$88.90 (Serving as primary macro support)
Immediate Support Zone: $87.50 – $89.00
Key Resistance Levels: $95.50 (Short-term hurdle) and $98.70 (100-Day MA)
50-Day Moving Average: ~$108.60 (Required for structural trend reversal)
Key Takeaways & Outlook
200-Day MA Defense: Solana is aggressively testing its 200-day moving average near $88.90. Holding this zone is essential for bulls to prevent deeper drawdowns toward secondary support at $77.00.
On-Chain Fundamentals: Network engagement remains high with robust decentralized exchange (DEX) volume performance relative to market cap, despite recent broader market liquidations and ETF outflows impacting spot momentum.
Trader Focus: A daily close above $98.70 (100-Day MA) would mark the first concrete technical signal of a bullish pivot back toward the $100+ range.
Current Price: ~$89.00 – $90.50 USD
200-Day Moving Average: ~$88.90 (Serving as primary macro support)
Immediate Support Zone: $87.50 – $89.00
Key Resistance Levels: $95.50 (Short-term hurdle) and $98.70 (100-Day MA)
50-Day Moving Average: ~$108.60 (Required for structural trend reversal)
Key Takeaways & Outlook
200-Day MA Defense: Solana is aggressively testing its 200-day moving average near $88.90. Holding this zone is essential for bulls to prevent deeper drawdowns toward secondary support at $77.00.
On-Chain Fundamentals: Network engagement remains high with robust decentralized exchange (DEX) volume performance relative to market cap, despite recent broader market liquidations and ETF outflows impacting spot momentum.
Trader Focus: A daily close above $98.70 (100-Day MA) would mark the first concrete technical signal of a bullish pivot back toward the $100+ range.
·
--
Lihat terjemahan
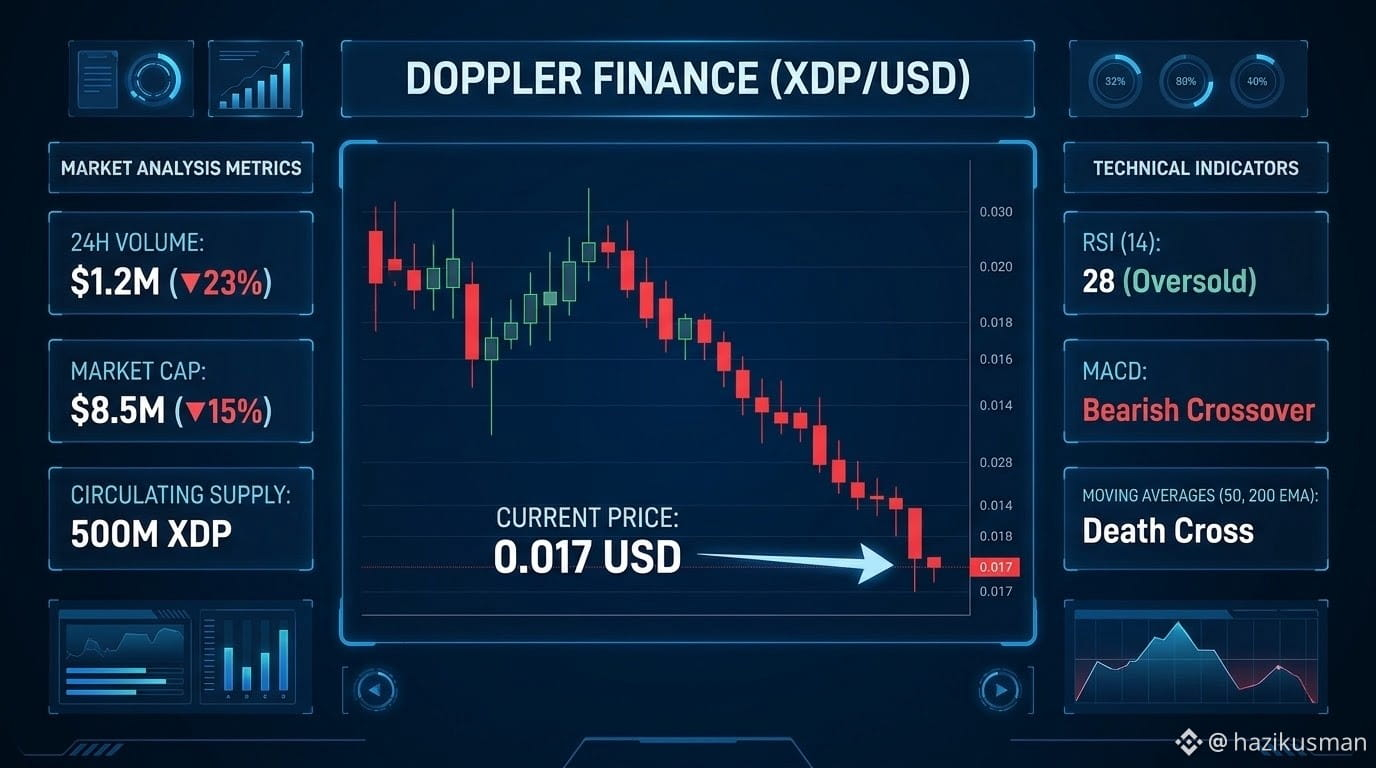
$XDP is currently undergoing a consolidation phase following its late-September price discovery run. The token has settled into a narrow trading channel as early market volatility cools down.
Key Technical Indicators & Price Snapshot
Current Trading Price: ~$0.017 – $0.018 USD
24-Hour Change: -1.4% to -6.0% (slight short-term downside pressure)
Circulating Supply: 1.0 Billion XDP (out of 10B Max Supply)
Key Support Level: $0.0160 – $0.0170 (Defending near recent all-time lows)
Key Resistance Zone: $0.0195 – $0.0230 (First hurdle before any bullish reversal)
Short-Term Outlook & Summary
Bearish Range-Bound Trajectory: XDP has pulled back substantially from its post-launch peak near $0.044. Lower volume indicates reduced speculative interest, making the token range-bound between $0.017 and $0.020.
Downside Risks: With only 10% of the total supply currently in circulation, token unlocks and utility adoption speed remain the primary long-term factors for price retention.
Traders' Strategy: Short-term traders are keeping a close watch on the $0.016 support line. A strong bounce above $0.0195 would be required to shift market sentiment back to neutral-bullish.
$XDP is currently undergoing a consolidation phase following its late-September price discovery run. The token has settled into a narrow trading channel as early market volatility cools down.
Key Technical Indicators & Price Snapshot
Current Trading Price: ~$0.017 – $0.018 USD
24-Hour Change: -1.4% to -6.0% (slight short-term downside pressure)
Circulating Supply: 1.0 Billion XDP (out of 10B Max Supply)
Key Support Level: $0.0160 – $0.0170 (Defending near recent all-time lows)
Key Resistance Zone: $0.0195 – $0.0230 (First hurdle before any bullish reversal)
Short-Term Outlook & Summary
Bearish Range-Bound Trajectory: XDP has pulled back substantially from its post-launch peak near $0.044. Lower volume indicates reduced speculative interest, making the token range-bound between $0.017 and $0.020.
Downside Risks: With only 10% of the total supply currently in circulation, token unlocks and utility adoption speed remain the primary long-term factors for price retention.
Traders' Strategy: Short-term traders are keeping a close watch on the $0.016 support line. A strong bounce above $0.0195 would be required to shift market sentiment back to neutral-bullish.
Key Technical Indicators & Price Snapshot
Current Trading Price: ~$0.017 – $0.018 USD
24-Hour Change: -1.4% to -6.0% (slight short-term downside pressure)
Circulating Supply: 1.0 Billion XDP (out of 10B Max Supply)
Key Support Level: $0.0160 – $0.0170 (Defending near recent all-time lows)
Key Resistance Zone: $0.0195 – $0.0230 (First hurdle before any bullish reversal)
Short-Term Outlook & Summary
Bearish Range-Bound Trajectory: XDP has pulled back substantially from its post-launch peak near $0.044. Lower volume indicates reduced speculative interest, making the token range-bound between $0.017 and $0.020.
Downside Risks: With only 10% of the total supply currently in circulation, token unlocks and utility adoption speed remain the primary long-term factors for price retention.
Traders' Strategy: Short-term traders are keeping a close watch on the $0.016 support line. A strong bounce above $0.0195 would be required to shift market sentiment back to neutral-bullish.
37
·
--
Lihat terjemahan
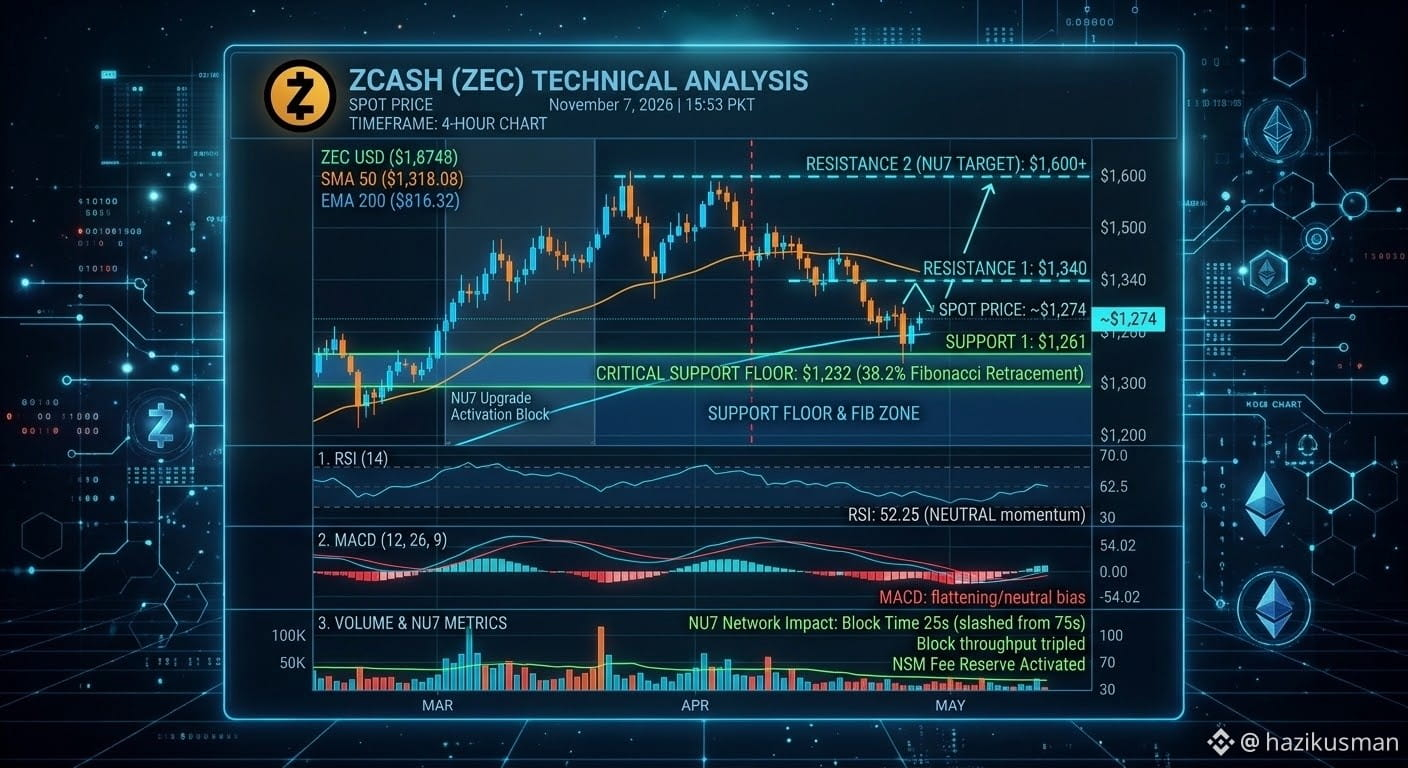
$ZEC is trading around $1,261 – $1,287, experiencing a brief cooling period following recent volatility tied to the network's major NU7 upgrade rollout and broader market liquidations. Despite near-term digestion, ZEC maintains a robust multi-month structure, bolstered by institutional interest (including spot ETP/ETF product frameworks) and reduced block times from the NU7 activation.
NU7 Network Upgrade: The recent activation successfully slashed block confirmation times to 25 seconds and introduced the Network Sustainability Mechanism, creating strong long-term fundamental tailwinds despite minor transitional debates.
Institutional Context: ZEC continues to benefit from wider regulated visibility via privacy-focused ETP/ETF products, positioning it uniquely among layer-1 privacy assets.
Bullish Scenario: Sustained defense of the $1,261 support zone sets the stage for a push back through $1,340, paving a clear path toward retesting multi-week highs near $1,600+.
Bearish Scenario: A decisive daily close below $1,230 risks an extended correction toward deeper Fibonacci support anchors around $1,180.
$ZEC is trading around $1,261 – $1,287, experiencing a brief cooling period following recent volatility tied to the network's major NU7 upgrade rollout and broader market liquidations. Despite near-term digestion, ZEC maintains a robust multi-month structure, bolstered by institutional interest (including spot ETP/ETF product frameworks) and reduced block times from the NU7 activation.
NU7 Network Upgrade: The recent activation successfully slashed block confirmation times to 25 seconds and introduced the Network Sustainability Mechanism, creating strong long-term fundamental tailwinds despite minor transitional debates.
Institutional Context: ZEC continues to benefit from wider regulated visibility via privacy-focused ETP/ETF products, positioning it uniquely among layer-1 privacy assets.
Bullish Scenario: Sustained defense of the $1,261 support zone sets the stage for a push back through $1,340, paving a clear path toward retesting multi-week highs near $1,600+.
Bearish Scenario: A decisive daily close below $1,230 risks an extended correction toward deeper Fibonacci support anchors around $1,180.
NU7 Network Upgrade: The recent activation successfully slashed block confirmation times to 25 seconds and introduced the Network Sustainability Mechanism, creating strong long-term fundamental tailwinds despite minor transitional debates.
Institutional Context: ZEC continues to benefit from wider regulated visibility via privacy-focused ETP/ETF products, positioning it uniquely among layer-1 privacy assets.
Bullish Scenario: Sustained defense of the $1,261 support zone sets the stage for a push back through $1,340, paving a clear path toward retesting multi-week highs near $1,600+.
Bearish Scenario: A decisive daily close below $1,230 risks an extended correction toward deeper Fibonacci support anchors around $1,180.
30
·
--
Lihat terjemahan
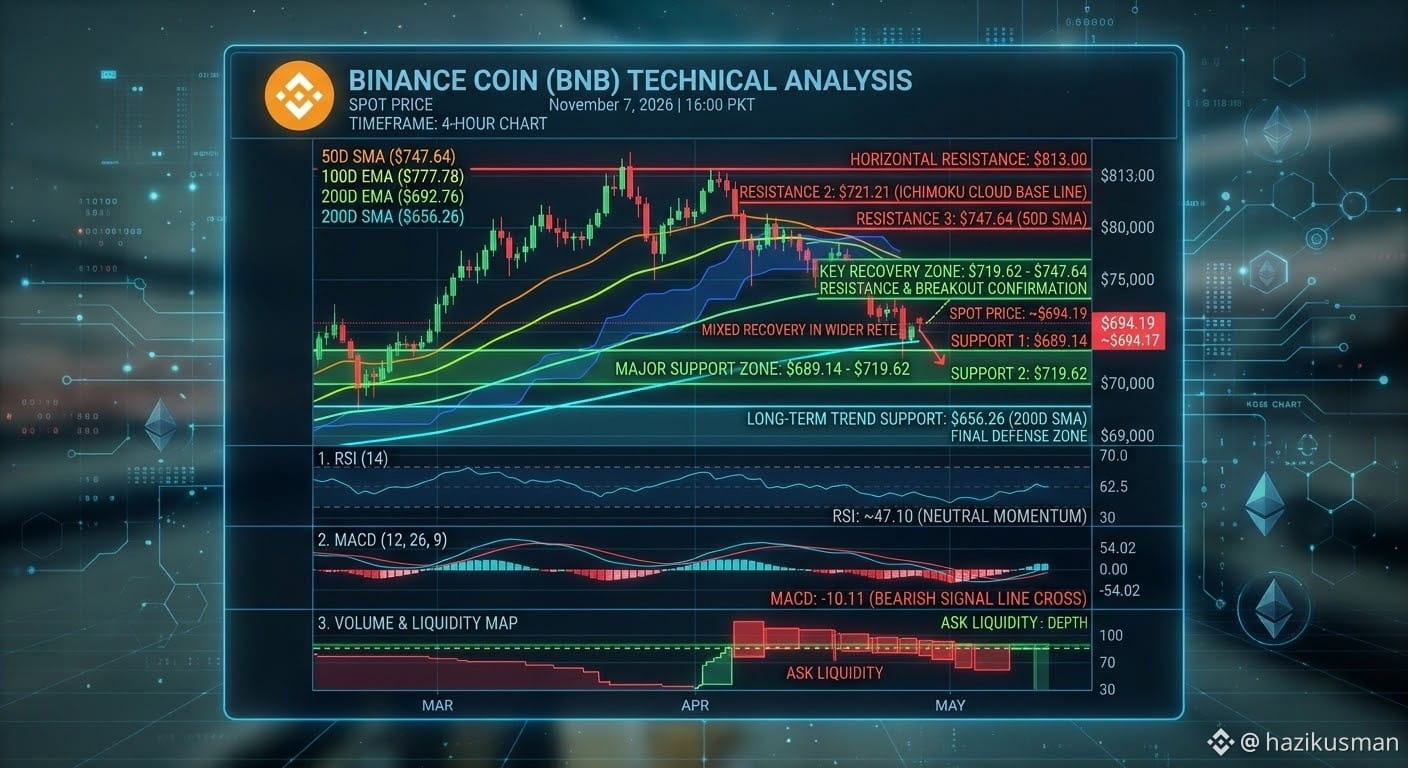
$BNB is currently at a critical juncture, navigating a complex technical landscape. As of November 7, 2026, the price is testing a pivotal, wider demand zone while facing multiple trend-based resistance clusters, creating a "make-or-break" scenario.
Analysis Conclusion & Outlook
BNB’s price structure is defined by heavy overhead resistance. The immediate ceiling at $692.76 (200D EMA) must be broken for a neutral recovery attempt. Until that happens, the dominant path is defined by a series of downward-sloping barriers.
Bullish Scenario: A decisive, high-volume close above the multi-tiered resistance cluster up to $721.21 (Ichimoku Cloud and 50D SMA) is required to unlock a bullish recovery toward $800+.
Bearish Scenario: If BNB is rejected at the current $692.76 level and breaks below the wide support floor at $689.14, it will likely target the final long-term defense line at $656.26.
$BNB is currently at a critical juncture, navigating a complex technical landscape. As of November 7, 2026, the price is testing a pivotal, wider demand zone while facing multiple trend-based resistance clusters, creating a "make-or-break" scenario.
Analysis Conclusion & Outlook
BNB’s price structure is defined by heavy overhead resistance. The immediate ceiling at $692.76 (200D EMA) must be broken for a neutral recovery attempt. Until that happens, the dominant path is defined by a series of downward-sloping barriers.
Bullish Scenario: A decisive, high-volume close above the multi-tiered resistance cluster up to $721.21 (Ichimoku Cloud and 50D SMA) is required to unlock a bullish recovery toward $800+.
Bearish Scenario: If BNB is rejected at the current $692.76 level and breaks below the wide support floor at $689.14, it will likely target the final long-term defense line at $656.26.
Analysis Conclusion & Outlook
BNB’s price structure is defined by heavy overhead resistance. The immediate ceiling at $692.76 (200D EMA) must be broken for a neutral recovery attempt. Until that happens, the dominant path is defined by a series of downward-sloping barriers.
Bullish Scenario: A decisive, high-volume close above the multi-tiered resistance cluster up to $721.21 (Ichimoku Cloud and 50D SMA) is required to unlock a bullish recovery toward $800+.
Bearish Scenario: If BNB is rejected at the current $692.76 level and breaks below the wide support floor at $689.14, it will likely target the final long-term defense line at $656.26.
43
·
--
Lihat terjemahan
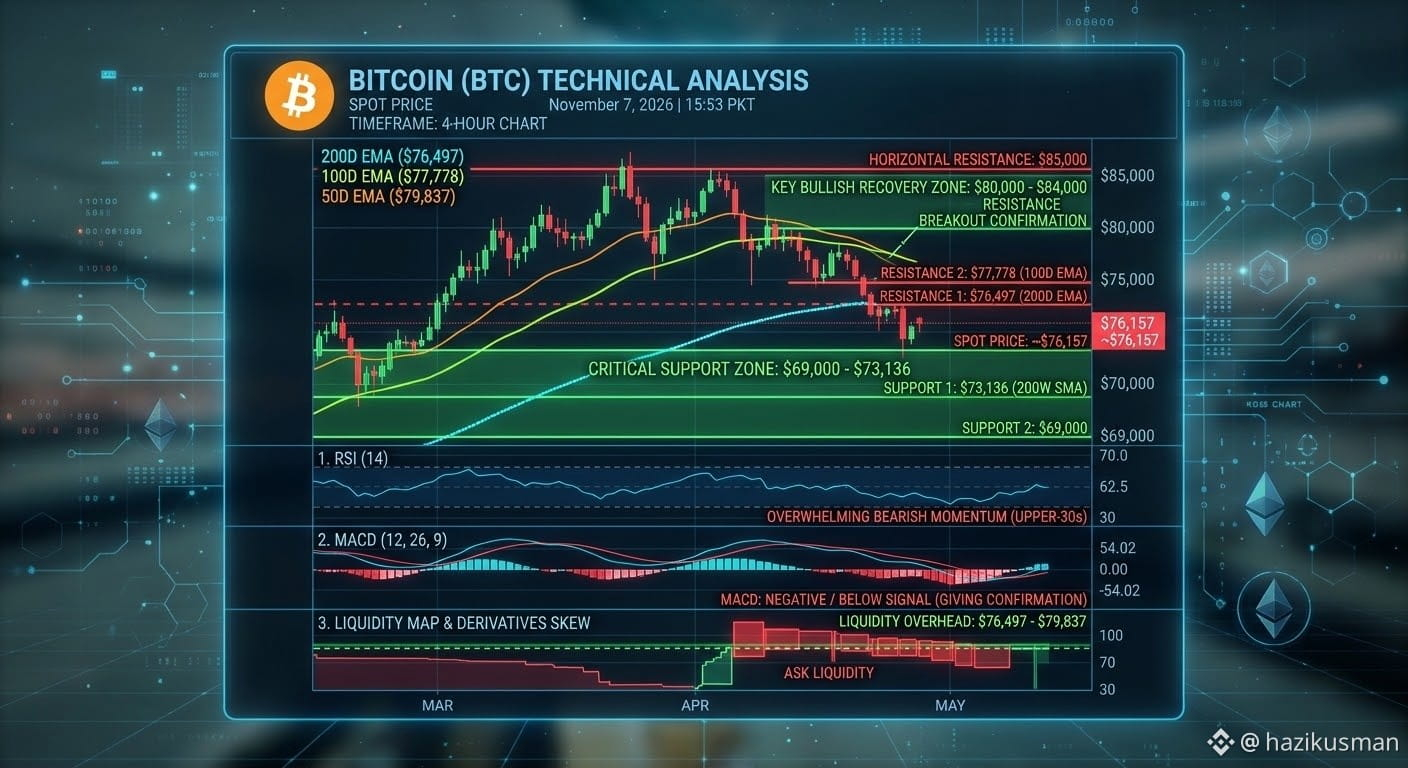
$BTC is navigating a significant trend shift, having closed below a critical cluster of moving averages, signalling renewed bearish near-term bias. The dominant feature of the current landscape is a dense band of medium- and longer-term trend resistance overhead, which has capped recent recovery attempts.
Analysis Conclusion & Outlook
The market structure has broken down in the near term. The cluster of EMAs ($76,497–$79,837) now acts as a dense ceiling, suggesting that any rallies are likely to be capped until a significant volume breakout occurs.
Bullish Scenario: To invalidate the bearish bias, BTC must first regain and consolidate above the 200-day EMA at $76,497. A daily close above the horizontal resistance at $85,000 would signal a potential return to the broader high-volatility range.
Bearish Scenario (Current Dominant): As long as BTC holds beneath the EMA cluster, the trend favors continuation of the corrective phase. Given the lack of immediate horizontal support, any pullback is likely to seek a new, undefined floor well below spot. Rallies are vulnerable.
$BTC is navigating a significant trend shift, having closed below a critical cluster of moving averages, signalling renewed bearish near-term bias. The dominant feature of the current landscape is a dense band of medium- and longer-term trend resistance overhead, which has capped recent recovery attempts.
Analysis Conclusion & Outlook
The market structure has broken down in the near term. The cluster of EMAs ($76,497–$79,837) now acts as a dense ceiling, suggesting that any rallies are likely to be capped until a significant volume breakout occurs.
Bullish Scenario: To invalidate the bearish bias, BTC must first regain and consolidate above the 200-day EMA at $76,497. A daily close above the horizontal resistance at $85,000 would signal a potential return to the broader high-volatility range.
Bearish Scenario (Current Dominant): As long as BTC holds beneath the EMA cluster, the trend favors continuation of the corrective phase. Given the lack of immediate horizontal support, any pullback is likely to seek a new, undefined floor well below spot. Rallies are vulnerable.
Analysis Conclusion & Outlook
The market structure has broken down in the near term. The cluster of EMAs ($76,497–$79,837) now acts as a dense ceiling, suggesting that any rallies are likely to be capped until a significant volume breakout occurs.
Bullish Scenario: To invalidate the bearish bias, BTC must first regain and consolidate above the 200-day EMA at $76,497. A daily close above the horizontal resistance at $85,000 would signal a potential return to the broader high-volatility range.
Bearish Scenario (Current Dominant): As long as BTC holds beneath the EMA cluster, the trend favors continuation of the corrective phase. Given the lack of immediate horizontal support, any pullback is likely to seek a new, undefined floor well below spot. Rallies are vulnerable.
57
·
--
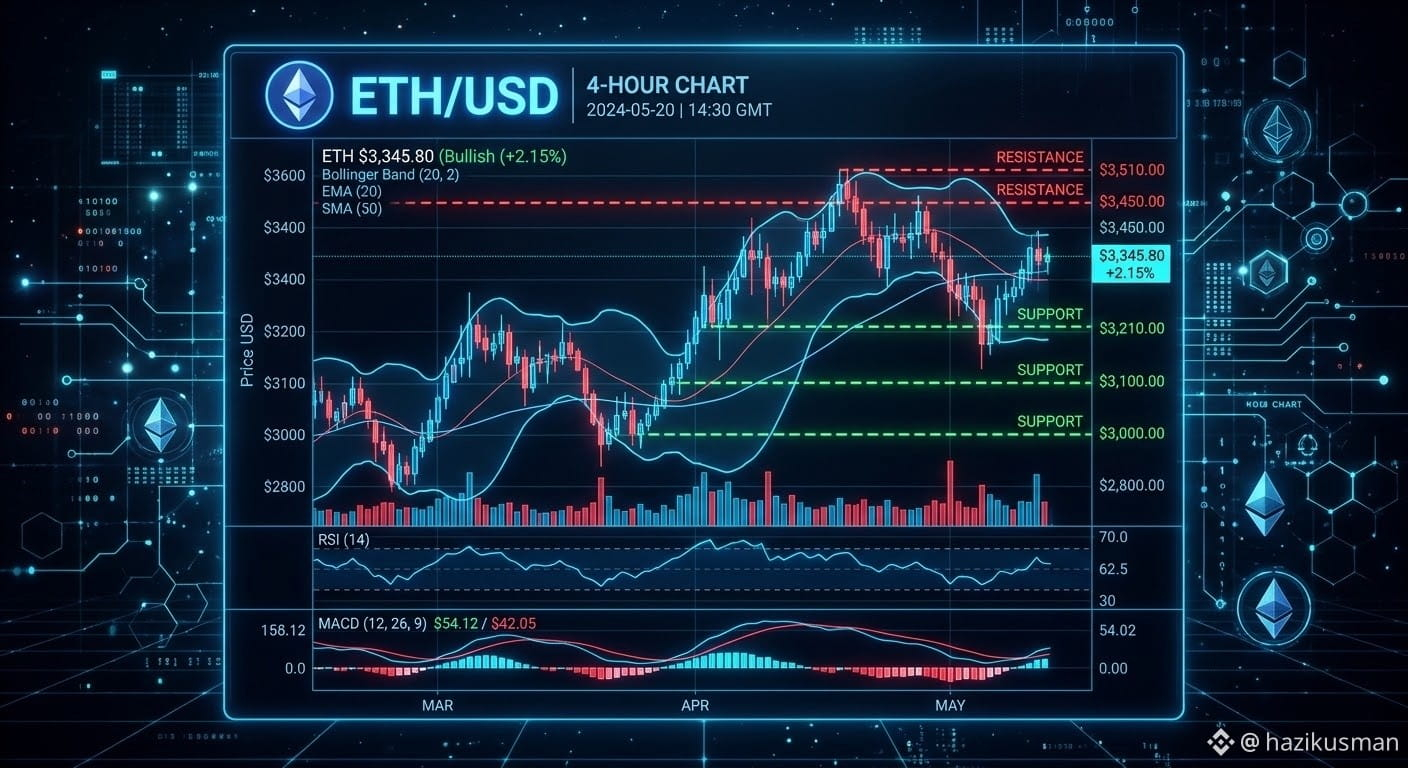
$ETH saat ini bergerak di kisaran $2,225–$2,250, membentuk zona konsolidasi setelah terkoreksi dari level pengujian tertinggi sebelumnya. Total kapitalisasi pasarnya berada di sekitar $274 miliar, mempertahankan posisinya sebagai platform kontrak pintar terkemuka dan mata uang kripto terbesar kedua berdasarkan nilai pasar.
Faktor Pendorong Utama & Prospek
Ekspansi Layer-2 & Staking: Aktivitas jaringan pada solusi Layer-2 tetap sehat, didorong oleh aktivitas protokol yang stabil dan berkurangnya hambatan transaksi.
Tekanan Makro & Imbal Hasil: Harga aset kripto masih sangat dipengaruhi oleh pergerakan imbal hasil Treasury dan ekspektasi suku bunga makroekonomi yang lebih luas.
Skenario Bullish: Penembusan yang meyakinkan dan penutupan harian di atas rentang resistansi $2,500–$2,550 akan membuka jalan untuk menguji kembali level $2,700+.
Skenario Bearish: Penurunan di bawah level support penting $2,150 berisiko memperpanjang konsolidasi hingga mendekati batas psikologis $2,000.
$ETH saat ini bergerak di kisaran $2,225–$2,250, membentuk zona konsolidasi setelah terkoreksi dari level pengujian tertinggi sebelumnya. Total kapitalisasi pasarnya berada di sekitar $274 miliar, mempertahankan posisinya sebagai platform kontrak pintar terkemuka dan mata uang kripto terbesar kedua berdasarkan nilai pasar.
Faktor Pendorong Utama & Prospek
Ekspansi Layer-2 & Staking: Aktivitas jaringan pada solusi Layer-2 tetap sehat, didorong oleh aktivitas protokol yang stabil dan berkurangnya hambatan transaksi.
Tekanan Makro & Imbal Hasil: Harga aset kripto masih sangat dipengaruhi oleh pergerakan imbal hasil Treasury dan ekspektasi suku bunga makroekonomi yang lebih luas.
Skenario Bullish: Penembusan yang meyakinkan dan penutupan harian di atas rentang resistansi $2,500–$2,550 akan membuka jalan untuk menguji kembali level $2,700+.
Skenario Bearish: Penurunan di bawah level support penting $2,150 berisiko memperpanjang konsolidasi hingga mendekati batas psikologis $2,000.
Faktor Pendorong Utama & Prospek
Ekspansi Layer-2 & Staking: Aktivitas jaringan pada solusi Layer-2 tetap sehat, didorong oleh aktivitas protokol yang stabil dan berkurangnya hambatan transaksi.
Tekanan Makro & Imbal Hasil: Harga aset kripto masih sangat dipengaruhi oleh pergerakan imbal hasil Treasury dan ekspektasi suku bunga makroekonomi yang lebih luas.
Skenario Bullish: Penembusan yang meyakinkan dan penutupan harian di atas rentang resistansi $2,500–$2,550 akan membuka jalan untuk menguji kembali level $2,700+.
Skenario Bearish: Penurunan di bawah level support penting $2,150 berisiko memperpanjang konsolidasi hingga mendekati batas psikologis $2,000.
64
·
--
Lihat terjemahan
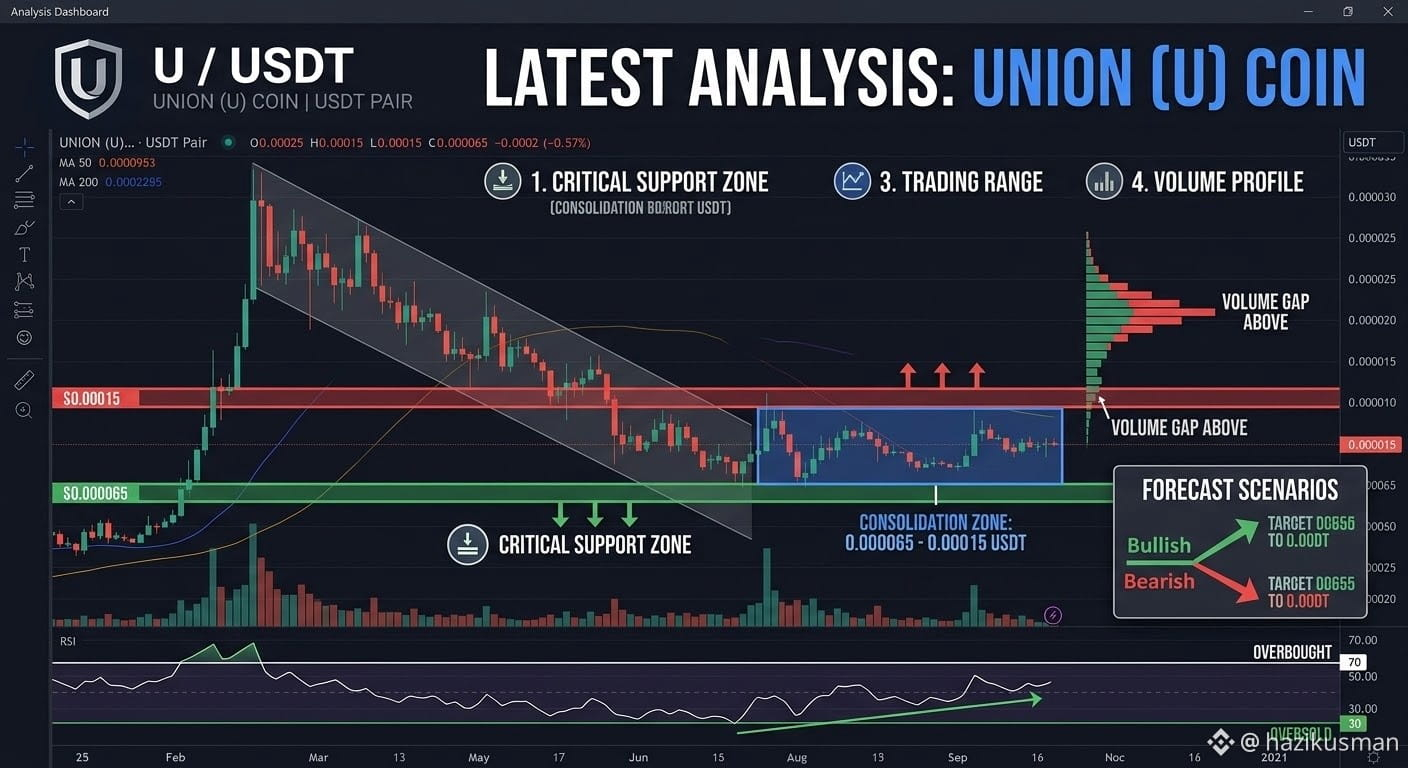
$U token is currently attempting to build a short-term bottom following extended macro consolidation. Recent trading activity shows a moderate 7-day price rebound, though overhead resistance remains strong due to lower market liquidity.
Immediate Support Zone ($0.000065 – $0.000095): The token recently established its baseline support around $0.000065. Holding above the $0.000095 level is critical to preventing another retest of macro historical lows.
Resistance Levels ($0.00015 – $0.00025): Immediate overhead resistance lies near $0.00015. A sustained high-volume breakout past $0.00025 is required to reverse the broader bearish technical bias.
Technical Oscillators: Daily moving averages signal a prevailing Sell / Neutral sentiment across major exchanges, while short-term RSI indicators show oversold recovery signs.
Market Sentiment: Cautious. Traded volumes are low, so short-term moves remain highly volatile until a clear breakout past initial resistance occurs.
$U token is currently attempting to build a short-term bottom following extended macro consolidation. Recent trading activity shows a moderate 7-day price rebound, though overhead resistance remains strong due to lower market liquidity.
Immediate Support Zone ($0.000065 – $0.000095): The token recently established its baseline support around $0.000065. Holding above the $0.000095 level is critical to preventing another retest of macro historical lows.
Resistance Levels ($0.00015 – $0.00025): Immediate overhead resistance lies near $0.00015. A sustained high-volume breakout past $0.00025 is required to reverse the broader bearish technical bias.
Technical Oscillators: Daily moving averages signal a prevailing Sell / Neutral sentiment across major exchanges, while short-term RSI indicators show oversold recovery signs.
Market Sentiment: Cautious. Traded volumes are low, so short-term moves remain highly volatile until a clear breakout past initial resistance occurs.
Immediate Support Zone ($0.000065 – $0.000095): The token recently established its baseline support around $0.000065. Holding above the $0.000095 level is critical to preventing another retest of macro historical lows.
Resistance Levels ($0.00015 – $0.00025): Immediate overhead resistance lies near $0.00015. A sustained high-volume breakout past $0.00025 is required to reverse the broader bearish technical bias.
Technical Oscillators: Daily moving averages signal a prevailing Sell / Neutral sentiment across major exchanges, while short-term RSI indicators show oversold recovery signs.
Market Sentiment: Cautious. Traded volumes are low, so short-term moves remain highly volatile until a clear breakout past initial resistance occurs.
2
·
--
Lihat terjemahan
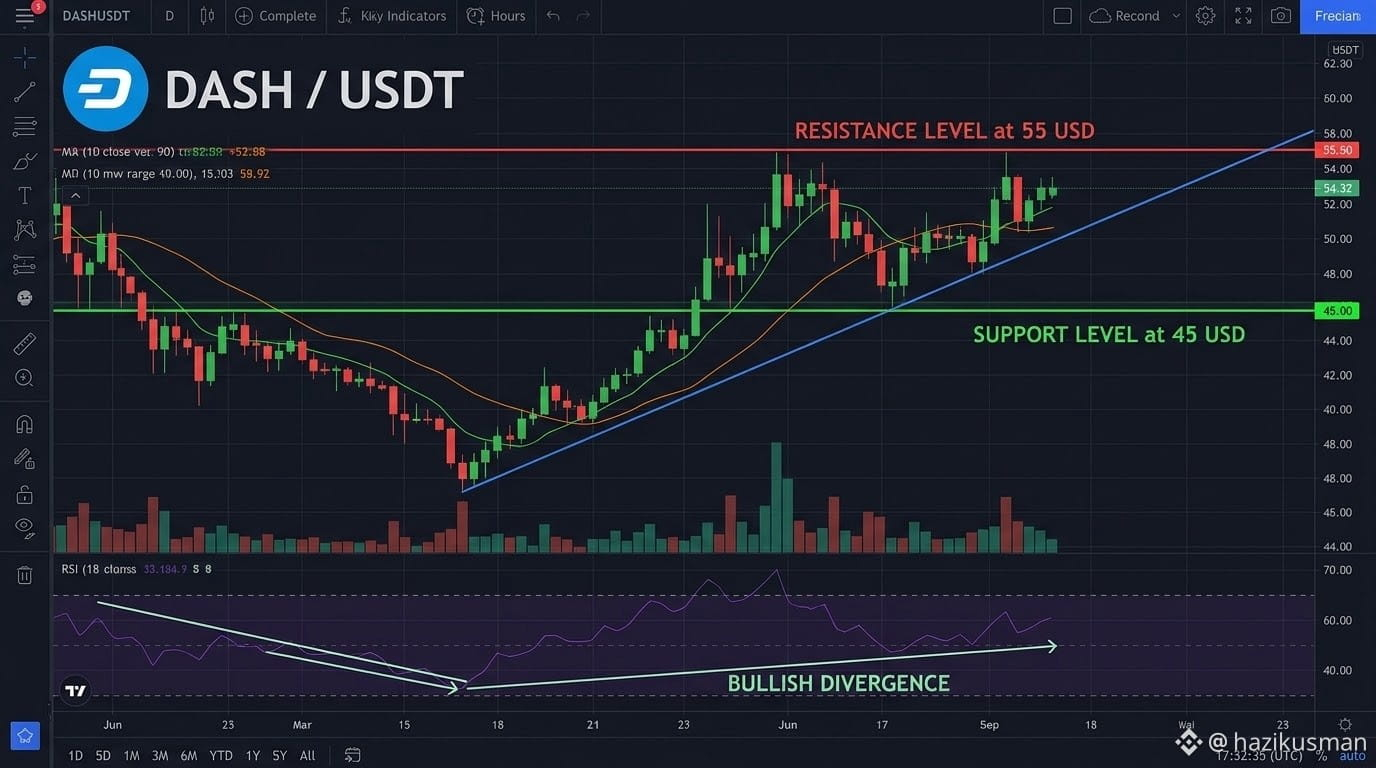
$DASH continues to navigate a broad consolidation phase within the $45.00 – $55.00 range. The price is currently reacting around critical support, balancing near-term crypto market pullbacks against key technical defense zones.
Key Technical Breakdown
Immediate Support Zone ($41.00 – $45.00): The $45.00 level serves as the primary floor protecting the current structure. A sustained break below $41.00 would open downside risks toward multi-month lows.
Key Resistance Zone ($55.00 – $60.00): Bulls face major overhead resistance near $55.00 to $60.00. Clearing this zone with strong volume is required to confirm a medium-term bullish trend continuation.
Chart Patterns & Momentum: On shorter timeframes (4H/8H), lower-boundary tests display signs of bullish RSI divergence along an ascending trendline. Holding this trendline is crucial for setting up a retest of range highs.
Trading Sentiment: Neutral-to-Cautiously Bullish while holding above $45.00. Wait for a confirmed breakout past $55.00 before anticipating extended rallies toward $65.00.
$DASH continues to navigate a broad consolidation phase within the $45.00 – $55.00 range. The price is currently reacting around critical support, balancing near-term crypto market pullbacks against key technical defense zones.
Key Technical Breakdown
Immediate Support Zone ($41.00 – $45.00): The $45.00 level serves as the primary floor protecting the current structure. A sustained break below $41.00 would open downside risks toward multi-month lows.
Key Resistance Zone ($55.00 – $60.00): Bulls face major overhead resistance near $55.00 to $60.00. Clearing this zone with strong volume is required to confirm a medium-term bullish trend continuation.
Chart Patterns & Momentum: On shorter timeframes (4H/8H), lower-boundary tests display signs of bullish RSI divergence along an ascending trendline. Holding this trendline is crucial for setting up a retest of range highs.
Trading Sentiment: Neutral-to-Cautiously Bullish while holding above $45.00. Wait for a confirmed breakout past $55.00 before anticipating extended rallies toward $65.00.
Key Technical Breakdown
Immediate Support Zone ($41.00 – $45.00): The $45.00 level serves as the primary floor protecting the current structure. A sustained break below $41.00 would open downside risks toward multi-month lows.
Key Resistance Zone ($55.00 – $60.00): Bulls face major overhead resistance near $55.00 to $60.00. Clearing this zone with strong volume is required to confirm a medium-term bullish trend continuation.
Chart Patterns & Momentum: On shorter timeframes (4H/8H), lower-boundary tests display signs of bullish RSI divergence along an ascending trendline. Holding this trendline is crucial for setting up a retest of range highs.
Trading Sentiment: Neutral-to-Cautiously Bullish while holding above $45.00. Wait for a confirmed breakout past $55.00 before anticipating extended rallies toward $65.00.
33
·
--
Lihat terjemahan
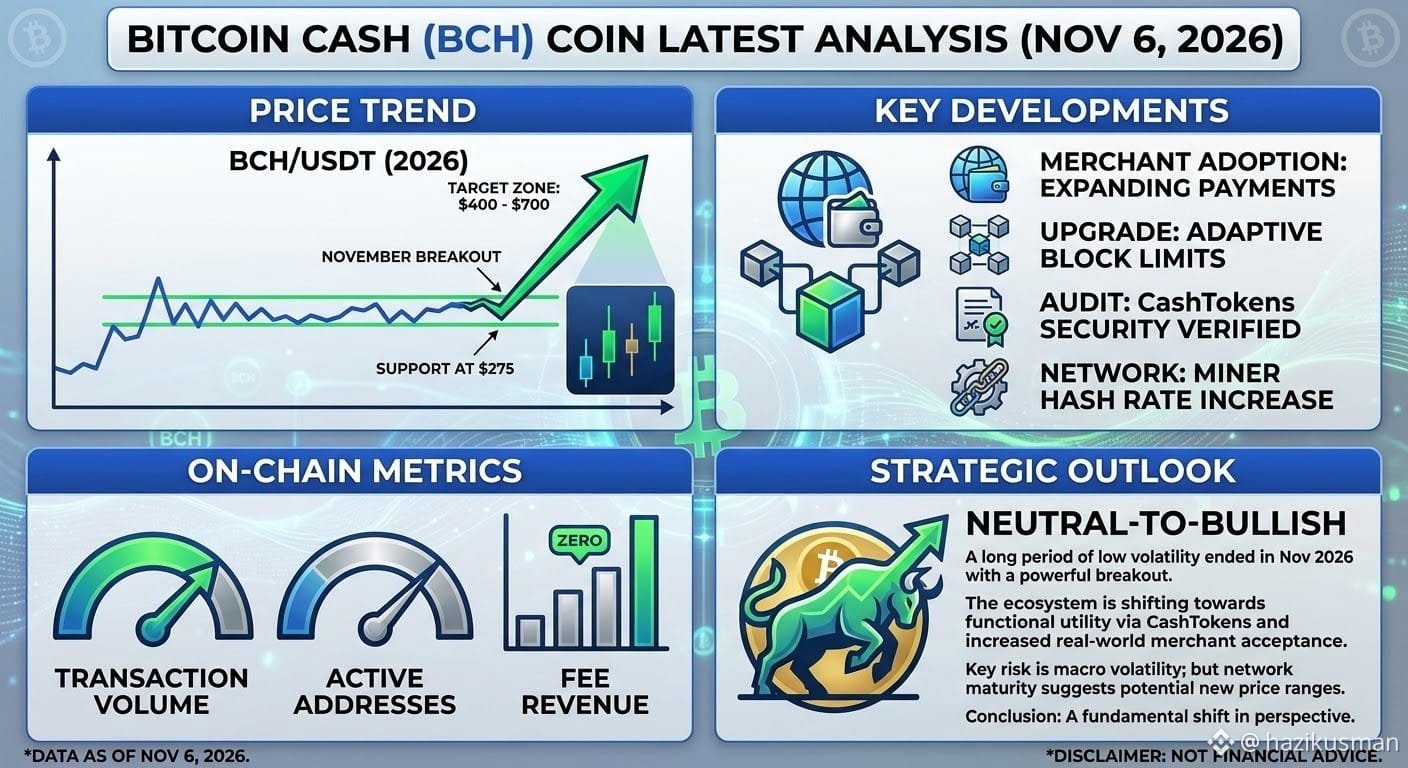
$BCH successfully tested key support at approximately $275 and has since initiated a powerful, high-volume move, shattering long-standing resistance.
Target Zones: Market structure now points to a fresh trading range, with analysts projecting initial upside targets between $400 and $700 before year-end, contingent on the rally’s sustainability.
2. Network Utility: Beyond Payments
CashTokens Integration: The 2026 upgrade for CashTokens has matured, enabling developers to build sophisticated decentralized applications (dApps) and issue native tokens on the BCH blockchain.
Smart Contracts: This functional expansion shifts BCH’s narrative from purely a medium of exchange to a scalable layer-one utility network.
3. Adaptive Scaling & Miner Support
Network Stability: The ongoing implementation of the Adaptive Block Limit Algorithm ensures transaction fees remain fractions of a cent, reinforcing its advantage for micro-transactions.
Hash Rate Stability: A recent, sustained increase in miner hash rate confirms strong network security and confidence from large-scale operators.
Strategic Outlook
We maintain a Neutral-to-Bullish outlook on Bitcoin Cash (BCH). While macro volatility is a persistent risk, the convergence of a clear technical breakout with a major fundamental expansion via CashTokens suggests a potential re-rating of the asset. The network is successfully pivoting to prove it can be both a high-speed payment tool and a scalable host for on-chain finance.
$BCH successfully tested key support at approximately $275 and has since initiated a powerful, high-volume move, shattering long-standing resistance.
Target Zones: Market structure now points to a fresh trading range, with analysts projecting initial upside targets between $400 and $700 before year-end, contingent on the rally’s sustainability.
2. Network Utility: Beyond Payments
CashTokens Integration: The 2026 upgrade for CashTokens has matured, enabling developers to build sophisticated decentralized applications (dApps) and issue native tokens on the BCH blockchain.
Smart Contracts: This functional expansion shifts BCH’s narrative from purely a medium of exchange to a scalable layer-one utility network.
3. Adaptive Scaling & Miner Support
Network Stability: The ongoing implementation of the Adaptive Block Limit Algorithm ensures transaction fees remain fractions of a cent, reinforcing its advantage for micro-transactions.
Hash Rate Stability: A recent, sustained increase in miner hash rate confirms strong network security and confidence from large-scale operators.
Strategic Outlook
We maintain a Neutral-to-Bullish outlook on Bitcoin Cash (BCH). While macro volatility is a persistent risk, the convergence of a clear technical breakout with a major fundamental expansion via CashTokens suggests a potential re-rating of the asset. The network is successfully pivoting to prove it can be both a high-speed payment tool and a scalable host for on-chain finance.
Target Zones: Market structure now points to a fresh trading range, with analysts projecting initial upside targets between $400 and $700 before year-end, contingent on the rally’s sustainability.
2. Network Utility: Beyond Payments
CashTokens Integration: The 2026 upgrade for CashTokens has matured, enabling developers to build sophisticated decentralized applications (dApps) and issue native tokens on the BCH blockchain.
Smart Contracts: This functional expansion shifts BCH’s narrative from purely a medium of exchange to a scalable layer-one utility network.
3. Adaptive Scaling & Miner Support
Network Stability: The ongoing implementation of the Adaptive Block Limit Algorithm ensures transaction fees remain fractions of a cent, reinforcing its advantage for micro-transactions.
Hash Rate Stability: A recent, sustained increase in miner hash rate confirms strong network security and confidence from large-scale operators.
Strategic Outlook
We maintain a Neutral-to-Bullish outlook on Bitcoin Cash (BCH). While macro volatility is a persistent risk, the convergence of a clear technical breakout with a major fundamental expansion via CashTokens suggests a potential re-rating of the asset. The network is successfully pivoting to prove it can be both a high-speed payment tool and a scalable host for on-chain finance.
30
·
--
Lihat terjemahan
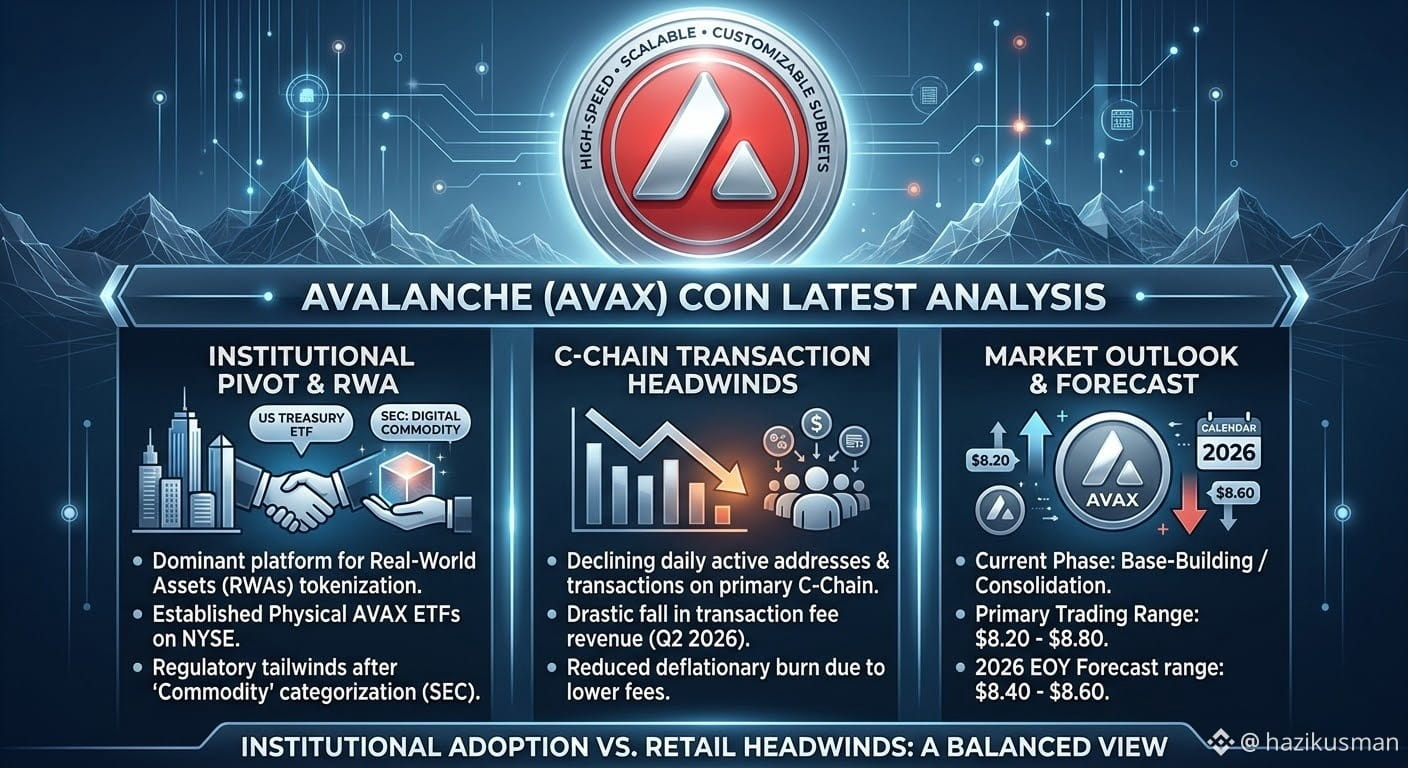
$AVAX now has established physical ETFs listed on major global exchanges, such as the NYSE, further bridging the gap with traditional finance.
Regulatory Clarity: In March 2026, an interpretive release from the SEC categorized AVAX among "digital commodities," providing a significant long-term regulatory tailwind.
.
Network Performance & Usage (The Headwinds): While the institutional story is strong, the primary transaction layer for retail, the C-Chain, has shown weakness.
Declining Metrics: Usage metrics, including average daily active addresses and total transaction count, have declined significantly from early 2026 highs.
Fee Revenue: Reflecting the usage decline, network fee revenue fell drastically in Q2 2026. This is particularly relevant because all AVAX transaction fees are burned, meaning lower revenue translates directly to reduced deflationary pressure.
.
Market Outlook & Trading Range (Technical View): AVAX price action has been characterized by a multi-month period of base-building, trading primarily in the $8.20 - $8.80 range.
Technical Breakdown: The token remains significantly below its 2021 all-time high, underperforming larger ecosystems.
Forecast: Analysts generally project 2026 to end as a "basing" year, rather than the start of a new fresh trend. Forecasts for the end of the year center on a range of $8.40 - $8.60.
.
Strategic Outlook
The Avalanche investment thesis now depends entirely on whether the growing institutional flows, subnets, and tokenized asset base can create sufficient, sustainable demand to offset the scheduled token unlocks and the current weakness in the retail-facing ecosystem. The infrastructure is solid and legally recognized; the network must now prove its utility outside of asset custody.
$AVAX now has established physical ETFs listed on major global exchanges, such as the NYSE, further bridging the gap with traditional finance.
Regulatory Clarity: In March 2026, an interpretive release from the SEC categorized AVAX among "digital commodities," providing a significant long-term regulatory tailwind.
.
Network Performance & Usage (The Headwinds): While the institutional story is strong, the primary transaction layer for retail, the C-Chain, has shown weakness.
Declining Metrics: Usage metrics, including average daily active addresses and total transaction count, have declined significantly from early 2026 highs.
Fee Revenue: Reflecting the usage decline, network fee revenue fell drastically in Q2 2026. This is particularly relevant because all AVAX transaction fees are burned, meaning lower revenue translates directly to reduced deflationary pressure.
.
Market Outlook & Trading Range (Technical View): AVAX price action has been characterized by a multi-month period of base-building, trading primarily in the $8.20 - $8.80 range.
Technical Breakdown: The token remains significantly below its 2021 all-time high, underperforming larger ecosystems.
Forecast: Analysts generally project 2026 to end as a "basing" year, rather than the start of a new fresh trend. Forecasts for the end of the year center on a range of $8.40 - $8.60.
.
Strategic Outlook
The Avalanche investment thesis now depends entirely on whether the growing institutional flows, subnets, and tokenized asset base can create sufficient, sustainable demand to offset the scheduled token unlocks and the current weakness in the retail-facing ecosystem. The infrastructure is solid and legally recognized; the network must now prove its utility outside of asset custody.
Regulatory Clarity: In March 2026, an interpretive release from the SEC categorized AVAX among "digital commodities," providing a significant long-term regulatory tailwind.
.
Network Performance & Usage (The Headwinds): While the institutional story is strong, the primary transaction layer for retail, the C-Chain, has shown weakness.
Declining Metrics: Usage metrics, including average daily active addresses and total transaction count, have declined significantly from early 2026 highs.
Fee Revenue: Reflecting the usage decline, network fee revenue fell drastically in Q2 2026. This is particularly relevant because all AVAX transaction fees are burned, meaning lower revenue translates directly to reduced deflationary pressure.
.
Market Outlook & Trading Range (Technical View): AVAX price action has been characterized by a multi-month period of base-building, trading primarily in the $8.20 - $8.80 range.
Technical Breakdown: The token remains significantly below its 2021 all-time high, underperforming larger ecosystems.
Forecast: Analysts generally project 2026 to end as a "basing" year, rather than the start of a new fresh trend. Forecasts for the end of the year center on a range of $8.40 - $8.60.
.
Strategic Outlook
The Avalanche investment thesis now depends entirely on whether the growing institutional flows, subnets, and tokenized asset base can create sufficient, sustainable demand to offset the scheduled token unlocks and the current weakness in the retail-facing ecosystem. The infrastructure is solid and legally recognized; the network must now prove its utility outside of asset custody.
41
·
--
Lihat terjemahan
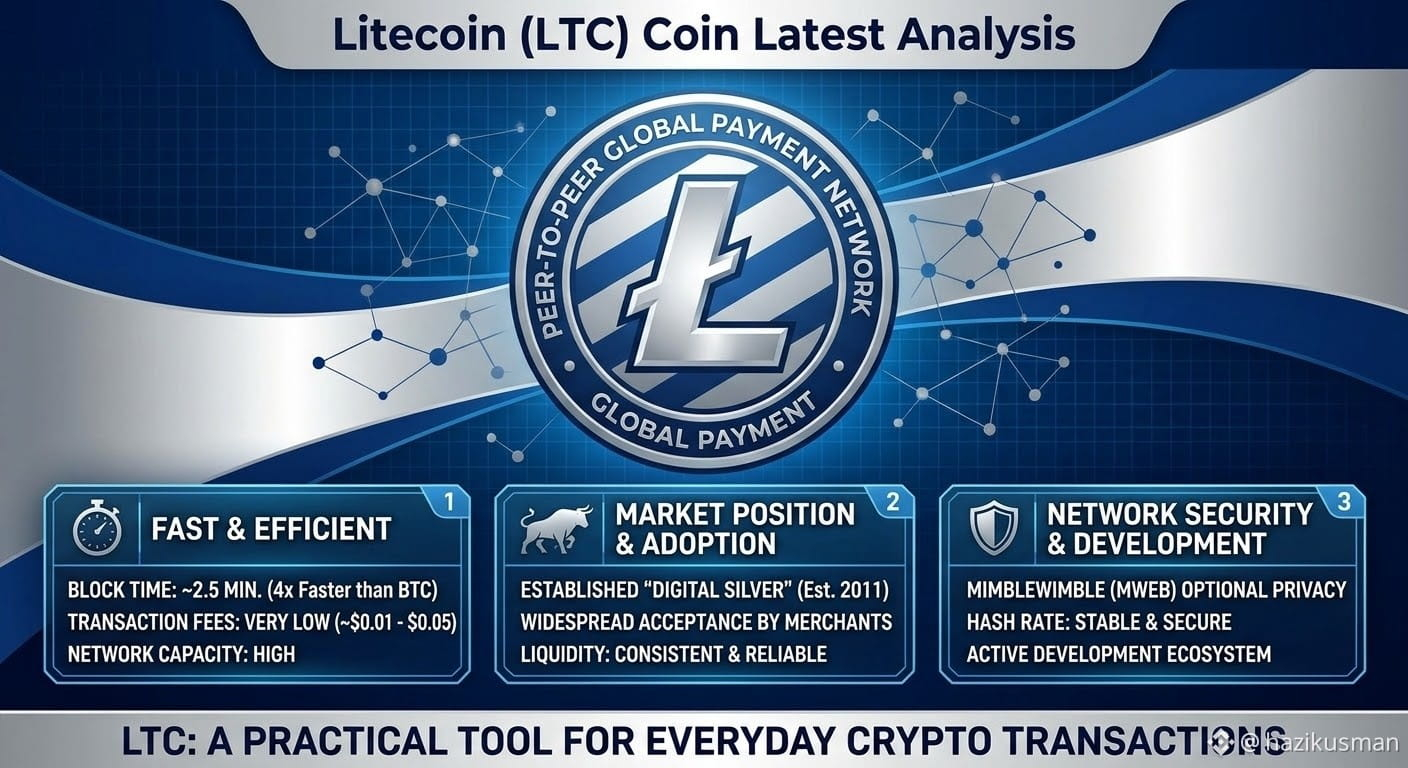
$LTC core strength is its utility. With a block time of approximately 2.5 minutes (four times faster than Bitcoin), and transaction fees that consistently remain near zero (often a fraction of a cent), LTC is a top choice for practical daily use and cross-exchange transfers.
Network Maturity & Stability: Launched in 2011, Litecoin is a mature asset with zero downtime. This long-standing track record of reliability makes it a staple for institutional custodians and widespread payment processor integration. Its 84 million maximum supply provides a predictable inflation model.
Optional Privacy via MWEB: The MimbleWimble Extension Block (MWEB) integration provides Litecoin with optional privacy features, allowing users to conceal transaction amounts. This unique combination of regulatory transparency and optional user confidentiality enhances its appeal as a true medium of exchange.
Network Outlook
While LTC may not always lead in speculative hype cycles, its utility is undeniable. Its focus on being a "lean, mean, transactional machine" ensures that as crypto adoption grows for real-world commerce, Litecoin is uniquely positioned to capture that volume. It remains a foundational asset in the diversified crypto landscape.
$LTC core strength is its utility. With a block time of approximately 2.5 minutes (four times faster than Bitcoin), and transaction fees that consistently remain near zero (often a fraction of a cent), LTC is a top choice for practical daily use and cross-exchange transfers.
Network Maturity & Stability: Launched in 2011, Litecoin is a mature asset with zero downtime. This long-standing track record of reliability makes it a staple for institutional custodians and widespread payment processor integration. Its 84 million maximum supply provides a predictable inflation model.
Optional Privacy via MWEB: The MimbleWimble Extension Block (MWEB) integration provides Litecoin with optional privacy features, allowing users to conceal transaction amounts. This unique combination of regulatory transparency and optional user confidentiality enhances its appeal as a true medium of exchange.
Network Outlook
While LTC may not always lead in speculative hype cycles, its utility is undeniable. Its focus on being a "lean, mean, transactional machine" ensures that as crypto adoption grows for real-world commerce, Litecoin is uniquely positioned to capture that volume. It remains a foundational asset in the diversified crypto landscape.
Network Maturity & Stability: Launched in 2011, Litecoin is a mature asset with zero downtime. This long-standing track record of reliability makes it a staple for institutional custodians and widespread payment processor integration. Its 84 million maximum supply provides a predictable inflation model.
Optional Privacy via MWEB: The MimbleWimble Extension Block (MWEB) integration provides Litecoin with optional privacy features, allowing users to conceal transaction amounts. This unique combination of regulatory transparency and optional user confidentiality enhances its appeal as a true medium of exchange.
Network Outlook
While LTC may not always lead in speculative hype cycles, its utility is undeniable. Its focus on being a "lean, mean, transactional machine" ensures that as crypto adoption grows for real-world commerce, Litecoin is uniquely positioned to capture that volume. It remains a foundational asset in the diversified crypto landscape.
56
Masuk untuk menjelajahi konten lainnya
Bergabunglah dengan pengguna kripto global di Binance Square
⚡️ Dapatkan informasi terbaru dan berguna tentang kripto.
💬 Dipercayai oleh bursa kripto terbesar di dunia.
👍 Temukan wawasan nyata dari kreator terverifikasi.
Email/Nomor Ponsel
Topik Sedang Tren
BinanceReopensWithdrawalsForHYPE&APT
80,602 penayangan
957 Berdiskusi
Binance Mengaktifkan Kembali Penarikan HYPE dan APT serta Memperluas Daftar Aset yang Dipulihkan
Binance News
·Disukai 32 Kali
·25.5k penayangan
SouthKoreaDraftLawTargets15To20%ShareholderCap
82,021 penayangan
630 Berdiskusi
TradFiForBeginners
179,478 penayangan
1,832 Berdiskusi