

Odunerd
54 Posting

Odunerd
Laporkan
Blokir Pengguna
BP-24948D0AD5FF
94 Mengikuti
432 Pengikut
1.3K+ Disukai
Posting
Semua
Kuotasi
PINNED
·
--
Bullish
sering kali kita mengabaikan keyakinan kita dan ketika hal itu terjadi, Anda berteriak 😬 ups.
Selain TA dan FA
ada sesuatu yang disebut Analisis sentimen
apa sentimen Anda tentang narasi tertentu di ruang kripto dan apa dampak yang menurut sentimen Anda BAIK atau BURUK?
Maksud saya, baik Bullish atau Bearish, yang penting adalah keadaan pikiran Anda dan bukan hanya grafik atau MM yang ditampilkan.
TETAP FOKUS🤳
Token Saya mendorong keyakinan saya menuju rn
#memes
#L2s
#AI
#exchtokens
sering kali kita mengabaikan keyakinan kita dan ketika hal itu terjadi, Anda berteriak 😬 ups.
Selain TA dan FA
ada sesuatu yang disebut Analisis sentimen
apa sentimen Anda tentang narasi tertentu di ruang kripto dan apa dampak yang menurut sentimen Anda BAIK atau BURUK?
Maksud saya, baik Bullish atau Bearish, yang penting adalah keadaan pikiran Anda dan bukan hanya grafik atau MM yang ditampilkan.
TETAP FOKUS🤳
Token Saya mendorong keyakinan saya menuju rn
#memes
#L2s
#AI
#exchtokens
Selain TA dan FA
ada sesuatu yang disebut Analisis sentimen
apa sentimen Anda tentang narasi tertentu di ruang kripto dan apa dampak yang menurut sentimen Anda BAIK atau BURUK?
Maksud saya, baik Bullish atau Bearish, yang penting adalah keadaan pikiran Anda dan bukan hanya grafik atau MM yang ditampilkan.
TETAP FOKUS🤳
Token Saya mendorong keyakinan saya menuju rn
#memes
#L2s
#AI
#exchtokens

3
8
2.5k
·
--
Sebuah token yang nyaris tidak bertahan untuk bangkit lagi, kondisi untuk keluarga ripple saat ini tidak terlihat bagus, ya..
#BitgetHackerMoves$83MStolenXRP
Sebuah token yang nyaris tidak bertahan untuk bangkit lagi, kondisi untuk keluarga ripple saat ini tidak terlihat bagus, ya..
#BitgetHackerMoves$83MStolenXRP
#BitgetHackerMoves$83MStolenXRP
351
·
--
Artikel
Lihat terjemahan
BITCOIN INCONSISTENCIES ANALYTICAL PROVEN..Was June 30, 2026 the Bitcoin Cycle Bottom?
One question has been sitting at the center of my Bitcoin analysis:
Did Bitcoin actually find its cycle bottom on June 30, 2026?
Rather than relying on the chart alone, I approached the question from two sides:
Market structure + on-chain and market data.
1. Starting With Price Action
I deliberately kept the technical analysis simple.
No complicated indicators.
Just price structure.
Bitcoin reached a low of approximately $58.53K on June 30.
Since then, the market has behaved differently from the downtrend that led into that low.
On the daily chart, $BTC moved away from the June low and entered a period of consolidation before beginning to form a sequence of higher highs and higher lows.
The weekly chart adds another important piece of context.
The June low has remained intact, while Bitcoin has recovered substantially from that level.
That is certainly worth paying attention to.
But there is an important distinction:
A strong recovery from a low does not, by itself, prove that the cycle bottom is in.
So I went deeper.
2. Looking Beneath the Chart
To test the June low from a data perspective, I built a framework around several metrics and historical comparisons:
- MVRV
- Bitcoin Realized Price
- ETF flows
- Historical cycle bottoms
- Peak-to-bottom drawdowns
- Post-bottom recovery behaviour
The objective wasn't to find one magic indicator.
Instead, I wanted to see whether multiple independent pieces of evidence were pointing toward the same conclusion.
Key numbers from the analysis
$58.53K — June 30 low
-53.11% — Peak-to-bottom drawdown
1.47 — Current MVRV
$53.19K — Realized Price
+30.52% — Recovery from the June low at the time of the analysis
When these figures are placed alongside historical Bitcoin cycle behaviour, the June 30 low starts to look increasingly significant.
3. What Does the Evidence Actually Tell Us?
The analysis suggests that June 30 is a credible candidate for the cycle bottom.
But there is an important caveat:
A candidate bottom is not the same thing as a confirmed cycle bottom.
Bitcoin has historically experienced significant recoveries that were later followed by another major move lower.
That's why I don't think one should look at the June low in isolation.
The more interesting observation is that both price structure and the underlying data are pointing toward a potential change in market behaviour around that period.
Price is showing a different structure.
The on-chain and market data provide additional evidence worth investigating.
But the higher-timeframe cycle still needs to prove itself.
4. Why Combine Technical Analysis With Data Analytics?
This is actually the bigger lesson behind the research.
The chart tells us what price is doing.
But data can help us investigate what may be happening underneath the price.
Instead of asking:
«"Does the chart look bullish?"»
The better analytical question becomes:
"Do multiple independent datasets support the same market hypothesis?"
That shift changes the way I approach crypto research.
Rather than relying on a single indicator or prediction, I want to combine:
Price → On-chain data → Historical behaviour → Market flows → Statistical context
Then let the evidence tell the story.
So, was June 30, 2026 the Bitcoin cycle bottom?
It is a credible candidate — but the data does not make it a confirmed fact yet.
For me, that's where the research becomes interesting.
The goal isn't to predict the market with certainty.
It's to identify important market events, collect the relevant data, test the hypothesis, and continue monitoring whether the evidence holds.
PS: I've put together the full research, dashboard, and methodology for anyone interested in going through the analysis from start to finish.
BITCOIN INCONSISTENCIES ANALYTICAL PROVEN..
Was June 30, 2026 the Bitcoin Cycle Bottom?
One question has been sitting at the center of my Bitcoin analysis:
Did Bitcoin actually find its cycle bottom on June 30, 2026?
Rather than relying on the chart alone, I approached the question from two sides:
Market structure + on-chain and market data.
1. Starting With Price Action
I deliberately kept the technical analysis simple.
No complicated indicators.
Just price structure.
Bitcoin reached a low of approximately $58.53K on June 30.
Since then, the market has behaved differently from the downtrend that led into that low.
On the daily chart, $BTC moved away from the June low and entered a period of consolidation before beginning to form a sequence of higher highs and higher lows.
The weekly chart adds another important piece of context.
The June low has remained intact, while Bitcoin has recovered substantially from that level.
That is certainly worth paying attention to.
But there is an important distinction:
A strong recovery from a low does not, by itself, prove that the cycle bottom is in.
So I went deeper.
2. Looking Beneath the Chart
To test the June low from a data perspective, I built a framework around several metrics and historical comparisons:
- MVRV
- Bitcoin Realized Price
- ETF flows
- Historical cycle bottoms
- Peak-to-bottom drawdowns
- Post-bottom recovery behaviour
The objective wasn't to find one magic indicator.
Instead, I wanted to see whether multiple independent pieces of evidence were pointing toward the same conclusion.
Key numbers from the analysis
$58.53K — June 30 low
-53.11% — Peak-to-bottom drawdown
1.47 — Current MVRV
$53.19K — Realized Price
+30.52% — Recovery from the June low at the time of the analysis
When these figures are placed alongside historical Bitcoin cycle behaviour, the June 30 low starts to look increasingly significant.
3. What Does the Evidence Actually Tell Us?
The analysis suggests that June 30 is a credible candidate for the cycle bottom.
But there is an important caveat:
A candidate bottom is not the same thing as a confirmed cycle bottom.
Bitcoin has historically experienced significant recoveries that were later followed by another major move lower.
That's why I don't think one should look at the June low in isolation.
The more interesting observation is that both price structure and the underlying data are pointing toward a potential change in market behaviour around that period.
Price is showing a different structure.
The on-chain and market data provide additional evidence worth investigating.
But the higher-timeframe cycle still needs to prove itself.
4. Why Combine Technical Analysis With Data Analytics?
This is actually the bigger lesson behind the research.
The chart tells us what price is doing.
But data can help us investigate what may be happening underneath the price.
Instead of asking:
«"Does the chart look bullish?"»
The better analytical question becomes:
"Do multiple independent datasets support the same market hypothesis?"
That shift changes the way I approach crypto research.
Rather than relying on a single indicator or prediction, I want to combine:
Price → On-chain data → Historical behaviour → Market flows → Statistical context
Then let the evidence tell the story.
So, was June 30, 2026 the Bitcoin cycle bottom?
It is a credible candidate — but the data does not make it a confirmed fact yet.
For me, that's where the research becomes interesting.
The goal isn't to predict the market with certainty.
It's to identify important market events, collect the relevant data, test the hypothesis, and continue monitoring whether the evidence holds.
PS: I've put together the full research, dashboard, and methodology for anyone interested in going through the analysis from start to finish.
One question has been sitting at the center of my Bitcoin analysis:
Did Bitcoin actually find its cycle bottom on June 30, 2026?
Rather than relying on the chart alone, I approached the question from two sides:
Market structure + on-chain and market data.
1. Starting With Price Action
I deliberately kept the technical analysis simple.
No complicated indicators.
Just price structure.
Bitcoin reached a low of approximately $58.53K on June 30.
Since then, the market has behaved differently from the downtrend that led into that low.
On the daily chart, $BTC moved away from the June low and entered a period of consolidation before beginning to form a sequence of higher highs and higher lows.
The weekly chart adds another important piece of context.
The June low has remained intact, while Bitcoin has recovered substantially from that level.
That is certainly worth paying attention to.
But there is an important distinction:
A strong recovery from a low does not, by itself, prove that the cycle bottom is in.
So I went deeper.
2. Looking Beneath the Chart
To test the June low from a data perspective, I built a framework around several metrics and historical comparisons:
- MVRV
- Bitcoin Realized Price
- ETF flows
- Historical cycle bottoms
- Peak-to-bottom drawdowns
- Post-bottom recovery behaviour
The objective wasn't to find one magic indicator.
Instead, I wanted to see whether multiple independent pieces of evidence were pointing toward the same conclusion.
Key numbers from the analysis
$58.53K — June 30 low
-53.11% — Peak-to-bottom drawdown
1.47 — Current MVRV
$53.19K — Realized Price
+30.52% — Recovery from the June low at the time of the analysis
When these figures are placed alongside historical Bitcoin cycle behaviour, the June 30 low starts to look increasingly significant.
3. What Does the Evidence Actually Tell Us?
The analysis suggests that June 30 is a credible candidate for the cycle bottom.
But there is an important caveat:
A candidate bottom is not the same thing as a confirmed cycle bottom.
Bitcoin has historically experienced significant recoveries that were later followed by another major move lower.
That's why I don't think one should look at the June low in isolation.
The more interesting observation is that both price structure and the underlying data are pointing toward a potential change in market behaviour around that period.
Price is showing a different structure.
The on-chain and market data provide additional evidence worth investigating.
But the higher-timeframe cycle still needs to prove itself.
4. Why Combine Technical Analysis With Data Analytics?
This is actually the bigger lesson behind the research.
The chart tells us what price is doing.
But data can help us investigate what may be happening underneath the price.
Instead of asking:
«"Does the chart look bullish?"»
The better analytical question becomes:
"Do multiple independent datasets support the same market hypothesis?"
That shift changes the way I approach crypto research.
Rather than relying on a single indicator or prediction, I want to combine:
Price → On-chain data → Historical behaviour → Market flows → Statistical context
Then let the evidence tell the story.
So, was June 30, 2026 the Bitcoin cycle bottom?
It is a credible candidate — but the data does not make it a confirmed fact yet.
For me, that's where the research becomes interesting.
The goal isn't to predict the market with certainty.
It's to identify important market events, collect the relevant data, test the hypothesis, and continue monitoring whether the evidence holds.
PS: I've put together the full research, dashboard, and methodology for anyone interested in going through the analysis from start to finish.
1
62
·
--
Bullish
$ARB
$ZAMA
$SUI
Alternatif sedang bangun, namun tingkat pemulihan beberapa token masih belum sesuai dengan momennya.
$ARB
$ZAMA
$SUI
Alternatif sedang bangun, namun tingkat pemulihan beberapa token masih belum sesuai dengan momennya.
$ZAMA
$SUI
Alternatif sedang bangun, namun tingkat pemulihan beberapa token masih belum sesuai dengan momennya.
1
594
·
--
bawalah saya mode Gelap kapan saja untuk kebaikan saya sendiri memang kerusakan yang ditimbulkan oleh mode Terang harus mendapatkan perhatian lebih.
bawalah saya mode Gelap kapan saja untuk kebaikan saya sendiri memang kerusakan yang ditimbulkan oleh mode Terang harus mendapatkan perhatian lebih.

Odunerd
·
--
BullishSebagai pengembang yang mempelajari dan juga mengkode layar apa yang Anda sukai saat berada di layar.
▪︎Layar terang
▪︎Layar gelap
mari kita bicara.
▪︎Layar terang
▪︎Layar gelap
mari kita bicara.
1
6
·
--
#StockMarketCrash efek perang pasti akan terjadi setelah apa yang kita lihat sekarang adalah umpan untuk menipu orang.
#StockMarketCrash efek perang pasti akan terjadi setelah apa yang kita lihat sekarang adalah umpan untuk menipu orang.
1
53
·
--
Bullish
Bitcoin mencapai $73K bukanlah dasar untuk merasa sudah sampai, apa yang memicu lonjakan di pasar sekarang adalah jumlah $BTC yang ada di stok dan perang sedang mengalihkan perhatian para penambang, bisa dibilang.
Bitcoin mencapai $73K bukanlah dasar untuk merasa sudah sampai, apa yang memicu lonjakan di pasar sekarang adalah jumlah $BTC yang ada di stok dan perang sedang mengalihkan perhatian para penambang, bisa dibilang.
1
65
·
--
Mereka melumpuhkan semua orang di posisi itu dengan nyata
Mereka melumpuhkan semua orang di posisi itu dengan nyata

Tyler Oliveira
·
--
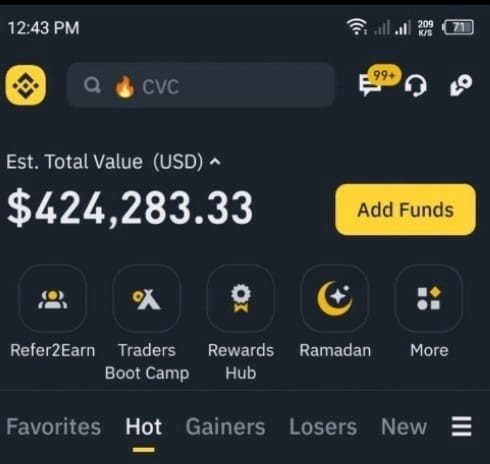
Saya memiliki 1,2 juta di akun saya beberapa jam yang lalu 💔😭
Saya kehilangan hampir 800K di $POWER , Bagaimana saya bisa memulihkan kerugian ini??? 😰
Saya membeli $RIVER 📈✅
Saya kehilangan hampir 800K di $POWER , Bagaimana saya bisa memulihkan kerugian ini??? 😰
Saya membeli $RIVER 📈✅

1
16
·
--
Bullish
sama-sama optimis pada $KAITO di sini
sama-sama optimis pada $KAITO di sini


CoinQuest
·
--
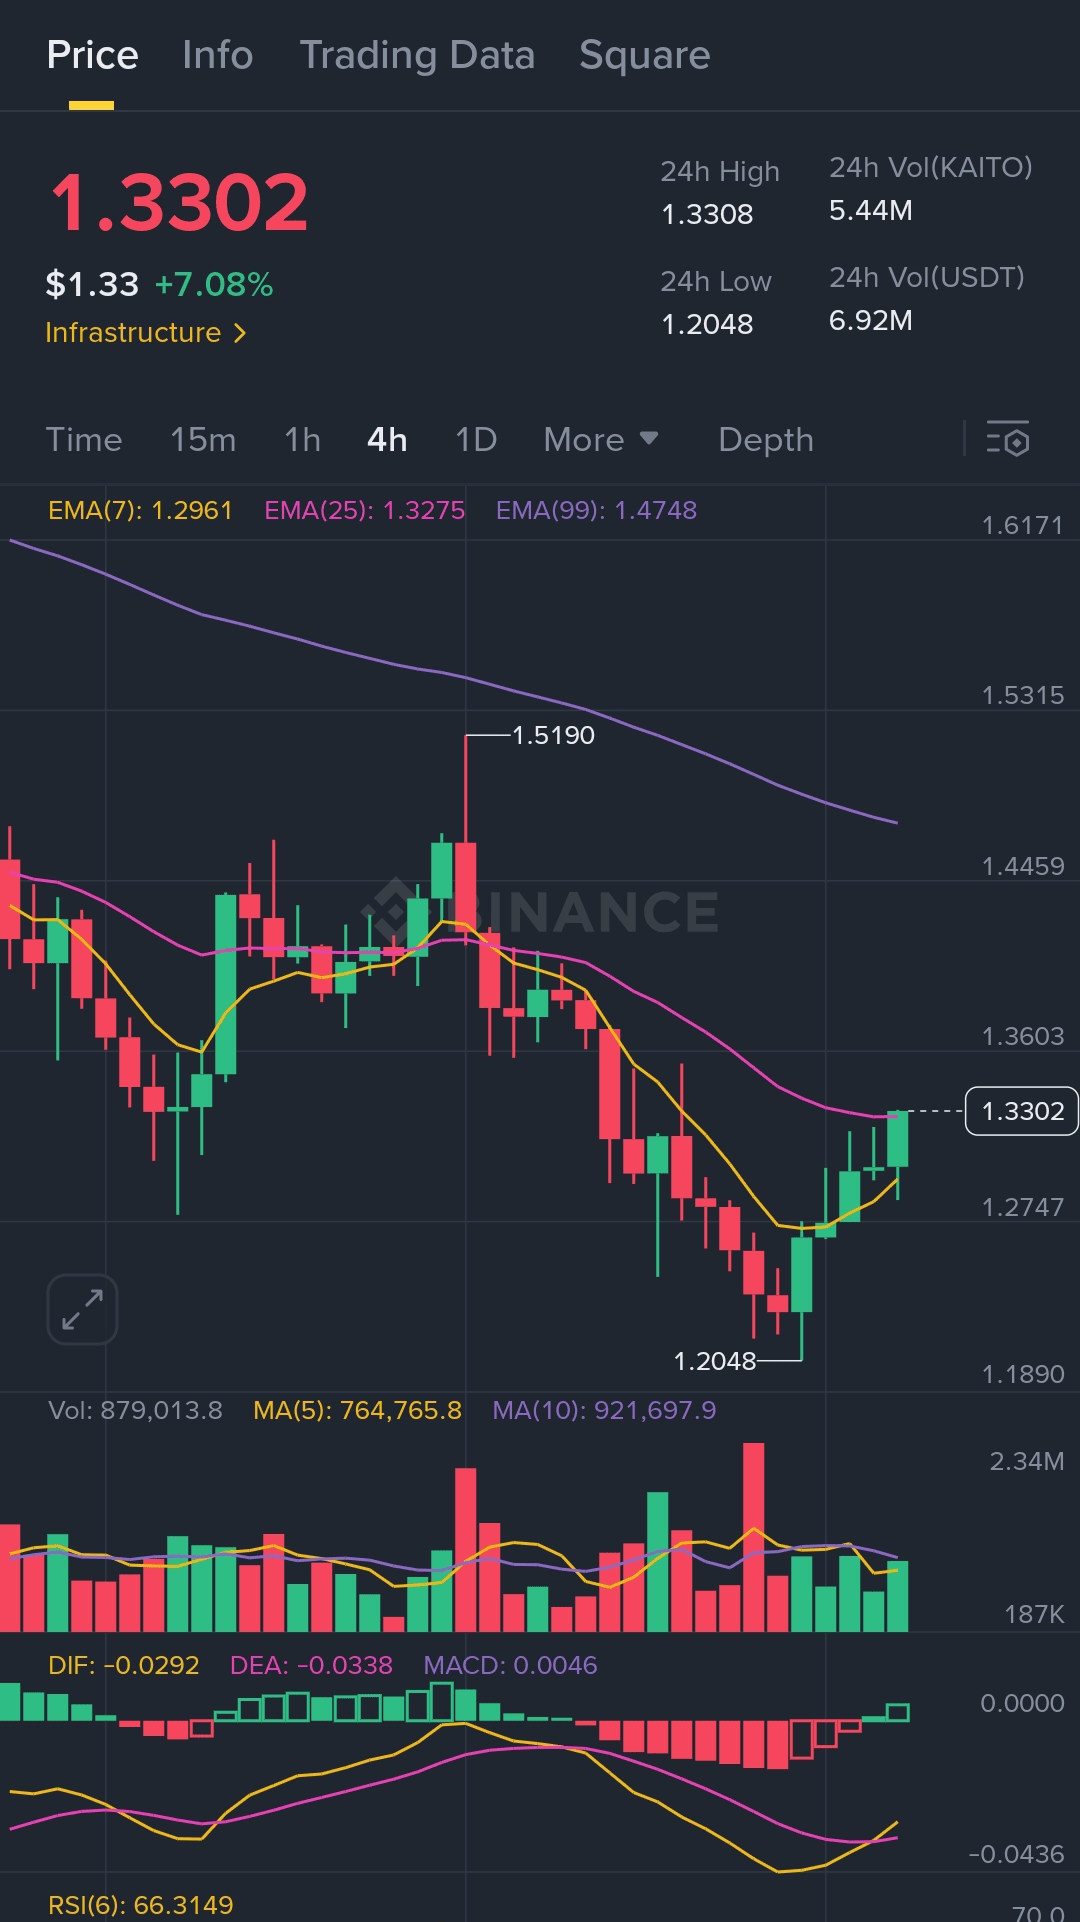
Bullish$KAITO Struktur Breakout dalam Pergerakan ✅
KAITO telah membalikkan resistensi dengan konfirmasi volume dan sedang membentuk low yang lebih tinggi yang bersih, para bullish kembali mendapatkan kendali penuh.
🎯 Masuk: $1.3300
Target: $1.3538 | $1.3850 | $1.4200 (opsional untuk scaling)
🛡️ Stop Loss: $1.2975
Momentum mendukung kelanjutan. Trader breakout harus memperhatikan kekuatan di atas $1.33 setup yang bersih untuk perpanjangan ke atas.
KAITO telah membalikkan resistensi dengan konfirmasi volume dan sedang membentuk low yang lebih tinggi yang bersih, para bullish kembali mendapatkan kendali penuh.
🎯 Masuk: $1.3300
Target: $1.3538 | $1.3850 | $1.4200 (opsional untuk scaling)
🛡️ Stop Loss: $1.2975
Momentum mendukung kelanjutan. Trader breakout harus memperhatikan kekuatan di atas $1.33 setup yang bersih untuk perpanjangan ke atas.
182
·
--
Bullish
➠Hanya waktu yang penting, tetapi dalam jangka panjang, harap prioritaskan keamanan Anda terlebih dahulu, segala hal lainnya hanyalah lelucon.
📢📢
➠Hanya waktu yang penting, tetapi dalam jangka panjang, harap prioritaskan keamanan Anda terlebih dahulu, segala hal lainnya hanyalah lelucon.
📢📢
📢📢
16
·
--
Saat Ini!
Berapa tingkat keserakahanmu lagi?
{spot}(BTCUSDT)
Saat Ini!
Berapa tingkat keserakahanmu lagi?
Berapa tingkat keserakahanmu lagi?
1
18
·
--
Bullish
Jangan biarkan satu hal pun terlewat.
Saran saya, jangan berhenti mengklik.
Jangan biarkan satu hal pun terlewat.
Saran saya, jangan berhenti mengklik.
Saran saya, jangan berhenti mengklik.

2
6
6.9k
·
--
Bullish
Pertanyaan yang sebenarnya untuk jawaban yang sebenarnya.
Apakah kita sudah mendekati musim Alts?
Pertanyaan yang sebenarnya untuk jawaban yang sebenarnya.
Apakah kita sudah mendekati musim Alts?
Apakah kita sudah mendekati musim Alts?

11
7
7.1k
·
--
Bullish
Kunci utama di sini adalah memiliki keyakinan kuat pada apa pun yang Anda pegang setelah itu, lalu luangkan waktu untuk memeriksa fakta beberapa data dan statistik untuk memperkuat pendirian Anda.
#Dogs memiliki narasi yang sangat kuat, jangan terlalu panik, lebih baik pertahankan jika memungkinkan atau perdagangkan dengan hati-hati.
mendengarkan pavel durov, CEO Telegram, Anda mengerti dari mana narasi #Dogs itu berasal dan Anda akan tahu itu bukan sekadar meme biasa.
Saya TETAP BERFOKUS pada X
kita dapat terhubung lebih jauh dari sini.
Suka dan bagikan pemikiran Anda.
#bnb 💛
Kunci utama di sini adalah memiliki keyakinan kuat pada apa pun yang Anda pegang setelah itu, lalu luangkan waktu untuk memeriksa fakta beberapa data dan statistik untuk memperkuat pendirian Anda.
#Dogs memiliki narasi yang sangat kuat, jangan terlalu panik, lebih baik pertahankan jika memungkinkan atau perdagangkan dengan hati-hati.
mendengarkan pavel durov, CEO Telegram, Anda mengerti dari mana narasi #Dogs itu berasal dan Anda akan tahu itu bukan sekadar meme biasa.
Saya TETAP BERFOKUS pada X
kita dapat terhubung lebih jauh dari sini.
Suka dan bagikan pemikiran Anda.
#bnb 💛
#Dogs memiliki narasi yang sangat kuat, jangan terlalu panik, lebih baik pertahankan jika memungkinkan atau perdagangkan dengan hati-hati.
mendengarkan pavel durov, CEO Telegram, Anda mengerti dari mana narasi #Dogs itu berasal dan Anda akan tahu itu bukan sekadar meme biasa.
Saya TETAP BERFOKUS pada X
kita dapat terhubung lebih jauh dari sini.
Suka dan bagikan pemikiran Anda.
#bnb 💛
1
706
·
--
Bearish
Jaringan Terbuka (TON) mengalami penurunan tajam yang tiba-tiba karena penangkapan CEO Telegram.
#PavelDurov
Saatnya bertindak cepat pada Meme terkenal di Ton Blockchain untuk meniru dan mengamankan peluang ini sebagai suara pembelian.
#Fish
#Notcoin
#utyab
#Raff
Tpet
Durev
Tcandy
Tmonk.
Dan masih banyak lagi yang dapat Anda periksa di geckoterminal.com atau gunakan dex ini untuk membeli token yang terdaftar.
Ston.fi
DeDust.io
Jaringan Terbuka (TON) mengalami penurunan tajam yang tiba-tiba karena penangkapan CEO Telegram.
#PavelDurov
Saatnya bertindak cepat pada Meme terkenal di Ton Blockchain untuk meniru dan mengamankan peluang ini sebagai suara pembelian.
#Fish
#Notcoin
#utyab
#Raff
Tpet
Durev
Tcandy
Tmonk.
Dan masih banyak lagi yang dapat Anda periksa di geckoterminal.com atau gunakan dex ini untuk membeli token yang terdaftar.
Ston.fi
DeDust.io
#PavelDurov
Saatnya bertindak cepat pada Meme terkenal di Ton Blockchain untuk meniru dan mengamankan peluang ini sebagai suara pembelian.
#Fish
#Notcoin
#utyab
#Raff
Tpet
Durev
Tcandy
Tmonk.
Dan masih banyak lagi yang dapat Anda periksa di geckoterminal.com atau gunakan dex ini untuk membeli token yang terdaftar.
Ston.fi
DeDust.io

4
720
·
--
Bullish
Bagian dari PENDIDIKAN ini selalu menghangatkan hati saya dari Binance ke seluruh dunia.
#BNB 💛
Bagian dari PENDIDIKAN ini selalu menghangatkan hati saya dari Binance ke seluruh dunia.
#BNB 💛
#BNB 💛


Binance Square Official
·
--
Cara Menulis Artikel Panjang di Square
202
·
--
Bullish
Pemikiran saya juga untuk dunia DEFI saat ini adalah mari kita merangkul lebih banyak Teknologi dan inovasi dan ide tidak akan menjadi kekurangan dalam ruang kripto sepenuhnya..
Jadilah produktif
Terhubung
Bersikaplah terbuka
Pemikiran saya juga untuk dunia DEFI saat ini adalah mari kita merangkul lebih banyak Teknologi dan inovasi dan ide tidak akan menjadi kekurangan dalam ruang kripto sepenuhnya..
Jadilah produktif
Terhubung
Bersikaplah terbuka
Jadilah produktif
Terhubung
Bersikaplah terbuka
5
269
·
--
#MarketSentimentToday Menurut saya pasar berada pada posisi doji saat ini dan kita harus sangat berhati-hati saat mengambil keputusan..
#MarketSentimentToday Menurut saya pasar berada pada posisi doji saat ini dan kita harus sangat berhati-hati saat mengambil keputusan..
5
3k
·
--
Bullish
Sebagai pengembang yang mempelajari dan juga mengkode layar apa yang Anda sukai saat berada di layar.
▪︎Layar terang
▪︎Layar gelap
mari kita bicara.
Sebagai pengembang yang mempelajari dan juga mengkode layar apa yang Anda sukai saat berada di layar.
▪︎Layar terang
▪︎Layar gelap
mari kita bicara.
▪︎Layar terang
▪︎Layar gelap
mari kita bicara.
1
2
5.5k
Masuk untuk menjelajahi konten lainnya
Bergabunglah dengan pengguna kripto global di Binance Square
⚡️ Dapatkan informasi terbaru dan berguna tentang kripto.
💬 Dipercayai oleh bursa kripto terbesar di dunia.
👍 Temukan wawasan nyata dari kreator terverifikasi.
Email/Nomor Ponsel
Topik Sedang Tren
UKFCAWinsCourtOrderToRecover851400Pounds
40,422 penayangan
851 Berdiskusi
🚨 REGULASI KRIPTO BARU SAJA MASUK FASE BARU: MEREKA BUKAN HANYA MENULIS ATURAN — MEREKA MENGAMBIL UANG KEMBALI.
FCA Inggris telah mengamankan pemulihan aset lain yang didukung keputusan pengadilan, memperkuat dorongan penegakan yang lebih luas terhadap aktivitas keuangan dan kripto yang tidak berizin.
Dan lihat apa yang terjadi secara bersamaan:
🇬🇧 FCA → penegakan + pemulihan aset
🇺🇸 SEC → aturan yang lebih jelas untuk aset kripto fungsional
🇺🇸 Fed → pengawasan resmi stablecoin di bawah Undang-Undang GENIUS
Kombinasi itu penting.
Regulator kini tidak lagi memperdebatkan apakah kripto berada di dalam sistem keuangan.
Mereka semakin memutuskan siapa yang boleh mengakses, aturan apa yang harus mereka ikuti, dan apa yang terjadi ketika aturan tersebut dilanggar.
Siklus kripto berikutnya mungkin bukan “regulasi vs inovasi.”
Bisa jadi kripto yang teregulasi vs semua orang yang tidak bisa memenuhi standar. 👀
$COIN $CRCL $BTC
#ukfcawinscourtordertorecover851400pounds #ChainlinkLaunchesCCIP2WithEnterpriseVerification #GoldFallsTo$4144 #QNTFallsOver40%FromMorningHigh #USDTAdds845900HoldersInPast7Days
KimHotbae
·Disukai 3 Kali
·4.4k penayangan
ChainlinkLaunchesCCIP2WithEnterpriseVerification
52,434 penayangan
1,014 Berdiskusi
GoldFallsTo$4144
17,744 penayangan
169 Berdiskusi