

iamosita
1.7k Posting

iamosita
Laporkan
Blokir Pengguna
I am a content creator focused on technology, with a strong emphasis on Web3 project development. I create and share insightful content around Blockchain...
Perdagangan Terbuka
Pedagang Sesekali
5.8 Tahun
20 Mengikuti
69 Pengikut
140 Disukai
Posting
Portofolio
Semua
Kuotasi
Video
PINNED
·
--
Artikel
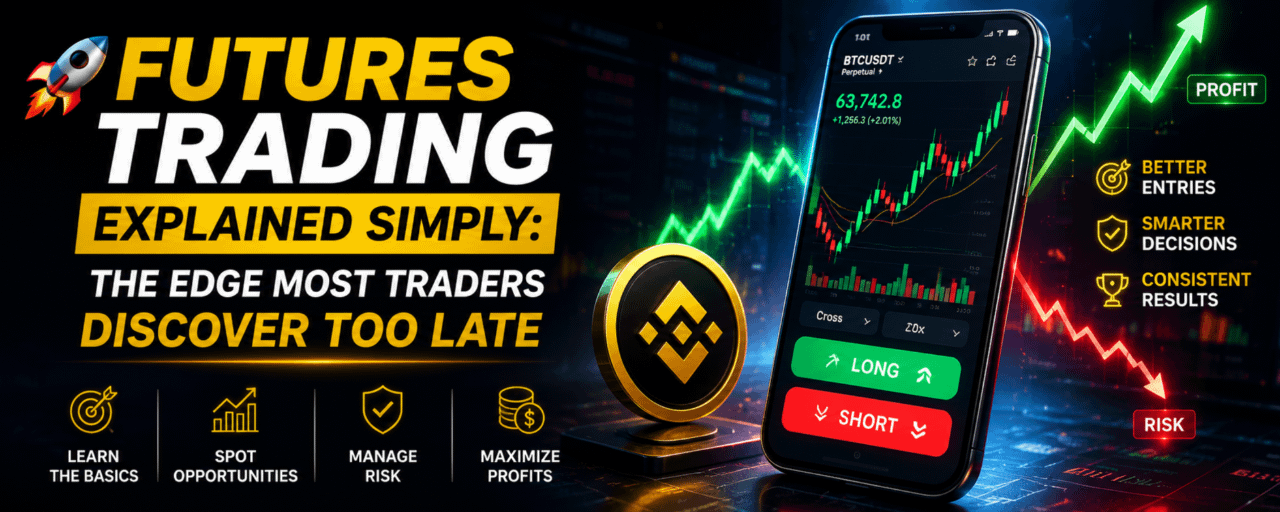
Trading Futures Dijelaskan Dengan Simpel: Keunggulan yang Terlambat Disadari Kebanyakan Trader,
,
: Pasar tidak membingungkan…
Kamu hanya tidak pernah diajarkan cara yang benar.
Kebanyakan pemula langsung terjun ke futures demi mengejar profit—
Dan akhirnya belajar dengan cara yang sulit.
Tapi para profesional?
Mereka mulai dengan memahami permainannya dulu.
🧠 Apa itu Trading Futures?
Pada intinya, trading futures itu sederhana:
👉 Kontrak untuk membeli atau menjual aset pada harga di masa depan
Itu saja.
Tapi di sinilah semuanya jadi kuat 👇
📈 Ada Dua Cara untuk Untung
🔹 LONG (Beli)
Kamu untung saat harga NAIK
🔹 SHORT (Jual)
Kamu untung saat harga TURUN
Trading Futures Dijelaskan Dengan Simpel: Keunggulan yang Terlambat Disadari Kebanyakan Trader
,
,
: Pasar tidak membingungkan…
Kamu hanya tidak pernah diajarkan cara yang benar.
Kebanyakan pemula langsung terjun ke futures demi mengejar profit—
Dan akhirnya belajar dengan cara yang sulit.
Tapi para profesional?
Mereka mulai dengan memahami permainannya dulu.
🧠 Apa itu Trading Futures?
Pada intinya, trading futures itu sederhana:
👉 Kontrak untuk membeli atau menjual aset pada harga di masa depan
Itu saja.
Tapi di sinilah semuanya jadi kuat 👇
📈 Ada Dua Cara untuk Untung
🔹 LONG (Beli)
Kamu untung saat harga NAIK
🔹 SHORT (Jual)
Kamu untung saat harga TURUN
,
: Pasar tidak membingungkan…
Kamu hanya tidak pernah diajarkan cara yang benar.
Kebanyakan pemula langsung terjun ke futures demi mengejar profit—
Dan akhirnya belajar dengan cara yang sulit.
Tapi para profesional?
Mereka mulai dengan memahami permainannya dulu.
🧠 Apa itu Trading Futures?
Pada intinya, trading futures itu sederhana:
👉 Kontrak untuk membeli atau menjual aset pada harga di masa depan
Itu saja.
Tapi di sinilah semuanya jadi kuat 👇
📈 Ada Dua Cara untuk Untung
🔹 LONG (Beli)
Kamu untung saat harga NAIK
🔹 SHORT (Jual)
Kamu untung saat harga TURUN
2
852
PINNED
·
--
Sebagian Benar
Artikel
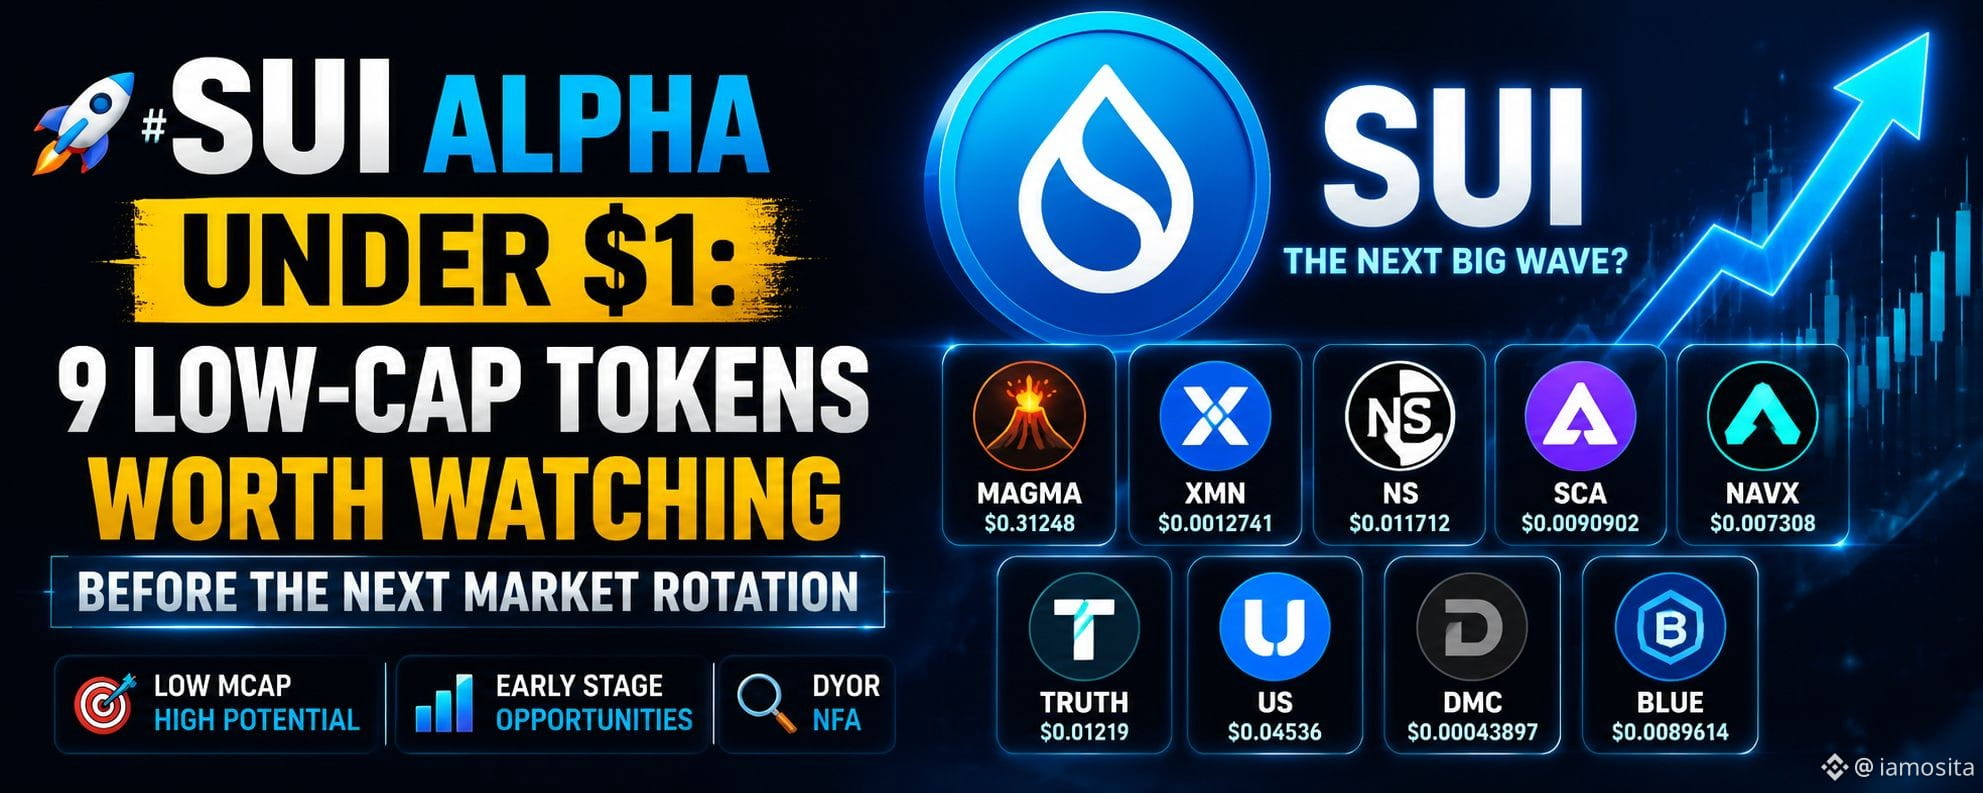
SUI Alpha di Bawah $1: 9 Token Low-Cap yang Layak Diperhatikan Sebelum Rotasi Pasar Berikutnya# 🚀 $SUI Alpha di Bawah $1: 9 Token Low-Cap yang Layak Diperhatikan Sebelum Rotasi Pasar Berikutnya
Peluang terbesar tidak selalu datang dari token yang sudah menjadi sorotan. Kadang, peluang itu muncul ketika pasar masih melihat ke tempat lain.
Ekosistem SUI Alpha terus menarik perhatian dari para trader yang mencari peluang tahap awal. Dengan sebagian besar token ini masih diperdagangkan di bawah $1, fokus beralih ke proyek yang menunjukkan akumulasi yang tenang, momentum yang membaik, atau potensi pengaturan pemulihan.
SUI Alpha di Bawah $1: 9 Token Low-Cap yang Layak Diperhatikan Sebelum Rotasi Pasar Berikutnya
# 🚀 $SUI Alpha di Bawah $1: 9 Token Low-Cap yang Layak Diperhatikan Sebelum Rotasi Pasar Berikutnya
Peluang terbesar tidak selalu datang dari token yang sudah menjadi sorotan. Kadang, peluang itu muncul ketika pasar masih melihat ke tempat lain.
Ekosistem SUI Alpha terus menarik perhatian dari para trader yang mencari peluang tahap awal. Dengan sebagian besar token ini masih diperdagangkan di bawah $1, fokus beralih ke proyek yang menunjukkan akumulasi yang tenang, momentum yang membaik, atau potensi pengaturan pemulihan.
Peluang terbesar tidak selalu datang dari token yang sudah menjadi sorotan. Kadang, peluang itu muncul ketika pasar masih melihat ke tempat lain.
Ekosistem SUI Alpha terus menarik perhatian dari para trader yang mencari peluang tahap awal. Dengan sebagian besar token ini masih diperdagangkan di bawah $1, fokus beralih ke proyek yang menunjukkan akumulasi yang tenang, momentum yang membaik, atau potensi pengaturan pemulihan.
3
3
1.3k
·
--
$XRP IS BERGERAK—TAPI APA CUKUP?
{spot}(XRPUSDT)
XRP berada di sekitar $1,50, naik 1,06%, dengan volume lebih dari $1B.
Itu menempatkan XRP di depan $BTC dan ETH hari ini.
Tapi ada pelajaran yang lebih besar.
Satu candle hijau saja tidak menceritakan seluruh kisah.
Para trader perlu bertanya:
📌 Apakah volume meningkat?
📌 Apakah harga menembus resistance?
📌 Apakah momentum lebih kuat dibanding pasar yang lebih luas?
📌 Apakah BTC mendukung?
🔎 PENEMUAN:
Pergerakan XRP menjadi lebih menarik ketika beberapa sinyal saling bersekutu.
Satu persen hijau saja hanyalah permulaan.
Jangan pernah mengira “hijau” sama dengan “konfirmasi bullish”.
Apakah Anda akan trading XRP sekarang—atau menunggu konfirmasi?
#XRP #Ripple #CryptoTrading #BinanceSquare #Altcoins
$XRP IS BERGERAK—TAPI APA CUKUP?
XRP berada di sekitar $1,50, naik 1,06%, dengan volume lebih dari $1B.
Itu menempatkan XRP di depan $BTC dan ETH hari ini.
Tapi ada pelajaran yang lebih besar.
Satu candle hijau saja tidak menceritakan seluruh kisah.
Para trader perlu bertanya:
📌 Apakah volume meningkat?
📌 Apakah harga menembus resistance?
📌 Apakah momentum lebih kuat dibanding pasar yang lebih luas?
📌 Apakah BTC mendukung?
🔎 PENEMUAN:
Pergerakan XRP menjadi lebih menarik ketika beberapa sinyal saling bersekutu.
Satu persen hijau saja hanyalah permulaan.
Jangan pernah mengira “hijau” sama dengan “konfirmasi bullish”.
Apakah Anda akan trading XRP sekarang—atau menunggu konfirmasi?
#XRP #Ripple #CryptoTrading #BinanceSquare #Altcoins
XRP berada di sekitar $1,50, naik 1,06%, dengan volume lebih dari $1B.
Itu menempatkan XRP di depan $BTC dan ETH hari ini.
Tapi ada pelajaran yang lebih besar.
Satu candle hijau saja tidak menceritakan seluruh kisah.
Para trader perlu bertanya:
📌 Apakah volume meningkat?
📌 Apakah harga menembus resistance?
📌 Apakah momentum lebih kuat dibanding pasar yang lebih luas?
📌 Apakah BTC mendukung?
🔎 PENEMUAN:
Pergerakan XRP menjadi lebih menarik ketika beberapa sinyal saling bersekutu.
Satu persen hijau saja hanyalah permulaan.
Jangan pernah mengira “hijau” sama dengan “konfirmasi bullish”.
Apakah Anda akan trading XRP sekarang—atau menunggu konfirmasi?
#XRP #Ripple #CryptoTrading #BinanceSquare #Altcoins
5
·
--
Lihat terjemahan
$BNB JUST STOOD OUT
{spot}(BNBUSDT)
BNB is trading near $788, up 2.96%.
Compare that with:
$BTC +0.57%
$ETH +0.62%
$SOL +1.35%
BNB is moving considerably faster.
🔎 THE DISCOVERY:
When a major-cap asset outperforms BTC and ETH, traders should ask:
Is capital rotating into this ecosystem?
BNB also carries an approximately $104.9B market cap, making this move more significant than a random low-cap pump.
But remember:
Strong performance does NOT automatically mean “buy.”
After a sharp move, traders should watch volume, support, resistance and whether momentum continues.
🎯 LESSON:
Relative strength can reveal where market attention is moving.
Would you chase BNB after +2.96%, or wait for a pullback?
#BNB #Binance #Crypto #CryptoTrading #BinanceSquare
$BNB JUST STOOD OUT
BNB is trading near $788, up 2.96%.
Compare that with:
$BTC +0.57%
$ETH +0.62%
$SOL +1.35%
BNB is moving considerably faster.
🔎 THE DISCOVERY:
When a major-cap asset outperforms BTC and ETH, traders should ask:
Is capital rotating into this ecosystem?
BNB also carries an approximately $104.9B market cap, making this move more significant than a random low-cap pump.
But remember:
Strong performance does NOT automatically mean “buy.”
After a sharp move, traders should watch volume, support, resistance and whether momentum continues.
🎯 LESSON:
Relative strength can reveal where market attention is moving.
Would you chase BNB after +2.96%, or wait for a pullback?
#BNB #Binance #Crypto #CryptoTrading #BinanceSquare
BNB is trading near $788, up 2.96%.
Compare that with:
$BTC +0.57%
$ETH +0.62%
$SOL +1.35%
BNB is moving considerably faster.
🔎 THE DISCOVERY:
When a major-cap asset outperforms BTC and ETH, traders should ask:
Is capital rotating into this ecosystem?
BNB also carries an approximately $104.9B market cap, making this move more significant than a random low-cap pump.
But remember:
Strong performance does NOT automatically mean “buy.”
After a sharp move, traders should watch volume, support, resistance and whether momentum continues.
🎯 LESSON:
Relative strength can reveal where market attention is moving.
Would you chase BNB after +2.96%, or wait for a pullback?
#BNB #Binance #Crypto #CryptoTrading #BinanceSquare
·
--
Lihat terjemahan
$ETH IS SHOWING A QUIET SIGNAL
{spot}(ETHUSDT)
Ethereum is around $2,698, up 0.62%, with approximately $4.41B in volume.
That looks ordinary.
But crypto traders know something important:
Small moves can become bigger rotations.
$BTC is +0.57%.
{spot}(BTCUSDT)
ETH is +0.62%.
ETH is slightly outperforming Bitcoin today.
🔎 THE DISCOVERY:
When ETH begins gaining relative strength, traders often start watching the broader altcoin market.
Look at the chain reaction:
BTC → ETH → SOL/BNB → Altcoins
This doesn’t guarantee a rally.
It simply tells us where attention could move next.
🎯 DAY 2 LESSON:
Don’t judge Ethereum only by its percentage gain. Compare its performance with BTC.
Would you rather see ETH outperform BTC or BTC dominate the market?
#ETH #Ethereum #CryptoTrading #BinanceSquare #Web3
$ETH IS SHOWING A QUIET SIGNAL
Ethereum is around $2,698, up 0.62%, with approximately $4.41B in volume.
That looks ordinary.
But crypto traders know something important:
Small moves can become bigger rotations.
$BTC is +0.57%.
ETH is +0.62%.
ETH is slightly outperforming Bitcoin today.
🔎 THE DISCOVERY:
When ETH begins gaining relative strength, traders often start watching the broader altcoin market.
Look at the chain reaction:
BTC → ETH → SOL/BNB → Altcoins
This doesn’t guarantee a rally.
It simply tells us where attention could move next.
🎯 DAY 2 LESSON:
Don’t judge Ethereum only by its percentage gain. Compare its performance with BTC.
Would you rather see ETH outperform BTC or BTC dominate the market?
#ETH #Ethereum #CryptoTrading #BinanceSquare #Web3
Ethereum is around $2,698, up 0.62%, with approximately $4.41B in volume.
That looks ordinary.
But crypto traders know something important:
Small moves can become bigger rotations.
$BTC is +0.57%.
ETH is +0.62%.
ETH is slightly outperforming Bitcoin today.
🔎 THE DISCOVERY:
When ETH begins gaining relative strength, traders often start watching the broader altcoin market.
Look at the chain reaction:
BTC → ETH → SOL/BNB → Altcoins
This doesn’t guarantee a rally.
It simply tells us where attention could move next.
🎯 DAY 2 LESSON:
Don’t judge Ethereum only by its percentage gain. Compare its performance with BTC.
Would you rather see ETH outperform BTC or BTC dominate the market?
#ETH #Ethereum #CryptoTrading #BinanceSquare #Web3
2
·
--
Lihat terjemahan
$BTC IS STILL THE MARKET’S COMPASS
{spot}(BTCUSDT)
Bitcoin is trading around $85,059, up 0.57%, with over $12.2B in volume and a massive $1.70T market cap.
But here’s the important part:
BTC doesn’t move alone.
When Bitcoin holds strength, traders often begin watching ETH, BNB, SOL and higher-risk altcoins for the next rotation.
Today’s numbers show moderate BTC strength—not a runaway breakout.
🔎 THE DISCOVERY:
The real question isn’t “Is BTC green?”
It’s:
Can BTC maintain momentum while altcoins attract more capital?
📊 Watch:
• BTC: $85,059
• $ETH : $2,698
• $BNB : $788
• SOL: $121
🎯 DAY 1 LESSON:
Before trading an altcoin, check Bitcoin first.
Would you rather trade BTC directly or hunt for the next altcoin breakout?
#BTC #Bitcoin #Crypto #BinanceSquare #Web3 #CryptoTrading
$BTC IS STILL THE MARKET’S COMPASS
Bitcoin is trading around $85,059, up 0.57%, with over $12.2B in volume and a massive $1.70T market cap.
But here’s the important part:
BTC doesn’t move alone.
When Bitcoin holds strength, traders often begin watching ETH, BNB, SOL and higher-risk altcoins for the next rotation.
Today’s numbers show moderate BTC strength—not a runaway breakout.
🔎 THE DISCOVERY:
The real question isn’t “Is BTC green?”
It’s:
Can BTC maintain momentum while altcoins attract more capital?
📊 Watch:
• BTC: $85,059
• $ETH : $2,698
• $BNB : $788
• SOL: $121
🎯 DAY 1 LESSON:
Before trading an altcoin, check Bitcoin first.
Would you rather trade BTC directly or hunt for the next altcoin breakout?
#BTC #Bitcoin #Crypto #BinanceSquare #Web3 #CryptoTrading
Bitcoin is trading around $85,059, up 0.57%, with over $12.2B in volume and a massive $1.70T market cap.
But here’s the important part:
BTC doesn’t move alone.
When Bitcoin holds strength, traders often begin watching ETH, BNB, SOL and higher-risk altcoins for the next rotation.
Today’s numbers show moderate BTC strength—not a runaway breakout.
🔎 THE DISCOVERY:
The real question isn’t “Is BTC green?”
It’s:
Can BTC maintain momentum while altcoins attract more capital?
📊 Watch:
• BTC: $85,059
• $ETH : $2,698
• $BNB : $788
• SOL: $121
🎯 DAY 1 LESSON:
Before trading an altcoin, check Bitcoin first.
Would you rather trade BTC directly or hunt for the next altcoin breakout?
#BTC #Bitcoin #Crypto #BinanceSquare #Web3 #CryptoTrading
6
·
--
🚨 IMX vs XAI: Dua Token Game yang Patut Diperhatikan Trader
Pasar kripto memiliki ribuan token yang bersaing memperebutkan perhatian—tetapi proyek game bisa bergerak berbeda ketika likuiditas dan narasi kembali menguat di sektor tersebut.
Dua nama yang layak dipantau adalah IMX (Immutable) dan XAI.
🎮 $IMX — Infrastruktur Game
{spot}(IMXUSDT)
Immutable berfokus membangun infrastruktur blockchain untuk game Web3. Ekosistemnya bertujuan membuat game dan aset digital lebih mudah beroperasi di-chain.
Pertanyaan utama bagi trader bukan sekadar: “Apakah gaming akan kembali?”
Melainkan:
👉 Apakah likuiditas baru akan mengalir ke ekosistem gaming yang sudah mapan saat pasar berotasi ke altcoin?
Jika narasi gaming menguat, IMX bisa menarik perhatian yang kembali—tapi trader tetap perlu memantau volume, struktur pasar, dan arah BTC.
🎮 $XAI — Blockchain yang Berfokus pada Gaming
{spot}(XAIUSDT)
XAI adalah proyek lain yang menargetkan game berbasis blockchain, dengan infrastruktur yang dirancang untuk aplikasi dan pengguna game.
Itu menciptakan perbandingan yang menarik:
IMX → narasi infrastruktur gaming yang sudah mapan
XAI → narasi blockchain yang berfokus pada gaming
Tapi bagian pentingnya adalah 👇
Narasi yang kuat tidak otomatis berarti trade yang kuat.
Sebelum masuk ke salah satu token, perhatikan:
📊 Volume perdagangan
📈 Konfirmasi breakout
🐋 Aktivitas whale
💰 Likuiditas
₿ Tren BTC
🔥 Rotasi sektor gaming
🔎 Peluang Nyata
Alih-alih bertanya “Yang mana yang akan memompa?”, tanyakan:
“Token mana yang menunjukkan permintaan lebih kuat sebelum kerumunan menyadarinya?”
Perubahan dari prediksi ke bukti—ini bisa meningkatkan cara Anda membaca peluang altcoin.
⚠️ Risiko: IMX dan XAI bisa mengalami volatilitas tajam. Jangan masuk hanya karena token sedang tren. Gunakan pengaturan ukuran posisi dan level invalidasi yang sudah ditentukan.
👇 Giliran Anda:
Jika token game mulai bergerak lagi, apakah Anda akan memantau IMX atau XAI lebih dekat—dan mengapa?
#IMX #XAI #Immutable #CryptoGaming #Web3 #Gaming #Altcoins #BinanceSquare #Crypto
🚨 IMX vs XAI: Dua Token Game yang Patut Diperhatikan Trader
Pasar kripto memiliki ribuan token yang bersaing memperebutkan perhatian—tetapi proyek game bisa bergerak berbeda ketika likuiditas dan narasi kembali menguat di sektor tersebut.
Dua nama yang layak dipantau adalah IMX (Immutable) dan XAI.
🎮 $IMX — Infrastruktur Game
Immutable berfokus membangun infrastruktur blockchain untuk game Web3. Ekosistemnya bertujuan membuat game dan aset digital lebih mudah beroperasi di-chain.
Pertanyaan utama bagi trader bukan sekadar: “Apakah gaming akan kembali?”
Melainkan:
👉 Apakah likuiditas baru akan mengalir ke ekosistem gaming yang sudah mapan saat pasar berotasi ke altcoin?
Jika narasi gaming menguat, IMX bisa menarik perhatian yang kembali—tapi trader tetap perlu memantau volume, struktur pasar, dan arah BTC.
🎮 $XAI — Blockchain yang Berfokus pada Gaming
XAI adalah proyek lain yang menargetkan game berbasis blockchain, dengan infrastruktur yang dirancang untuk aplikasi dan pengguna game.
Itu menciptakan perbandingan yang menarik:
IMX → narasi infrastruktur gaming yang sudah mapan
XAI → narasi blockchain yang berfokus pada gaming
Tapi bagian pentingnya adalah 👇
Narasi yang kuat tidak otomatis berarti trade yang kuat.
Sebelum masuk ke salah satu token, perhatikan:
📊 Volume perdagangan
📈 Konfirmasi breakout
🐋 Aktivitas whale
💰 Likuiditas
₿ Tren BTC
🔥 Rotasi sektor gaming
🔎 Peluang Nyata
Alih-alih bertanya “Yang mana yang akan memompa?”, tanyakan:
“Token mana yang menunjukkan permintaan lebih kuat sebelum kerumunan menyadarinya?”
Perubahan dari prediksi ke bukti—ini bisa meningkatkan cara Anda membaca peluang altcoin.
⚠️ Risiko: IMX dan XAI bisa mengalami volatilitas tajam. Jangan masuk hanya karena token sedang tren. Gunakan pengaturan ukuran posisi dan level invalidasi yang sudah ditentukan.
👇 Giliran Anda:
Jika token game mulai bergerak lagi, apakah Anda akan memantau IMX atau XAI lebih dekat—dan mengapa?
#IMX #XAI #Immutable #CryptoGaming #Web3 #Gaming #Altcoins #BinanceSquare #Crypto
Pasar kripto memiliki ribuan token yang bersaing memperebutkan perhatian—tetapi proyek game bisa bergerak berbeda ketika likuiditas dan narasi kembali menguat di sektor tersebut.
Dua nama yang layak dipantau adalah IMX (Immutable) dan XAI.
🎮 $IMX — Infrastruktur Game
Immutable berfokus membangun infrastruktur blockchain untuk game Web3. Ekosistemnya bertujuan membuat game dan aset digital lebih mudah beroperasi di-chain.
Pertanyaan utama bagi trader bukan sekadar: “Apakah gaming akan kembali?”
Melainkan:
👉 Apakah likuiditas baru akan mengalir ke ekosistem gaming yang sudah mapan saat pasar berotasi ke altcoin?
Jika narasi gaming menguat, IMX bisa menarik perhatian yang kembali—tapi trader tetap perlu memantau volume, struktur pasar, dan arah BTC.
🎮 $XAI — Blockchain yang Berfokus pada Gaming
XAI adalah proyek lain yang menargetkan game berbasis blockchain, dengan infrastruktur yang dirancang untuk aplikasi dan pengguna game.
Itu menciptakan perbandingan yang menarik:
IMX → narasi infrastruktur gaming yang sudah mapan
XAI → narasi blockchain yang berfokus pada gaming
Tapi bagian pentingnya adalah 👇
Narasi yang kuat tidak otomatis berarti trade yang kuat.
Sebelum masuk ke salah satu token, perhatikan:
📊 Volume perdagangan
📈 Konfirmasi breakout
🐋 Aktivitas whale
💰 Likuiditas
₿ Tren BTC
🔥 Rotasi sektor gaming
🔎 Peluang Nyata
Alih-alih bertanya “Yang mana yang akan memompa?”, tanyakan:
“Token mana yang menunjukkan permintaan lebih kuat sebelum kerumunan menyadarinya?”
Perubahan dari prediksi ke bukti—ini bisa meningkatkan cara Anda membaca peluang altcoin.
⚠️ Risiko: IMX dan XAI bisa mengalami volatilitas tajam. Jangan masuk hanya karena token sedang tren. Gunakan pengaturan ukuran posisi dan level invalidasi yang sudah ditentukan.
👇 Giliran Anda:
Jika token game mulai bergerak lagi, apakah Anda akan memantau IMX atau XAI lebih dekat—dan mengapa?
#IMX #XAI #Immutable #CryptoGaming #Web3 #Gaming #Altcoins #BinanceSquare #Crypto
4
·
--
Lihat terjemahan
🚨 $APE , $GALA & $ENJ : Are Gaming Tokens Ready for a Comeback? 🎮🔥
The market moves fast.
One day, traders ignore gaming tokens. The next, a sudden volume spike can put an entire sector back on the radar.
Today, three names are worth watching: APE, GALA and ENJ.
🎮 THE DISCOVERY
APE sits at the intersection of Web3, NFTs and the broader Ape ecosystem.
GALA focuses on blockchain gaming and digital entertainment, making it one of the more recognizable names in GameFi.
ENJ is connected to blockchain gaming infrastructure and digital assets, giving it a different angle within the gaming narrative.
But here's the important part:
👉 A narrative alone doesn't create a trade.
📊 WHAT TRADERS SHOULD WATCH
Before entering any position, look for:
• Volume expansion — Is fresh liquidity entering?
• Breakout confirmation — Is price actually breaking resistance?
• BTC direction — Are broader market conditions supportive?
• Support retest — Does the breakout hold after a pullback?
• Open interest & funding — Are leveraged traders becoming overcrowded?
A token can have a strong story and still produce a weak trade.
🧠 THE REAL GAME
If gaming tokens begin attracting liquidity again, APE, GALA and ENJ could receive increased attention.
But chasing a green candle after a sharp move can be dangerous.
The setup matters more than the ticker.
📌 Watch the volume. Watch the levels. Wait for confirmation. Manage risk.
💬 Which one are you watching most closely: APE, GALA or ENJ — and why?
#APE #GALA #ENJ #GameFi #CryptoGaming #Web3 #CryptoTrading #BinanceSquare #Altcoins #Crypto
🚨 $APE , $GALA & $ENJ : Are Gaming Tokens Ready for a Comeback? 🎮🔥
The market moves fast.
One day, traders ignore gaming tokens. The next, a sudden volume spike can put an entire sector back on the radar.
Today, three names are worth watching: APE, GALA and ENJ.
🎮 THE DISCOVERY
APE sits at the intersection of Web3, NFTs and the broader Ape ecosystem.
GALA focuses on blockchain gaming and digital entertainment, making it one of the more recognizable names in GameFi.
ENJ is connected to blockchain gaming infrastructure and digital assets, giving it a different angle within the gaming narrative.
But here's the important part:
👉 A narrative alone doesn't create a trade.
📊 WHAT TRADERS SHOULD WATCH
Before entering any position, look for:
• Volume expansion — Is fresh liquidity entering?
• Breakout confirmation — Is price actually breaking resistance?
• BTC direction — Are broader market conditions supportive?
• Support retest — Does the breakout hold after a pullback?
• Open interest & funding — Are leveraged traders becoming overcrowded?
A token can have a strong story and still produce a weak trade.
🧠 THE REAL GAME
If gaming tokens begin attracting liquidity again, APE, GALA and ENJ could receive increased attention.
But chasing a green candle after a sharp move can be dangerous.
The setup matters more than the ticker.
📌 Watch the volume. Watch the levels. Wait for confirmation. Manage risk.
💬 Which one are you watching most closely: APE, GALA or ENJ — and why?
#APE #GALA #ENJ #GameFi #CryptoGaming #Web3 #CryptoTrading #BinanceSquare #Altcoins #Crypto
The market moves fast.
One day, traders ignore gaming tokens. The next, a sudden volume spike can put an entire sector back on the radar.
Today, three names are worth watching: APE, GALA and ENJ.
🎮 THE DISCOVERY
APE sits at the intersection of Web3, NFTs and the broader Ape ecosystem.
GALA focuses on blockchain gaming and digital entertainment, making it one of the more recognizable names in GameFi.
ENJ is connected to blockchain gaming infrastructure and digital assets, giving it a different angle within the gaming narrative.
But here's the important part:
👉 A narrative alone doesn't create a trade.
📊 WHAT TRADERS SHOULD WATCH
Before entering any position, look for:
• Volume expansion — Is fresh liquidity entering?
• Breakout confirmation — Is price actually breaking resistance?
• BTC direction — Are broader market conditions supportive?
• Support retest — Does the breakout hold after a pullback?
• Open interest & funding — Are leveraged traders becoming overcrowded?
A token can have a strong story and still produce a weak trade.
🧠 THE REAL GAME
If gaming tokens begin attracting liquidity again, APE, GALA and ENJ could receive increased attention.
But chasing a green candle after a sharp move can be dangerous.
The setup matters more than the ticker.
📌 Watch the volume. Watch the levels. Wait for confirmation. Manage risk.
💬 Which one are you watching most closely: APE, GALA or ENJ — and why?
#APE #GALA #ENJ #GameFi #CryptoGaming #Web3 #CryptoTrading #BinanceSquare #Altcoins #Crypto
19
·
--
Artikel
Volume USDT $35B: Ke Mana Likuiditas Kripto Akan Bergerak Selanjutnya?Sinyal terbesar di kripto hari ini mungkin bukan harga—melainkan DI MANA uang sedang diperdagangkan.
Lihat pemimpin volume terbaru:
💵 USDT: volume $34,97B | kapitalisasi pasar $184,06B | $1,00
₿ BTC: volume $12,21B | kapitalisasi pasar $1,70T | $85.059,82
💵 USDC: volume $5,54B | kapitalisasi pasar $74,08B | $1,00
◆ ETH: volume $4,41B | kapitalisasi pasar $329,19B | $2.698,04
◎ SOL: volume $1,39B | kapitalisasi pasar $71,13B | $121,03
Sekilas, ini terlihat seperti tabel data pasar lainnya.
Tapi ada cerita yang lebih dalam.
🔎 Petunjuk Likuiditas
Volume USDT $35B: Ke Mana Likuiditas Kripto Akan Bergerak Selanjutnya?
Sinyal terbesar di kripto hari ini mungkin bukan harga—melainkan DI MANA uang sedang diperdagangkan.
Lihat pemimpin volume terbaru:
💵 USDT: volume $34,97B | kapitalisasi pasar $184,06B | $1,00
₿ BTC: volume $12,21B | kapitalisasi pasar $1,70T | $85.059,82
💵 USDC: volume $5,54B | kapitalisasi pasar $74,08B | $1,00
◆ ETH: volume $4,41B | kapitalisasi pasar $329,19B | $2.698,04
◎ SOL: volume $1,39B | kapitalisasi pasar $71,13B | $121,03
Sekilas, ini terlihat seperti tabel data pasar lainnya.
Tapi ada cerita yang lebih dalam.
🔎 Petunjuk Likuiditas
Lihat pemimpin volume terbaru:
💵 USDT: volume $34,97B | kapitalisasi pasar $184,06B | $1,00
₿ BTC: volume $12,21B | kapitalisasi pasar $1,70T | $85.059,82
💵 USDC: volume $5,54B | kapitalisasi pasar $74,08B | $1,00
◆ ETH: volume $4,41B | kapitalisasi pasar $329,19B | $2.698,04
◎ SOL: volume $1,39B | kapitalisasi pasar $71,13B | $121,03
Sekilas, ini terlihat seperti tabel data pasar lainnya.
Tapi ada cerita yang lebih dalam.
🔎 Petunjuk Likuiditas
16
·
--
Artikel
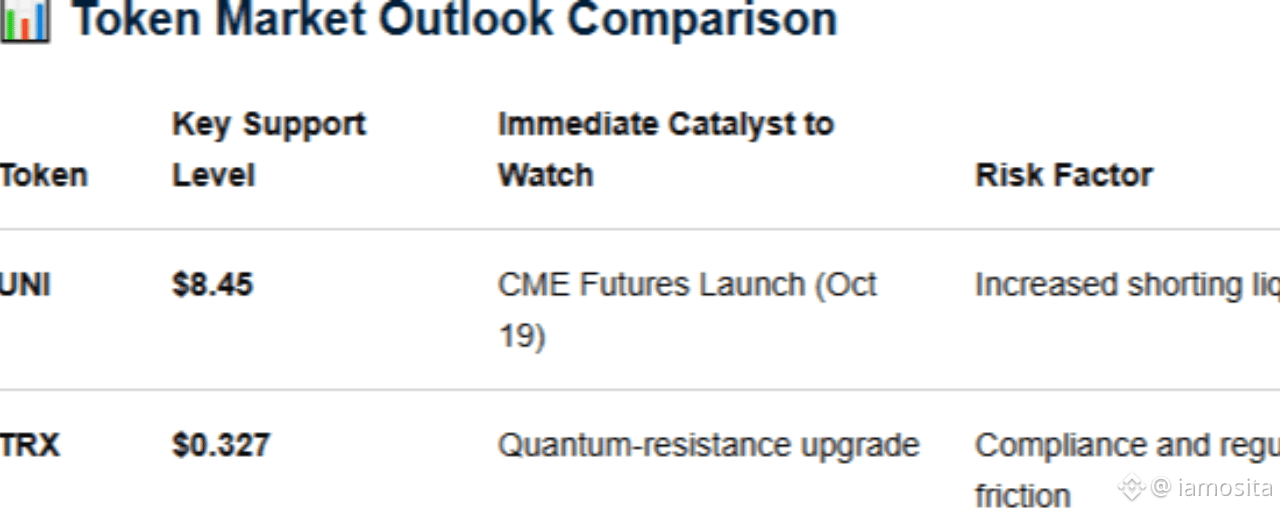
UNI & TRX Sedang Turun Sementara Pasar Tetap Kuat — Haruskah Trader Khawatir?Pasar kripto sedang menunjukkan sesuatu yang menarik saat ini:
Kebanyakan aset bertahan — tetapi Uniswap (UNI) dan TRON (TRX) bergerak ke arah yang berlawanan.
UNI turun 1,16% menjadi $9,03, sementara TRX sedikit lebih rendah di $0,3351, turun 0,06%.
Sekilas, angka-angka ini mungkin terlihat tidak signifikan.
Namun ketika hanya beberapa aset yang berada di wilayah negatif, para aset yang berkinerja lebih buruk layak mendapat perhatian.
Jadi pertanyaan sebenarnya adalah:
Apakah UNI dan TRX menunjukkan kelemahan… atau pasar hanya memberi trader kesempatan masuk yang lebih baik?
UNI & TRX Sedang Turun Sementara Pasar Tetap Kuat — Haruskah Trader Khawatir?
Pasar kripto sedang menunjukkan sesuatu yang menarik saat ini:
Kebanyakan aset bertahan — tetapi Uniswap (UNI) dan TRON (TRX) bergerak ke arah yang berlawanan.
UNI turun 1,16% menjadi $9,03, sementara TRX sedikit lebih rendah di $0,3351, turun 0,06%.
Sekilas, angka-angka ini mungkin terlihat tidak signifikan.
Namun ketika hanya beberapa aset yang berada di wilayah negatif, para aset yang berkinerja lebih buruk layak mendapat perhatian.
Jadi pertanyaan sebenarnya adalah:
Apakah UNI dan TRX menunjukkan kelemahan… atau pasar hanya memberi trader kesempatan masuk yang lebih baik?
Kebanyakan aset bertahan — tetapi Uniswap (UNI) dan TRON (TRX) bergerak ke arah yang berlawanan.
UNI turun 1,16% menjadi $9,03, sementara TRX sedikit lebih rendah di $0,3351, turun 0,06%.
Sekilas, angka-angka ini mungkin terlihat tidak signifikan.
Namun ketika hanya beberapa aset yang berada di wilayah negatif, para aset yang berkinerja lebih buruk layak mendapat perhatian.
Jadi pertanyaan sebenarnya adalah:
Apakah UNI dan TRX menunjukkan kelemahan… atau pasar hanya memberi trader kesempatan masuk yang lebih baik?
13
·
--
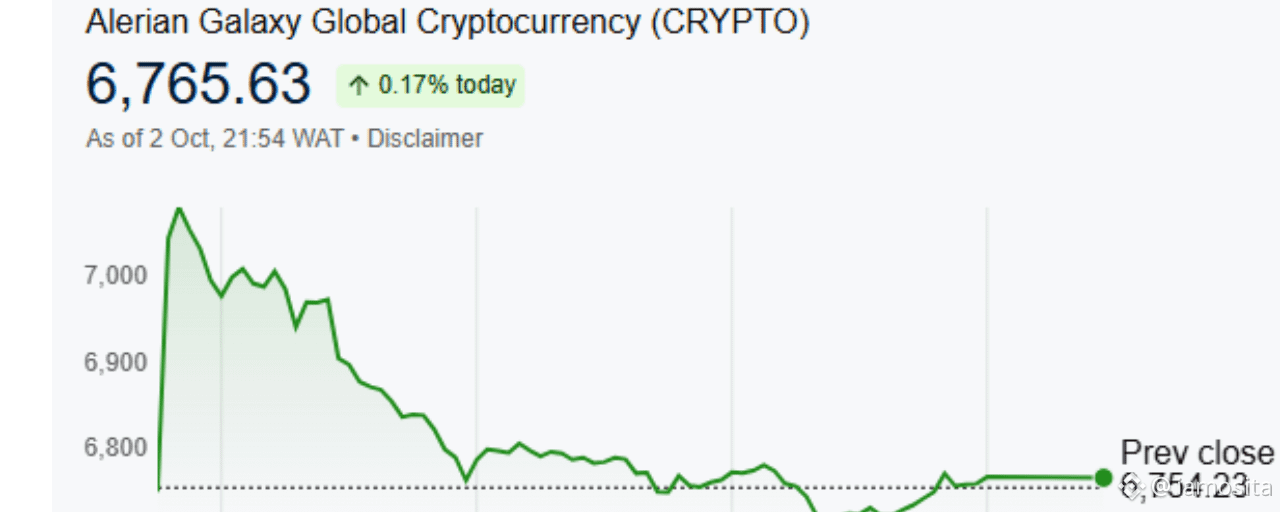
Artikel
TOP 5 CRYPTO GAINERS: Pasar Sedang Berotasi — Tapi Di Mana Peluang Nyatanya?PUMP +16.60% 🚀 | WLD +6.69% | TAO +5.19% | BNB +2.96% | GRAM +2.61%
Pasar baru saja memberi trader petunjuk penting.
Ketika gainer 24 jam terbesar mencakup Pump.Fun, Worldcoin, Bittensor, BNB, dan Gram, ini bukan sekadar daftar candle hijau.
Ini menunjukkan ke mana perhatian pasar dan modal sedang bergerak sekarang.
Tapi inilah bagian berbahayanya:
👉 Sebuah koin yang masuk dalam jajaran top gainer tidak otomatis berarti itu koin berikutnya untuk dibeli.
Mari kita uraikan apa yang mungkin sedang diberitahukan pasar kepada kita.
🥇 1. PUMP — Pemimpin Momentum
TOP 5 CRYPTO GAINERS: Pasar Sedang Berotasi — Tapi Di Mana Peluang Nyatanya?
PUMP +16.60% 🚀 | WLD +6.69% | TAO +5.19% | BNB +2.96% | GRAM +2.61%
Pasar baru saja memberi trader petunjuk penting.
Ketika gainer 24 jam terbesar mencakup Pump.Fun, Worldcoin, Bittensor, BNB, dan Gram, ini bukan sekadar daftar candle hijau.
Ini menunjukkan ke mana perhatian pasar dan modal sedang bergerak sekarang.
Tapi inilah bagian berbahayanya:
👉 Sebuah koin yang masuk dalam jajaran top gainer tidak otomatis berarti itu koin berikutnya untuk dibeli.
Mari kita uraikan apa yang mungkin sedang diberitahukan pasar kepada kita.
🥇 1. PUMP — Pemimpin Momentum
Pasar baru saja memberi trader petunjuk penting.
Ketika gainer 24 jam terbesar mencakup Pump.Fun, Worldcoin, Bittensor, BNB, dan Gram, ini bukan sekadar daftar candle hijau.
Ini menunjukkan ke mana perhatian pasar dan modal sedang bergerak sekarang.
Tapi inilah bagian berbahayanya:
👉 Sebuah koin yang masuk dalam jajaran top gainer tidak otomatis berarti itu koin berikutnya untuk dibeli.
Mari kita uraikan apa yang mungkin sedang diberitahukan pasar kepada kita.
🥇 1. PUMP — Pemimpin Momentum
48
·
--
🚨 SNX, SAND & MANA: 3 Altcoin yang Harus Dipantau Trader
Pasar sering memberi petunjuk sebelum orang banyak mulai memperhatikan.
Dan tiga nama yang layak dicermati adalah SNX, SAND, dan MANA. 👀
Tapi ini pertanyaan penting:
Apakah token-token ini sedang bersiap untuk pergerakan yang lebih besar — atau trader hanya mengejar narasi lama?
🔎 1. $SNX X — Narasi DeFi
{spot}(SNXUSDT)
Synthetix berada di ekosistem DeFi dan secara historis menarik perhatian ketika perdagangan terdesentralisasi serta narasi aset sintetis kembali menjadi sorotan.
Jika likuiditas DeFi mulai berputar kembali ke protokol yang sudah mapan, SNX bisa menjadi token yang dipantau trader untuk momentum.
🎮 2. $SAND — Narasi Metaverse
{spot}(SANDUSDT)
The Sandbox tetap terhubung dengan narasi game blockchain dan dunia virtual yang lebih luas.
Jika token game dan metaverse kembali mendapat perhatian pasar, SAND bisa mengalami spekulasi dan aktivitas trading yang diperbarui.
🌐 3. $MANA — Dunia Virtual
{spot}(MANAUSDT)
Decentraland adalah nama lain yang mudah dikenali dari siklus metaverse.
MANA menjadi menarik ketika trader mulai mencari token-token lama yang bisa diuntungkan dari narasi dunia virtual yang kembali menggema.
📊 GAMBARAN BESAR
SNX, SAND, dan MANA memiliki kesamaan:
Mereka adalah token yang sudah mapan dan terhubung dengan narasi yang bisa kembali dengan cepat saat sentimen pasar berubah.
Tapi narasi ≠ jaminan pump.
Sebelum masuk ke perdagangan, perhatikan:
• Arah BTC
• Volume trading
• Konfirmasi breakout
• Support/resistance
• Open interest
• Funding rate
• Likuiditas altcoin secara keseluruhan
⚠️ Jangan membeli hanya karena sebuah token “lama” atau pernah dipompa sebelumnya. Tunggu bukti.
💬 Yang mana paling kamu pantau: SNX, SAND, atau MANA — dan kenapa?
#SNX #SAND #MANA #Altcoins #Crypto #BinanceSquare #DeFi #Metaverse #CryptoTrading #Web3
🚨 SNX, SAND & MANA: 3 Altcoin yang Harus Dipantau Trader
Pasar sering memberi petunjuk sebelum orang banyak mulai memperhatikan.
Dan tiga nama yang layak dicermati adalah SNX, SAND, dan MANA. 👀
Tapi ini pertanyaan penting:
Apakah token-token ini sedang bersiap untuk pergerakan yang lebih besar — atau trader hanya mengejar narasi lama?
🔎 1. $SNX X — Narasi DeFi
Synthetix berada di ekosistem DeFi dan secara historis menarik perhatian ketika perdagangan terdesentralisasi serta narasi aset sintetis kembali menjadi sorotan.
Jika likuiditas DeFi mulai berputar kembali ke protokol yang sudah mapan, SNX bisa menjadi token yang dipantau trader untuk momentum.
🎮 2. $SAND — Narasi Metaverse
The Sandbox tetap terhubung dengan narasi game blockchain dan dunia virtual yang lebih luas.
Jika token game dan metaverse kembali mendapat perhatian pasar, SAND bisa mengalami spekulasi dan aktivitas trading yang diperbarui.
🌐 3. $MANA — Dunia Virtual
Decentraland adalah nama lain yang mudah dikenali dari siklus metaverse.
MANA menjadi menarik ketika trader mulai mencari token-token lama yang bisa diuntungkan dari narasi dunia virtual yang kembali menggema.
📊 GAMBARAN BESAR
SNX, SAND, dan MANA memiliki kesamaan:
Mereka adalah token yang sudah mapan dan terhubung dengan narasi yang bisa kembali dengan cepat saat sentimen pasar berubah.
Tapi narasi ≠ jaminan pump.
Sebelum masuk ke perdagangan, perhatikan:
• Arah BTC
• Volume trading
• Konfirmasi breakout
• Support/resistance
• Open interest
• Funding rate
• Likuiditas altcoin secara keseluruhan
⚠️ Jangan membeli hanya karena sebuah token “lama” atau pernah dipompa sebelumnya. Tunggu bukti.
💬 Yang mana paling kamu pantau: SNX, SAND, atau MANA — dan kenapa?
#SNX #SAND #MANA #Altcoins #Crypto #BinanceSquare #DeFi #Metaverse #CryptoTrading #Web3
Pasar sering memberi petunjuk sebelum orang banyak mulai memperhatikan.
Dan tiga nama yang layak dicermati adalah SNX, SAND, dan MANA. 👀
Tapi ini pertanyaan penting:
Apakah token-token ini sedang bersiap untuk pergerakan yang lebih besar — atau trader hanya mengejar narasi lama?
🔎 1. $SNX X — Narasi DeFi
Synthetix berada di ekosistem DeFi dan secara historis menarik perhatian ketika perdagangan terdesentralisasi serta narasi aset sintetis kembali menjadi sorotan.
Jika likuiditas DeFi mulai berputar kembali ke protokol yang sudah mapan, SNX bisa menjadi token yang dipantau trader untuk momentum.
🎮 2. $SAND — Narasi Metaverse
The Sandbox tetap terhubung dengan narasi game blockchain dan dunia virtual yang lebih luas.
Jika token game dan metaverse kembali mendapat perhatian pasar, SAND bisa mengalami spekulasi dan aktivitas trading yang diperbarui.
🌐 3. $MANA — Dunia Virtual
Decentraland adalah nama lain yang mudah dikenali dari siklus metaverse.
MANA menjadi menarik ketika trader mulai mencari token-token lama yang bisa diuntungkan dari narasi dunia virtual yang kembali menggema.
📊 GAMBARAN BESAR
SNX, SAND, dan MANA memiliki kesamaan:
Mereka adalah token yang sudah mapan dan terhubung dengan narasi yang bisa kembali dengan cepat saat sentimen pasar berubah.
Tapi narasi ≠ jaminan pump.
Sebelum masuk ke perdagangan, perhatikan:
• Arah BTC
• Volume trading
• Konfirmasi breakout
• Support/resistance
• Open interest
• Funding rate
• Likuiditas altcoin secara keseluruhan
⚠️ Jangan membeli hanya karena sebuah token “lama” atau pernah dipompa sebelumnya. Tunggu bukti.
💬 Yang mana paling kamu pantau: SNX, SAND, atau MANA — dan kenapa?
#SNX #SAND #MANA #Altcoins #Crypto #BinanceSquare #DeFi #Metaverse #CryptoTrading #Web3
15
·
--
Artikel
Lihat terjemahan
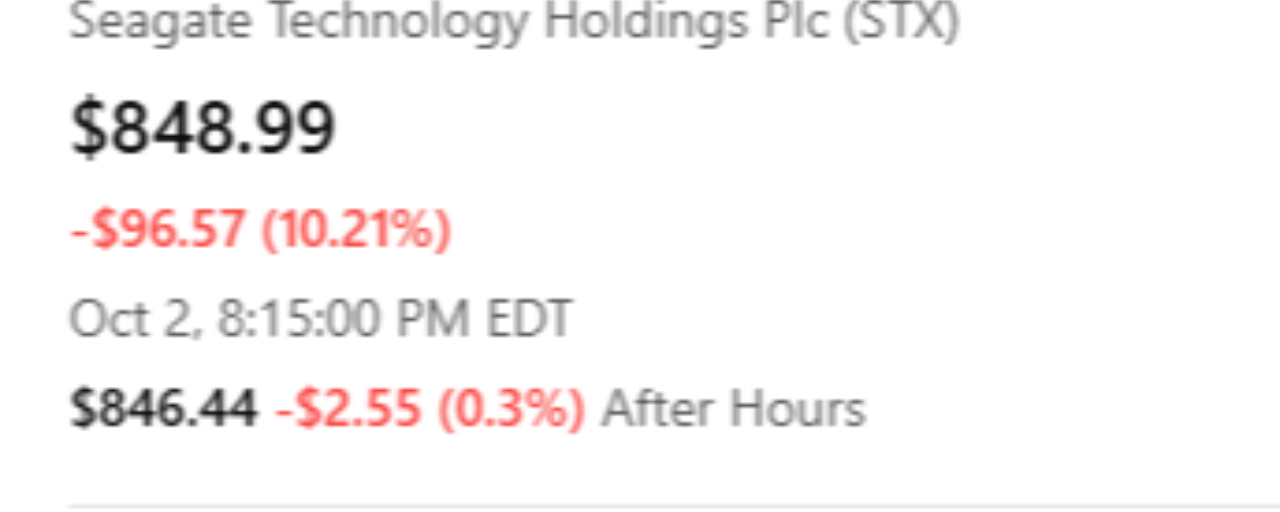
STX -10.21%: AI Storage Boom Meets a New Threat — Is This Dip a Trap?Seagate Technology Holdings (NASDAQ: STX) just gave investors a serious reality check.
STX closed at $848.99, down 10.21%, while extended trading showed the stock around $846.40. Trading volume exploded to roughly 13.5M shares, far above its recent average.
But here’s the interesting part:
The AI story hasn't disappeared.
So why did investors suddenly hit the sell button?
🔎 THE PROBLEM: MORE HDD SUPPLY?
The major catalyst was a report that Toshiba plans to significantly expand hard-disk-drive production for AI data centers, with an ambitious goal of increasing its market share.
That immediately triggered fears that additional supply could eventually weaken pricing power for established HDD leaders such as Seagate and Western Digital.
And the market reacted fast.
STX had closed at $945.57 on October 1 before plunging to $848.99 on October 2.
That's not just a normal red candle.
That's the market repricing expectations.
🧠 BUT DON'T MISS THE BIGGER PICTURE
Seagate has been one of the major beneficiaries of the explosion in AI and data-center storage demand.
More AI models → more data
More data centers → more storage
More storage → greater demand for high-capacity drives.
That demand helped STX deliver an enormous long-term rally. The stock remains dramatically above where it traded a year ago.
The question now is whether future supply growth can catch up with AI-driven demand.
That's the real battle.
📊 WHAT THE PRICE IS TELLING TRADERS
STX's October 2 session produced a wide trading range, with the stock reaching roughly $791.75–$852.29 before closing at $848.99.
That makes the $790–$800 area an important zone to watch.
If buyers defend that area and STX begins reclaiming higher levels, the sell-off could eventually look like a major shakeout.
But if price continues making lower highs and breaks below the recent low, the market could be signaling that the correction isn't finished.
🐂 BULLISH SCENARIO
STX holds the sell-off low → buyers return → price reclaims resistance → momentum starts rebuilding.
🐻 BEARISH SCENARIO
Toshiba's expansion raises long-term supply concerns → margins/pricing expectations weaken → STX loses support → deeper correction follows.
⚠️ ONE MORE THING
Recent insider-sale filings also show CEO William D. Mosley sold shares under a Rule 10b5-1 preset trading plan. That does not automatically mean management is bearish, but traders may still watch insider activity closely during a volatile period.
🎯 THE REAL QUESTION
Is the STX -10.21% move the beginning of a bigger breakdown...
or is the market simply overreacting to a future supply threat while AI storage demand remains strong?
Don't blindly buy the dip. Don't blindly short the crash.
Watch price + volume + support + the evolving AI storage supply story.
That combination could tell traders what the next major $STX move looks like.
{spot}(STXUSDT)
💬 What would you do at $848 — BUY the dip, WAIT for confirmation, or SHORT the rebound?
#STX #Seagate #AI #ArtificialIntelligence #Stocks #TechStocks #StockMarket #DataCenters #Trading #Investing
STX -10.21%: AI Storage Boom Meets a New Threat — Is This Dip a Trap?
Seagate Technology Holdings (NASDAQ: STX) just gave investors a serious reality check.
STX closed at $848.99, down 10.21%, while extended trading showed the stock around $846.40. Trading volume exploded to roughly 13.5M shares, far above its recent average.
But here’s the interesting part:
The AI story hasn't disappeared.
So why did investors suddenly hit the sell button?
🔎 THE PROBLEM: MORE HDD SUPPLY?
The major catalyst was a report that Toshiba plans to significantly expand hard-disk-drive production for AI data centers, with an ambitious goal of increasing its market share.
That immediately triggered fears that additional supply could eventually weaken pricing power for established HDD leaders such as Seagate and Western Digital.
And the market reacted fast.
STX had closed at $945.57 on October 1 before plunging to $848.99 on October 2.
That's not just a normal red candle.
That's the market repricing expectations.
🧠 BUT DON'T MISS THE BIGGER PICTURE
Seagate has been one of the major beneficiaries of the explosion in AI and data-center storage demand.
More AI models → more data
More data centers → more storage
More storage → greater demand for high-capacity drives.
That demand helped STX deliver an enormous long-term rally. The stock remains dramatically above where it traded a year ago.
The question now is whether future supply growth can catch up with AI-driven demand.
That's the real battle.
📊 WHAT THE PRICE IS TELLING TRADERS
STX's October 2 session produced a wide trading range, with the stock reaching roughly $791.75–$852.29 before closing at $848.99.
That makes the $790–$800 area an important zone to watch.
If buyers defend that area and STX begins reclaiming higher levels, the sell-off could eventually look like a major shakeout.
But if price continues making lower highs and breaks below the recent low, the market could be signaling that the correction isn't finished.
🐂 BULLISH SCENARIO
STX holds the sell-off low → buyers return → price reclaims resistance → momentum starts rebuilding.
🐻 BEARISH SCENARIO
Toshiba's expansion raises long-term supply concerns → margins/pricing expectations weaken → STX loses support → deeper correction follows.
⚠️ ONE MORE THING
Recent insider-sale filings also show CEO William D. Mosley sold shares under a Rule 10b5-1 preset trading plan. That does not automatically mean management is bearish, but traders may still watch insider activity closely during a volatile period.
🎯 THE REAL QUESTION
Is the STX -10.21% move the beginning of a bigger breakdown...
or is the market simply overreacting to a future supply threat while AI storage demand remains strong?
Don't blindly buy the dip. Don't blindly short the crash.
Watch price + volume + support + the evolving AI storage supply story.
That combination could tell traders what the next major $STX move looks like.
💬 What would you do at $848 — BUY the dip, WAIT for confirmation, or SHORT the rebound?
#STX #Seagate #AI #ArtificialIntelligence #Stocks #TechStocks #StockMarket #DataCenters #Trading #Investing
STX closed at $848.99, down 10.21%, while extended trading showed the stock around $846.40. Trading volume exploded to roughly 13.5M shares, far above its recent average.
But here’s the interesting part:
The AI story hasn't disappeared.
So why did investors suddenly hit the sell button?
🔎 THE PROBLEM: MORE HDD SUPPLY?
The major catalyst was a report that Toshiba plans to significantly expand hard-disk-drive production for AI data centers, with an ambitious goal of increasing its market share.
That immediately triggered fears that additional supply could eventually weaken pricing power for established HDD leaders such as Seagate and Western Digital.
And the market reacted fast.
STX had closed at $945.57 on October 1 before plunging to $848.99 on October 2.
That's not just a normal red candle.
That's the market repricing expectations.
🧠 BUT DON'T MISS THE BIGGER PICTURE
Seagate has been one of the major beneficiaries of the explosion in AI and data-center storage demand.
More AI models → more data
More data centers → more storage
More storage → greater demand for high-capacity drives.
That demand helped STX deliver an enormous long-term rally. The stock remains dramatically above where it traded a year ago.
The question now is whether future supply growth can catch up with AI-driven demand.
That's the real battle.
📊 WHAT THE PRICE IS TELLING TRADERS
STX's October 2 session produced a wide trading range, with the stock reaching roughly $791.75–$852.29 before closing at $848.99.
That makes the $790–$800 area an important zone to watch.
If buyers defend that area and STX begins reclaiming higher levels, the sell-off could eventually look like a major shakeout.
But if price continues making lower highs and breaks below the recent low, the market could be signaling that the correction isn't finished.
🐂 BULLISH SCENARIO
STX holds the sell-off low → buyers return → price reclaims resistance → momentum starts rebuilding.
🐻 BEARISH SCENARIO
Toshiba's expansion raises long-term supply concerns → margins/pricing expectations weaken → STX loses support → deeper correction follows.
⚠️ ONE MORE THING
Recent insider-sale filings also show CEO William D. Mosley sold shares under a Rule 10b5-1 preset trading plan. That does not automatically mean management is bearish, but traders may still watch insider activity closely during a volatile period.
🎯 THE REAL QUESTION
Is the STX -10.21% move the beginning of a bigger breakdown...
or is the market simply overreacting to a future supply threat while AI storage demand remains strong?
Don't blindly buy the dip. Don't blindly short the crash.
Watch price + volume + support + the evolving AI storage supply story.
That combination could tell traders what the next major $STX move looks like.
💬 What would you do at $848 — BUY the dip, WAIT for confirmation, or SHORT the rebound?
#STX #Seagate #AI #ArtificialIntelligence #Stocks #TechStocks #StockMarket #DataCenters #Trading #Investing
6
·
--
Artikel
Lihat terjemahan
AMD +2.95%: The AI Trade Is Heating Up — But Can Buyers Hold the Line?Advanced Micro Devices (AMD) just gave traders something worth watching.
With AMD trading around $633.91, up +2.95%, and reported market volume/metric around $10.89B, attention is once again moving toward one question:
👉 Is AMD starting another major momentum move — or are traders simply chasing strength?
That distinction matters.
🔎 The First Signal: Momentum
A nearly 3% move in a major semiconductor name is not something traders should ignore.
AMD's move to $633.91 suggests buyers currently have enough strength to push price higher.
But there is another detail hiding underneath the headline.
The secondary/extended price is around $633.25, showing approximately -0.10%.
That creates an interesting situation:
The headline move is bullish, but the follow-through needs confirmation.
And this is where experienced traders slow down instead of rushing in.
🧠 What Could Be Driving Attention?
AMD sits directly inside one of the biggest themes in the technology market:
AI + semiconductors + data-center demand.
When investors become aggressive toward AI-related assets, semiconductor stocks can attract significant capital because they are positioned within the infrastructure powering the broader AI ecosystem.
That makes AMD more than just a daily percentage move.
It becomes a market sentiment signal.
If buyers continue defending higher prices, traders may interpret the move as momentum continuation.
If price quickly loses the breakout area, however, today's +2.95% could become another example of a strong-looking move that failed to follow through.
📊 What Traders Should Watch
Instead of asking:
❌ “AMD is up almost 3%. Should I buy now?”
Ask:
✅ Is volume supporting the move?
✅ Can AMD maintain prices above the recent breakout area?
✅ Are buyers still aggressive after the initial rally?
✅ Does the next session confirm today's strength?
✅ Is the broader semiconductor/AI sector moving in the same direction?
These questions help separate momentum trading from FOMO.
🐂 Bullish Scenario
If AMD holds near the $633 area and buyers continue pushing price higher, the current momentum could attract additional attention.
A sustained move above the current trading zone would make continuation the scenario to monitor.
The key is confirmation, not prediction.
🐻 Bearish Scenario
If AMD fails to hold the current level and selling pressure increases, today's +2.95% move could lose significance.
That would suggest buyers were unable to maintain control after the initial push.
For traders, that is an important reminder:
A green candle is not automatically a buy signal.
🎯 The Bigger Lesson
AMD's move is interesting because the market is showing strength — but strength must prove itself.
The biggest mistake traders make after seeing a large green move is entering simply because they are afraid of missing the next rally.
Professional traders usually think differently:
First identify the move.
Then identify the confirmation.
Then define the risk.
Not the other way around.
🚨 Bottom Line
AMD: $633.91 | +2.95% | Volume/Market Metric: $10.89B
The market has clearly attracted attention to AMD.
Now the real question is not:
“Can AMD go higher?”
It is:
👉 “Can buyers prove they are strong enough to sustain this move?”
That is the signal worth watching.
💬 What do you think — is $AMD beginning another AI-driven rally, or is this a move traders should be cautious about chasing?
{future}(AMDUSDT)
#AMD #AdvancedMicroDevices #AI #Semiconductors #StockMarket #TechStocks #Trading #Investing #MarketAnalysis #AIStocks
AMD +2.95%: The AI Trade Is Heating Up — But Can Buyers Hold the Line?
Advanced Micro Devices (AMD) just gave traders something worth watching.
With AMD trading around $633.91, up +2.95%, and reported market volume/metric around $10.89B, attention is once again moving toward one question:
👉 Is AMD starting another major momentum move — or are traders simply chasing strength?
That distinction matters.
🔎 The First Signal: Momentum
A nearly 3% move in a major semiconductor name is not something traders should ignore.
AMD's move to $633.91 suggests buyers currently have enough strength to push price higher.
But there is another detail hiding underneath the headline.
The secondary/extended price is around $633.25, showing approximately -0.10%.
That creates an interesting situation:
The headline move is bullish, but the follow-through needs confirmation.
And this is where experienced traders slow down instead of rushing in.
🧠 What Could Be Driving Attention?
AMD sits directly inside one of the biggest themes in the technology market:
AI + semiconductors + data-center demand.
When investors become aggressive toward AI-related assets, semiconductor stocks can attract significant capital because they are positioned within the infrastructure powering the broader AI ecosystem.
That makes AMD more than just a daily percentage move.
It becomes a market sentiment signal.
If buyers continue defending higher prices, traders may interpret the move as momentum continuation.
If price quickly loses the breakout area, however, today's +2.95% could become another example of a strong-looking move that failed to follow through.
📊 What Traders Should Watch
Instead of asking:
❌ “AMD is up almost 3%. Should I buy now?”
Ask:
✅ Is volume supporting the move?
✅ Can AMD maintain prices above the recent breakout area?
✅ Are buyers still aggressive after the initial rally?
✅ Does the next session confirm today's strength?
✅ Is the broader semiconductor/AI sector moving in the same direction?
These questions help separate momentum trading from FOMO.
🐂 Bullish Scenario
If AMD holds near the $633 area and buyers continue pushing price higher, the current momentum could attract additional attention.
A sustained move above the current trading zone would make continuation the scenario to monitor.
The key is confirmation, not prediction.
🐻 Bearish Scenario
If AMD fails to hold the current level and selling pressure increases, today's +2.95% move could lose significance.
That would suggest buyers were unable to maintain control after the initial push.
For traders, that is an important reminder:
A green candle is not automatically a buy signal.
🎯 The Bigger Lesson
AMD's move is interesting because the market is showing strength — but strength must prove itself.
The biggest mistake traders make after seeing a large green move is entering simply because they are afraid of missing the next rally.
Professional traders usually think differently:
First identify the move.
Then identify the confirmation.
Then define the risk.
Not the other way around.
🚨 Bottom Line
AMD: $633.91 | +2.95% | Volume/Market Metric: $10.89B
The market has clearly attracted attention to AMD.
Now the real question is not:
“Can AMD go higher?”
It is:
👉 “Can buyers prove they are strong enough to sustain this move?”
That is the signal worth watching.
💬 What do you think — is $AMD beginning another AI-driven rally, or is this a move traders should be cautious about chasing?
#AMD #AdvancedMicroDevices #AI #Semiconductors #StockMarket #TechStocks #Trading #Investing #MarketAnalysis #AIStocks
With AMD trading around $633.91, up +2.95%, and reported market volume/metric around $10.89B, attention is once again moving toward one question:
👉 Is AMD starting another major momentum move — or are traders simply chasing strength?
That distinction matters.
🔎 The First Signal: Momentum
A nearly 3% move in a major semiconductor name is not something traders should ignore.
AMD's move to $633.91 suggests buyers currently have enough strength to push price higher.
But there is another detail hiding underneath the headline.
The secondary/extended price is around $633.25, showing approximately -0.10%.
That creates an interesting situation:
The headline move is bullish, but the follow-through needs confirmation.
And this is where experienced traders slow down instead of rushing in.
🧠 What Could Be Driving Attention?
AMD sits directly inside one of the biggest themes in the technology market:
AI + semiconductors + data-center demand.
When investors become aggressive toward AI-related assets, semiconductor stocks can attract significant capital because they are positioned within the infrastructure powering the broader AI ecosystem.
That makes AMD more than just a daily percentage move.
It becomes a market sentiment signal.
If buyers continue defending higher prices, traders may interpret the move as momentum continuation.
If price quickly loses the breakout area, however, today's +2.95% could become another example of a strong-looking move that failed to follow through.
📊 What Traders Should Watch
Instead of asking:
❌ “AMD is up almost 3%. Should I buy now?”
Ask:
✅ Is volume supporting the move?
✅ Can AMD maintain prices above the recent breakout area?
✅ Are buyers still aggressive after the initial rally?
✅ Does the next session confirm today's strength?
✅ Is the broader semiconductor/AI sector moving in the same direction?
These questions help separate momentum trading from FOMO.
🐂 Bullish Scenario
If AMD holds near the $633 area and buyers continue pushing price higher, the current momentum could attract additional attention.
A sustained move above the current trading zone would make continuation the scenario to monitor.
The key is confirmation, not prediction.
🐻 Bearish Scenario
If AMD fails to hold the current level and selling pressure increases, today's +2.95% move could lose significance.
That would suggest buyers were unable to maintain control after the initial push.
For traders, that is an important reminder:
A green candle is not automatically a buy signal.
🎯 The Bigger Lesson
AMD's move is interesting because the market is showing strength — but strength must prove itself.
The biggest mistake traders make after seeing a large green move is entering simply because they are afraid of missing the next rally.
Professional traders usually think differently:
First identify the move.
Then identify the confirmation.
Then define the risk.
Not the other way around.
🚨 Bottom Line
AMD: $633.91 | +2.95% | Volume/Market Metric: $10.89B
The market has clearly attracted attention to AMD.
Now the real question is not:
“Can AMD go higher?”
It is:
👉 “Can buyers prove they are strong enough to sustain this move?”
That is the signal worth watching.
💬 What do you think — is $AMD beginning another AI-driven rally, or is this a move traders should be cautious about chasing?
#AMD #AdvancedMicroDevices #AI #Semiconductors #StockMarket #TechStocks #Trading #Investing #MarketAnalysis #AIStocks
39
·
--
Artikel
Lihat terjemahan
SNDK -3.78%: Is This a Buying Opportunity — or the Start of a Deeper Pullback?SanDisk (SNDK) just gave traders a reason to pay attention.
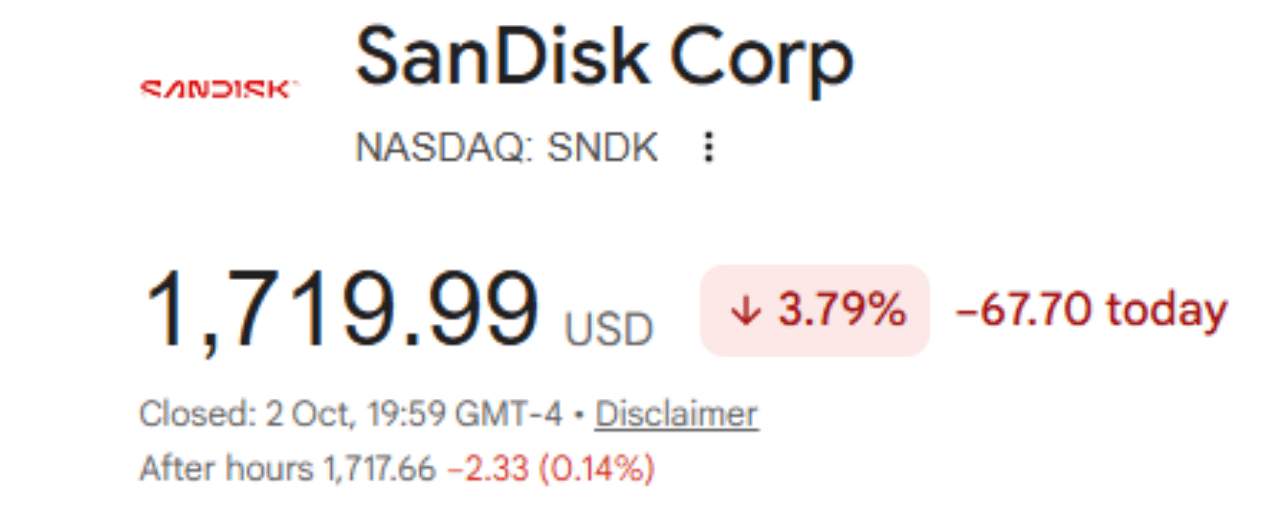
The stock is trading around $1,719.99, down 3.78%, while the secondary price sits near $1,717.15, showing a smaller -0.16% move.
At first glance, a nearly 4% decline may look like weakness.
But experienced traders know something important:
A sharp drop is not automatically a short signal.
Sometimes, the biggest opportunities appear when price pulls back after a strong move—but only if buyers return with enough volume and momentum.
🔎 WHAT IS HAPPENING WITH SNDK?
SanDisk Corporation Common Stock is currently showing a major market metric of approximately $13.47B.
The key question isn't simply:
“Why is SNDK down?”
The better question is:
“What happens next after the -3.78% move?”
That is where traders should focus.
📊 THE SIGNAL BEHIND THE MOVE
A decline of this size can represent several possibilities:
1️⃣ Healthy Pullback
If buyers step in around important support levels, today's weakness could become a temporary reset before another attempt higher.
2️⃣ Momentum Breakdown
If selling pressure continues and support fails, the current decline could develop into a deeper correction.
3️⃣ Volatility Trap
The most dangerous situation is chasing the move too early.
A falling asset can bounce aggressively, while a seemingly cheap price can become even cheaper.
🧠 HOW SMART TRADERS WOULD READ IT
Instead of immediately buying because SNDK is down, watch for confirmation.
Look at:
📌 Price action — Is SNDK forming higher lows or lower lows?
📌 Volume — Are buyers appearing during the recovery?
📌 Support — Does price hold a previous demand zone?
📌 Momentum — Is selling pressure weakening?
📌 Market sentiment — Is the broader technology/stock market supporting or pressuring the move?
If buyers reclaim lost levels with strong volume, the -3.78% decline could eventually look like a discount rather than a warning.
But if support breaks with expanding selling volume, traders should be prepared for additional downside.
🚨 THE BIGGEST MISTAKE
Don't confuse “down” with “undervalued.”
A 3.78% decline only tells us what happened.
It does not tell us where price is going next.
That's why confirmation matters more than prediction.
🎯 BULLISH SCENARIO
SNDK stabilizes → buyers return → resistance is reclaimed → momentum improves.
That could create a potential recovery setup.
⚠️ BEARISH SCENARIO
SNDK fails to stabilize → support breaks → selling volume increases → the correction extends.
That would suggest patience is more important than FOMO.
🔥 THE TAKEAWAY
SNDK is down 3.78%, but the real story may only be beginning.
The next move could determine whether today's decline becomes:
💰 A pullback buyers wanted
or
⚠️ The beginning of a deeper correction.
Don't chase the red candle.
Watch the reaction after the drop.
That reaction can tell traders far more than the percentage change itself.
👇 What do you think happens next with $SNDK ?
{future}(SNDKUSDT)
BUY 🟢 or MORE DOWNSIDE 🔴?
#SNDK #SanDisk #Stocks #StockMarket #Trading #Investing #MarketAnalysis #TechStocks #BinanceSquare #CryptoAndStocks
SNDK -3.78%: Is This a Buying Opportunity — or the Start of a Deeper Pullback?
SanDisk (SNDK) just gave traders a reason to pay attention.
The stock is trading around $1,719.99, down 3.78%, while the secondary price sits near $1,717.15, showing a smaller -0.16% move.
At first glance, a nearly 4% decline may look like weakness.
But experienced traders know something important:
A sharp drop is not automatically a short signal.
Sometimes, the biggest opportunities appear when price pulls back after a strong move—but only if buyers return with enough volume and momentum.
🔎 WHAT IS HAPPENING WITH SNDK?
SanDisk Corporation Common Stock is currently showing a major market metric of approximately $13.47B.
The key question isn't simply:
“Why is SNDK down?”
The better question is:
“What happens next after the -3.78% move?”
That is where traders should focus.
📊 THE SIGNAL BEHIND THE MOVE
A decline of this size can represent several possibilities:
1️⃣ Healthy Pullback
If buyers step in around important support levels, today's weakness could become a temporary reset before another attempt higher.
2️⃣ Momentum Breakdown
If selling pressure continues and support fails, the current decline could develop into a deeper correction.
3️⃣ Volatility Trap
The most dangerous situation is chasing the move too early.
A falling asset can bounce aggressively, while a seemingly cheap price can become even cheaper.
🧠 HOW SMART TRADERS WOULD READ IT
Instead of immediately buying because SNDK is down, watch for confirmation.
Look at:
📌 Price action — Is SNDK forming higher lows or lower lows?
📌 Volume — Are buyers appearing during the recovery?
📌 Support — Does price hold a previous demand zone?
📌 Momentum — Is selling pressure weakening?
📌 Market sentiment — Is the broader technology/stock market supporting or pressuring the move?
If buyers reclaim lost levels with strong volume, the -3.78% decline could eventually look like a discount rather than a warning.
But if support breaks with expanding selling volume, traders should be prepared for additional downside.
🚨 THE BIGGEST MISTAKE
Don't confuse “down” with “undervalued.”
A 3.78% decline only tells us what happened.
It does not tell us where price is going next.
That's why confirmation matters more than prediction.
🎯 BULLISH SCENARIO
SNDK stabilizes → buyers return → resistance is reclaimed → momentum improves.
That could create a potential recovery setup.
⚠️ BEARISH SCENARIO
SNDK fails to stabilize → support breaks → selling volume increases → the correction extends.
That would suggest patience is more important than FOMO.
🔥 THE TAKEAWAY
SNDK is down 3.78%, but the real story may only be beginning.
The next move could determine whether today's decline becomes:
💰 A pullback buyers wanted
or
⚠️ The beginning of a deeper correction.
Don't chase the red candle.
Watch the reaction after the drop.
That reaction can tell traders far more than the percentage change itself.
👇 What do you think happens next with $SNDK ?
BUY 🟢 or MORE DOWNSIDE 🔴?
#SNDK #SanDisk #Stocks #StockMarket #Trading #Investing #MarketAnalysis #TechStocks #BinanceSquare #CryptoAndStocks
The stock is trading around $1,719.99, down 3.78%, while the secondary price sits near $1,717.15, showing a smaller -0.16% move.
At first glance, a nearly 4% decline may look like weakness.
But experienced traders know something important:
A sharp drop is not automatically a short signal.
Sometimes, the biggest opportunities appear when price pulls back after a strong move—but only if buyers return with enough volume and momentum.
🔎 WHAT IS HAPPENING WITH SNDK?
SanDisk Corporation Common Stock is currently showing a major market metric of approximately $13.47B.
The key question isn't simply:
“Why is SNDK down?”
The better question is:
“What happens next after the -3.78% move?”
That is where traders should focus.
📊 THE SIGNAL BEHIND THE MOVE
A decline of this size can represent several possibilities:
1️⃣ Healthy Pullback
If buyers step in around important support levels, today's weakness could become a temporary reset before another attempt higher.
2️⃣ Momentum Breakdown
If selling pressure continues and support fails, the current decline could develop into a deeper correction.
3️⃣ Volatility Trap
The most dangerous situation is chasing the move too early.
A falling asset can bounce aggressively, while a seemingly cheap price can become even cheaper.
🧠 HOW SMART TRADERS WOULD READ IT
Instead of immediately buying because SNDK is down, watch for confirmation.
Look at:
📌 Price action — Is SNDK forming higher lows or lower lows?
📌 Volume — Are buyers appearing during the recovery?
📌 Support — Does price hold a previous demand zone?
📌 Momentum — Is selling pressure weakening?
📌 Market sentiment — Is the broader technology/stock market supporting or pressuring the move?
If buyers reclaim lost levels with strong volume, the -3.78% decline could eventually look like a discount rather than a warning.
But if support breaks with expanding selling volume, traders should be prepared for additional downside.
🚨 THE BIGGEST MISTAKE
Don't confuse “down” with “undervalued.”
A 3.78% decline only tells us what happened.
It does not tell us where price is going next.
That's why confirmation matters more than prediction.
🎯 BULLISH SCENARIO
SNDK stabilizes → buyers return → resistance is reclaimed → momentum improves.
That could create a potential recovery setup.
⚠️ BEARISH SCENARIO
SNDK fails to stabilize → support breaks → selling volume increases → the correction extends.
That would suggest patience is more important than FOMO.
🔥 THE TAKEAWAY
SNDK is down 3.78%, but the real story may only be beginning.
The next move could determine whether today's decline becomes:
💰 A pullback buyers wanted
or
⚠️ The beginning of a deeper correction.
Don't chase the red candle.
Watch the reaction after the drop.
That reaction can tell traders far more than the percentage change itself.
👇 What do you think happens next with $SNDK ?
BUY 🟢 or MORE DOWNSIDE 🔴?
#SNDK #SanDisk #Stocks #StockMarket #Trading #Investing #MarketAnalysis #TechStocks #BinanceSquare #CryptoAndStocks
42
·
--
Artikel
Lihat terjemahan
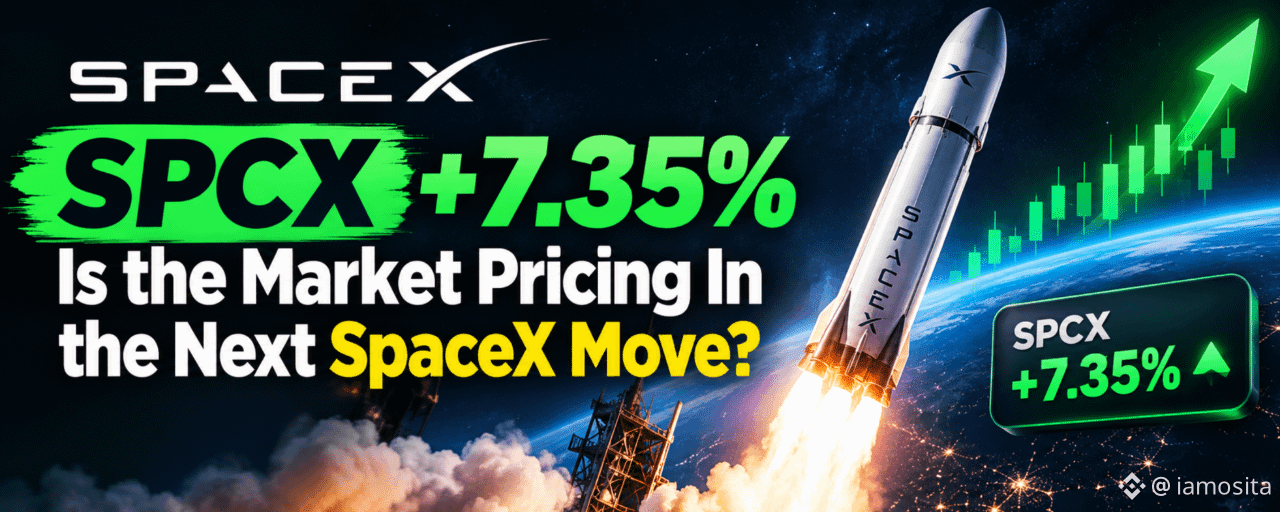
SPCX +7.35%: Is the Market Pricing In the Next SpaceX Move?What happens when traders want exposure to one of the world’s most closely watched private companies—but traditional access is limited?
That’s where SPCX enters the conversation.
According to the market data provided, SPCX represents Space Exploration Technology / SpaceX tokenized or pre-IPO exposure.
And today, the numbers are getting attention. 👀
📊 SPCX MARKET SNAPSHOT
💰 Primary Price: $158.96
📈 24H Change: +7.35%
💵 Secondary Price: $159.116
📊 Secondary Change: +0.09%
🔥 Reported Market Volume/Metric: $17.80B
The headline number is obvious:
+7.35%.
But experienced traders know that a percentage gain alone isn't a trading signal.
The real question is:
👉 What is driving the move, and can the momentum continue?
🔎 THE DISCOVERY
SPCX is interesting because the narrative isn't simply about another crypto token.
It is connected to the broader market fascination with SpaceX exposure, private-company valuations, and tokenized/pre-IPO assets.
That combination can create strong attention—but attention can also create volatility.
When traders see a large move, the temptation is usually to chase.
That's exactly where risk management becomes important.
📈 WHAT BULLS WANT TO SEE
If SPCX can hold around the $158–$159 area while buying activity remains strong, traders may interpret that as evidence that buyers are still defending the current price zone.
A sustained move above the recent trading area could attract even more attention.
But remember:
Momentum is not the same thing as confirmation.
⚠️ WHAT COULD GO WRONG?
A sharp rally can reverse just as quickly.
If buyers fail to sustain the move and price falls back below the recent area, late buyers could find themselves trapped.
And because tokenized or pre-IPO exposure can involve different structures, liquidity conditions, pricing mechanisms, and risks than conventional public-market assets, traders should understand exactly what they are buying.
🧠 THE BIG TAKEAWAY
SPCX is showing why narrative + momentum + liquidity can become a powerful combination.
But smart traders don't ask:
❌ “It is up 7.35%—should I buy?”
They ask:
✅ “Why is it moving?”
✅ “Is the move supported by participation?”
✅ “Where would my setup be invalidated?”
✅ “Am I chasing momentum or trading a confirmed setup?”
The move gets attention.
The structure tells the story.
Risk management determines survival.
👇 YOUR TURN:
Would you trade $SPCX after a +7.35% move, or wait for a pullback and confirmation?
{future}(SPCXUSDT)
#SPCX #SpaceX #TokenizedAssets #Crypto #Web3 #BinanceSquare #Trading #MarketAnalysis #PreIPO #CryptoTrading
SPCX +7.35%: Is the Market Pricing In the Next SpaceX Move?
What happens when traders want exposure to one of the world’s most closely watched private companies—but traditional access is limited?
That’s where SPCX enters the conversation.
According to the market data provided, SPCX represents Space Exploration Technology / SpaceX tokenized or pre-IPO exposure.
And today, the numbers are getting attention. 👀
📊 SPCX MARKET SNAPSHOT
💰 Primary Price: $158.96
📈 24H Change: +7.35%
💵 Secondary Price: $159.116
📊 Secondary Change: +0.09%
🔥 Reported Market Volume/Metric: $17.80B
The headline number is obvious:
+7.35%.
But experienced traders know that a percentage gain alone isn't a trading signal.
The real question is:
👉 What is driving the move, and can the momentum continue?
🔎 THE DISCOVERY
SPCX is interesting because the narrative isn't simply about another crypto token.
It is connected to the broader market fascination with SpaceX exposure, private-company valuations, and tokenized/pre-IPO assets.
That combination can create strong attention—but attention can also create volatility.
When traders see a large move, the temptation is usually to chase.
That's exactly where risk management becomes important.
📈 WHAT BULLS WANT TO SEE
If SPCX can hold around the $158–$159 area while buying activity remains strong, traders may interpret that as evidence that buyers are still defending the current price zone.
A sustained move above the recent trading area could attract even more attention.
But remember:
Momentum is not the same thing as confirmation.
⚠️ WHAT COULD GO WRONG?
A sharp rally can reverse just as quickly.
If buyers fail to sustain the move and price falls back below the recent area, late buyers could find themselves trapped.
And because tokenized or pre-IPO exposure can involve different structures, liquidity conditions, pricing mechanisms, and risks than conventional public-market assets, traders should understand exactly what they are buying.
🧠 THE BIG TAKEAWAY
SPCX is showing why narrative + momentum + liquidity can become a powerful combination.
But smart traders don't ask:
❌ “It is up 7.35%—should I buy?”
They ask:
✅ “Why is it moving?”
✅ “Is the move supported by participation?”
✅ “Where would my setup be invalidated?”
✅ “Am I chasing momentum or trading a confirmed setup?”
The move gets attention.
The structure tells the story.
Risk management determines survival.
👇 YOUR TURN:
Would you trade $SPCX after a +7.35% move, or wait for a pullback and confirmation?
#SPCX #SpaceX #TokenizedAssets #Crypto #Web3 #BinanceSquare #Trading #MarketAnalysis #PreIPO #CryptoTrading
That’s where SPCX enters the conversation.
According to the market data provided, SPCX represents Space Exploration Technology / SpaceX tokenized or pre-IPO exposure.
And today, the numbers are getting attention. 👀
📊 SPCX MARKET SNAPSHOT
💰 Primary Price: $158.96
📈 24H Change: +7.35%
💵 Secondary Price: $159.116
📊 Secondary Change: +0.09%
🔥 Reported Market Volume/Metric: $17.80B
The headline number is obvious:
+7.35%.
But experienced traders know that a percentage gain alone isn't a trading signal.
The real question is:
👉 What is driving the move, and can the momentum continue?
🔎 THE DISCOVERY
SPCX is interesting because the narrative isn't simply about another crypto token.
It is connected to the broader market fascination with SpaceX exposure, private-company valuations, and tokenized/pre-IPO assets.
That combination can create strong attention—but attention can also create volatility.
When traders see a large move, the temptation is usually to chase.
That's exactly where risk management becomes important.
📈 WHAT BULLS WANT TO SEE
If SPCX can hold around the $158–$159 area while buying activity remains strong, traders may interpret that as evidence that buyers are still defending the current price zone.
A sustained move above the recent trading area could attract even more attention.
But remember:
Momentum is not the same thing as confirmation.
⚠️ WHAT COULD GO WRONG?
A sharp rally can reverse just as quickly.
If buyers fail to sustain the move and price falls back below the recent area, late buyers could find themselves trapped.
And because tokenized or pre-IPO exposure can involve different structures, liquidity conditions, pricing mechanisms, and risks than conventional public-market assets, traders should understand exactly what they are buying.
🧠 THE BIG TAKEAWAY
SPCX is showing why narrative + momentum + liquidity can become a powerful combination.
But smart traders don't ask:
❌ “It is up 7.35%—should I buy?”
They ask:
✅ “Why is it moving?”
✅ “Is the move supported by participation?”
✅ “Where would my setup be invalidated?”
✅ “Am I chasing momentum or trading a confirmed setup?”
The move gets attention.
The structure tells the story.
Risk management determines survival.
👇 YOUR TURN:
Would you trade $SPCX after a +7.35% move, or wait for a pullback and confirmation?
#SPCX #SpaceX #TokenizedAssets #Crypto #Web3 #BinanceSquare #Trading #MarketAnalysis #PreIPO #CryptoTrading
45
·
--
Artikel
Lihat terjemahan
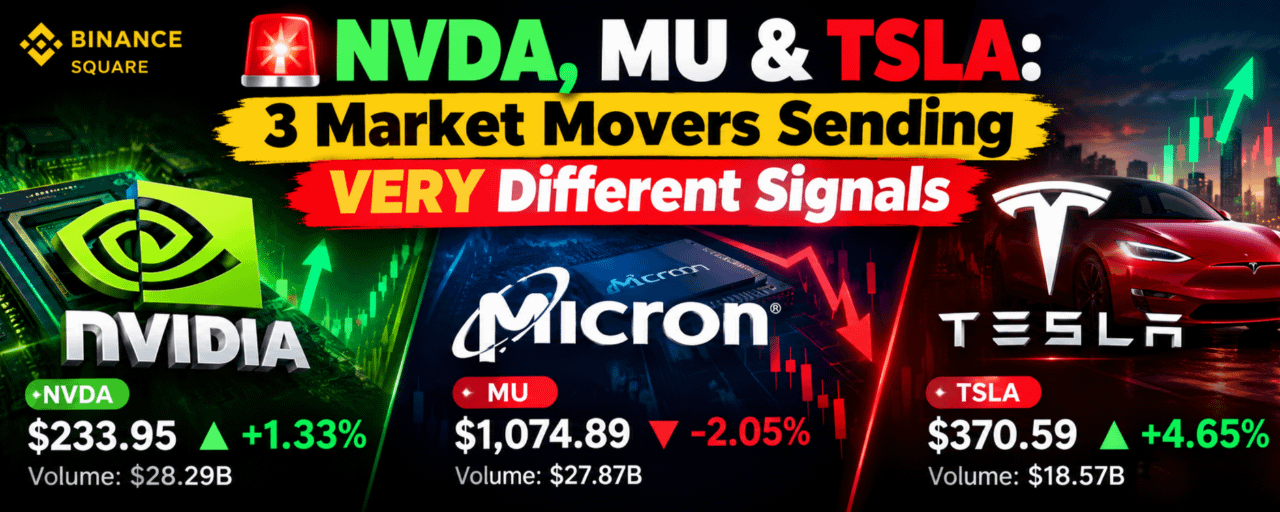
NVDA, MU & TSLA: 3 Market Movers Sending VERY Different SignalsThe market is moving—but here’s the interesting part:
NVIDIA is climbing. Tesla is surging. Micron is falling.
Three major names. Three completely different signals.
And for crypto traders, this matters more than it may seem.
🔎 THE MARKET SNAPSHOT
🟢 NVDA — NVIDIA
Price: $233.95
Change: +1.33%
Extended: $234.227 (+0.11%)
Market volume/metric: $28.29B
NVDA remains one of the biggest names in the AI and semiconductor story. Its positive move suggests that demand for AI-related exposure remains strong.
But the real question is:
Can buyers keep pushing higher, or is the market already pricing in too much optimism?
🔴 MU — Micron Technology
Price: $1,074.89
Change: -2.05%
Extended: $1,069.163 (-0.53%)
Market volume/metric: $27.87B
Here is where things get interesting.
Micron is moving in the opposite direction from NVIDIA.
That divergence could mean investors are becoming more selective inside the semiconductor/AI trade rather than simply buying everything connected to the sector.
🟢 TSLA — Tesla
Price: $370.59
Change: +4.65%
Extended: $371.445 (+0.23%)
Market volume/metric: $18.57B
Tesla is the standout mover.
A +4.65% move puts TSLA ahead of both NVDA and MU in today's snapshot.
That tells us something important about market attention:
Capital can rotate quickly when traders see momentum.
📊 WHAT SHOULD TRADERS WATCH?
The biggest lesson isn't simply “buy NVDA” or “buy TSLA.”
It's rotation.
When one sector or group of assets starts moving, traders often chase the strongest performer. But professional traders look deeper:
➡️ Is volume supporting the move?
➡️ Is the price breaking resistance?
➡️ Is momentum accelerating or fading?
➡️ Are related assets confirming the trend?
➡️ Is the move driven by fundamentals, sentiment, or speculation?
This same thinking applies directly to crypto.
Imagine BTC starts moving strongly while ETH and major altcoins lag.
Then suddenly SOL or another sector starts outperforming.
The opportunity may not be where everyone is already looking.
🧠 THE BIG TAKEAWAY
NVDA = positive momentum
MU = weakness/divergence
TSLA = strongest momentum in this snapshot
The market is not moving as one group.
It's rotating.
And that's why blindly chasing the greenest candle can be dangerous.
A strong move can continue—but it can also reverse when late buyers enter.
🎯 TRADER'S EDGE
Don't just ask:
“Which asset is pumping?”
Ask:
“Why is it pumping, and is the move being confirmed?”
That question can help separate a real trend from a temporary spike.
And if you're trading crypto, watch this same rotation behavior across BTC → ETH → large caps → AI → DeFi → memecoins.
The money doesn't always leave the market.
Sometimes, it simply moves to the next opportunity.
⚠️ Not financial advice. These figures are a market snapshot, not a guarantee of future performance. Always do your own research and manage risk.
👇 Which one would you watch most closely right now: $NVDA
{future}(NVDAUSDT)
$MU
{future}(MUUSDT)
or $TSLA — and WHY?
#NVDA #MU #TSLA #NVIDIA #Micron #Tesla #Stocks #AI #Semiconductors #Trading #Crypto #BinanceSquare #MarketAnalysis
NVDA, MU & TSLA: 3 Market Movers Sending VERY Different Signals
The market is moving—but here’s the interesting part:
NVIDIA is climbing. Tesla is surging. Micron is falling.
Three major names. Three completely different signals.
And for crypto traders, this matters more than it may seem.
🔎 THE MARKET SNAPSHOT
🟢 NVDA — NVIDIA
Price: $233.95
Change: +1.33%
Extended: $234.227 (+0.11%)
Market volume/metric: $28.29B
NVDA remains one of the biggest names in the AI and semiconductor story. Its positive move suggests that demand for AI-related exposure remains strong.
But the real question is:
Can buyers keep pushing higher, or is the market already pricing in too much optimism?
🔴 MU — Micron Technology
Price: $1,074.89
Change: -2.05%
Extended: $1,069.163 (-0.53%)
Market volume/metric: $27.87B
Here is where things get interesting.
Micron is moving in the opposite direction from NVIDIA.
That divergence could mean investors are becoming more selective inside the semiconductor/AI trade rather than simply buying everything connected to the sector.
🟢 TSLA — Tesla
Price: $370.59
Change: +4.65%
Extended: $371.445 (+0.23%)
Market volume/metric: $18.57B
Tesla is the standout mover.
A +4.65% move puts TSLA ahead of both NVDA and MU in today's snapshot.
That tells us something important about market attention:
Capital can rotate quickly when traders see momentum.
📊 WHAT SHOULD TRADERS WATCH?
The biggest lesson isn't simply “buy NVDA” or “buy TSLA.”
It's rotation.
When one sector or group of assets starts moving, traders often chase the strongest performer. But professional traders look deeper:
➡️ Is volume supporting the move?
➡️ Is the price breaking resistance?
➡️ Is momentum accelerating or fading?
➡️ Are related assets confirming the trend?
➡️ Is the move driven by fundamentals, sentiment, or speculation?
This same thinking applies directly to crypto.
Imagine BTC starts moving strongly while ETH and major altcoins lag.
Then suddenly SOL or another sector starts outperforming.
The opportunity may not be where everyone is already looking.
🧠 THE BIG TAKEAWAY
NVDA = positive momentum
MU = weakness/divergence
TSLA = strongest momentum in this snapshot
The market is not moving as one group.
It's rotating.
And that's why blindly chasing the greenest candle can be dangerous.
A strong move can continue—but it can also reverse when late buyers enter.
🎯 TRADER'S EDGE
Don't just ask:
“Which asset is pumping?”
Ask:
“Why is it pumping, and is the move being confirmed?”
That question can help separate a real trend from a temporary spike.
And if you're trading crypto, watch this same rotation behavior across BTC → ETH → large caps → AI → DeFi → memecoins.
The money doesn't always leave the market.
Sometimes, it simply moves to the next opportunity.
⚠️ Not financial advice. These figures are a market snapshot, not a guarantee of future performance. Always do your own research and manage risk.
👇 Which one would you watch most closely right now: $NVDA
$MU
or $TSLA — and WHY?
#NVDA #MU #TSLA #NVIDIA #Micron #Tesla #Stocks #AI #Semiconductors #Trading #Crypto #BinanceSquare #MarketAnalysis
NVIDIA is climbing. Tesla is surging. Micron is falling.
Three major names. Three completely different signals.
And for crypto traders, this matters more than it may seem.
🔎 THE MARKET SNAPSHOT
🟢 NVDA — NVIDIA
Price: $233.95
Change: +1.33%
Extended: $234.227 (+0.11%)
Market volume/metric: $28.29B
NVDA remains one of the biggest names in the AI and semiconductor story. Its positive move suggests that demand for AI-related exposure remains strong.
But the real question is:
Can buyers keep pushing higher, or is the market already pricing in too much optimism?
🔴 MU — Micron Technology
Price: $1,074.89
Change: -2.05%
Extended: $1,069.163 (-0.53%)
Market volume/metric: $27.87B
Here is where things get interesting.
Micron is moving in the opposite direction from NVIDIA.
That divergence could mean investors are becoming more selective inside the semiconductor/AI trade rather than simply buying everything connected to the sector.
🟢 TSLA — Tesla
Price: $370.59
Change: +4.65%
Extended: $371.445 (+0.23%)
Market volume/metric: $18.57B
Tesla is the standout mover.
A +4.65% move puts TSLA ahead of both NVDA and MU in today's snapshot.
That tells us something important about market attention:
Capital can rotate quickly when traders see momentum.
📊 WHAT SHOULD TRADERS WATCH?
The biggest lesson isn't simply “buy NVDA” or “buy TSLA.”
It's rotation.
When one sector or group of assets starts moving, traders often chase the strongest performer. But professional traders look deeper:
➡️ Is volume supporting the move?
➡️ Is the price breaking resistance?
➡️ Is momentum accelerating or fading?
➡️ Are related assets confirming the trend?
➡️ Is the move driven by fundamentals, sentiment, or speculation?
This same thinking applies directly to crypto.
Imagine BTC starts moving strongly while ETH and major altcoins lag.
Then suddenly SOL or another sector starts outperforming.
The opportunity may not be where everyone is already looking.
🧠 THE BIG TAKEAWAY
NVDA = positive momentum
MU = weakness/divergence
TSLA = strongest momentum in this snapshot
The market is not moving as one group.
It's rotating.
And that's why blindly chasing the greenest candle can be dangerous.
A strong move can continue—but it can also reverse when late buyers enter.
🎯 TRADER'S EDGE
Don't just ask:
“Which asset is pumping?”
Ask:
“Why is it pumping, and is the move being confirmed?”
That question can help separate a real trend from a temporary spike.
And if you're trading crypto, watch this same rotation behavior across BTC → ETH → large caps → AI → DeFi → memecoins.
The money doesn't always leave the market.
Sometimes, it simply moves to the next opportunity.
⚠️ Not financial advice. These figures are a market snapshot, not a guarantee of future performance. Always do your own research and manage risk.
👇 Which one would you watch most closely right now: $NVDA
$MU
or $TSLA — and WHY?
#NVDA #MU #TSLA #NVIDIA #Micron #Tesla #Stocks #AI #Semiconductors #Trading #Crypto #BinanceSquare #MarketAnalysis
65
·
--
🚨 PYTH, RUNE & DYDX: 3 Token Kripto yang Mungkin Layak Dipantau
Kebanyakan trader mengawali dengan BTC dan ETH.
Tapi terkadang, sinyal yang lebih menarik justru bersembunyi lebih dalam di pasar.
Hari ini, tiga nama menonjol karena alasan yang berbeda: PYTH, RUNE, dan DYDX.
🔎 1. $PYTH — Narasi Oracle
{spot}(PYTHUSDT)
PYTH terhubung dengan infrastruktur data pasar blockchain, menyediakan informasi harga untuk aplikasi terdesentralisasi.
Kenapa itu penting?
Seiring DeFi berkembang di berbagai chain, data pasar yang andal menjadi semakin krusial. Lebih banyak adopsi aplikasi keuangan on-chain dapat meningkatkan perhatian pada infrastruktur oracle.
🔥 2. $RUNE — Cerita Lintas-Chain
{spot}(RUNEUSDT)
THORChain’s RUNE terkait dengan protokol yang dirancang untuk pertukaran aset lintas-chain.
Narasi kuncinya di sini adalah interoperabilitas.
Jika trader terus memindahkan aset di antara ekosistem blockchain yang berbeda, likuiditas lintas-chain dan infrastruktur tetap menjadi area penting untuk diperhatikan.
⚡ 3. $DYDX — Narasi Perdagangan Terdesentralisasi
{spot}(DYDXUSDT)
DYdX berfokus pada perdagangan derivatif terdesentralisasi.
Itu menempatkan DYDX langsung di salah satu narasi terbesar kripto: perdagangan on-chain.
Jika bursa terdesentralisasi terus bersaing memperebutkan aktivitas trading, likuiditas dan pengguna, serta token yang terhubung dengan sektor ini, dapat menarik perhatian baru.
📊 GAMBAR BESARNYA
PYTH → Oracle & Data
RUNE → Likuiditas Lintas-Chain
DYDX → Perdagangan Terdesentralisasi
Tiga proyek berbeda. Tiga narasi berbeda.
Tapi ingat: narasi yang kuat tidak otomatis berarti harga akan naik.
Sebelum masuk ke perdagangan apa pun, periksa volume, likuiditas, arah BTC, struktur pasar, serta risk/reward.
💬 Kamu paling memantau yang mana: PYTH, RUNE, atau DYDX — dan kenapa?
#PYTH #RUNE #DYDX #Crypto #DeFi #Altcoins #Web3 #BinanceSquare
🚨 PYTH, RUNE & DYDX: 3 Token Kripto yang Mungkin Layak Dipantau
Kebanyakan trader mengawali dengan BTC dan ETH.
Tapi terkadang, sinyal yang lebih menarik justru bersembunyi lebih dalam di pasar.
Hari ini, tiga nama menonjol karena alasan yang berbeda: PYTH, RUNE, dan DYDX.
🔎 1. $PYTH — Narasi Oracle
PYTH terhubung dengan infrastruktur data pasar blockchain, menyediakan informasi harga untuk aplikasi terdesentralisasi.
Kenapa itu penting?
Seiring DeFi berkembang di berbagai chain, data pasar yang andal menjadi semakin krusial. Lebih banyak adopsi aplikasi keuangan on-chain dapat meningkatkan perhatian pada infrastruktur oracle.
🔥 2. $RUNE — Cerita Lintas-Chain
THORChain’s RUNE terkait dengan protokol yang dirancang untuk pertukaran aset lintas-chain.
Narasi kuncinya di sini adalah interoperabilitas.
Jika trader terus memindahkan aset di antara ekosistem blockchain yang berbeda, likuiditas lintas-chain dan infrastruktur tetap menjadi area penting untuk diperhatikan.
⚡ 3. $DYDX — Narasi Perdagangan Terdesentralisasi
DYdX berfokus pada perdagangan derivatif terdesentralisasi.
Itu menempatkan DYDX langsung di salah satu narasi terbesar kripto: perdagangan on-chain.
Jika bursa terdesentralisasi terus bersaing memperebutkan aktivitas trading, likuiditas dan pengguna, serta token yang terhubung dengan sektor ini, dapat menarik perhatian baru.
📊 GAMBAR BESARNYA
PYTH → Oracle & Data
RUNE → Likuiditas Lintas-Chain
DYDX → Perdagangan Terdesentralisasi
Tiga proyek berbeda. Tiga narasi berbeda.
Tapi ingat: narasi yang kuat tidak otomatis berarti harga akan naik.
Sebelum masuk ke perdagangan apa pun, periksa volume, likuiditas, arah BTC, struktur pasar, serta risk/reward.
💬 Kamu paling memantau yang mana: PYTH, RUNE, atau DYDX — dan kenapa?
#PYTH #RUNE #DYDX #Crypto #DeFi #Altcoins #Web3 #BinanceSquare
Kebanyakan trader mengawali dengan BTC dan ETH.
Tapi terkadang, sinyal yang lebih menarik justru bersembunyi lebih dalam di pasar.
Hari ini, tiga nama menonjol karena alasan yang berbeda: PYTH, RUNE, dan DYDX.
🔎 1. $PYTH — Narasi Oracle
PYTH terhubung dengan infrastruktur data pasar blockchain, menyediakan informasi harga untuk aplikasi terdesentralisasi.
Kenapa itu penting?
Seiring DeFi berkembang di berbagai chain, data pasar yang andal menjadi semakin krusial. Lebih banyak adopsi aplikasi keuangan on-chain dapat meningkatkan perhatian pada infrastruktur oracle.
🔥 2. $RUNE — Cerita Lintas-Chain
THORChain’s RUNE terkait dengan protokol yang dirancang untuk pertukaran aset lintas-chain.
Narasi kuncinya di sini adalah interoperabilitas.
Jika trader terus memindahkan aset di antara ekosistem blockchain yang berbeda, likuiditas lintas-chain dan infrastruktur tetap menjadi area penting untuk diperhatikan.
⚡ 3. $DYDX — Narasi Perdagangan Terdesentralisasi
DYdX berfokus pada perdagangan derivatif terdesentralisasi.
Itu menempatkan DYDX langsung di salah satu narasi terbesar kripto: perdagangan on-chain.
Jika bursa terdesentralisasi terus bersaing memperebutkan aktivitas trading, likuiditas dan pengguna, serta token yang terhubung dengan sektor ini, dapat menarik perhatian baru.
📊 GAMBAR BESARNYA
PYTH → Oracle & Data
RUNE → Likuiditas Lintas-Chain
DYDX → Perdagangan Terdesentralisasi
Tiga proyek berbeda. Tiga narasi berbeda.
Tapi ingat: narasi yang kuat tidak otomatis berarti harga akan naik.
Sebelum masuk ke perdagangan apa pun, periksa volume, likuiditas, arah BTC, struktur pasar, serta risk/reward.
💬 Kamu paling memantau yang mana: PYTH, RUNE, atau DYDX — dan kenapa?
#PYTH #RUNE #DYDX #Crypto #DeFi #Altcoins #Web3 #BinanceSquare
290
·
--
🚨 COMP, JUP & JTO: 3 Token yang Mungkin Sedang Menyiapkan Perhatian
Pasar bisa terlihat tenang… sampai beberapa altcoin tiba-tiba mulai menarik volume, trader, dan likuiditas.
Hari ini, COMP, JUP, dan JTO adalah tiga nama yang layak masuk watchlist. Tapi pertanyaannya yang sebenarnya bukan:
👉 “Yang mana yang akan memompa?”
Pertanyaan yang lebih baik adalah:
“Yang sedang dikatakan pasar kepada kita sebelum pergerakan terjadi?”
🔎 1️⃣ $COMP — Likuiditas DeFi
{spot}(COMPUSDT)
Compound adalah salah satu nama mapan di DeFi lending. Ketika aktivitas DeFi meningkat, token yang terhubung dengan lending dan likuiditas dapat kembali menarik perhatian.
Untuk COMP, perhatikan volume dan struktur harga. Breakout tanpa volume yang berarti bisa lebih lemah daripada yang terlihat.
🪐 2️⃣ $JUP — Infrastruktur Trading Solana
{spot}(JUPUSDT)
Jupiter sangat terkait dengan ekosistem trading Solana. Karena berperan sebagai lapisan infrastruktur routing likuiditas dan trading utama, peningkatan aktivitas di Solana dapat membuat JUP masuk radar para trader.
Perhatikan perluasan volume dan tembusnya resistance, bukan mengejar candle yang muncul tiba-tiba.
⚡ 3️⃣ $JTO — Staking Solana & MEV
{spot}(JTOUSDT)
Jito adalah bagian penting lain dari ekosistem Solana, terutama di sekitar infrastruktur staking dan MEV.
Jika aktivitas Solana meningkat, trader mungkin mulai mengamati JTO untuk peluang momentum.
📊 KEUNGGULAN NYATA
Jangan beli hanya karena sebuah token sedang tren.
Cari:
✅ Volume yang meningkat
✅ Breakout + konfirmasi
✅ Support kuat yang bertahan
✅ Arah pasar BTC
✅ Likuiditas yang makin bertambah
✅ Risk/reward minimal 1:2
Sebuah candle hijau bukan konfirmasi dengan sendirinya.
🔥 Yang mana paling kamu pantau: COMP, JUP, atau JTO?
Tulis pilihanmu di bawah dan jelaskan alasannya.
#COMP #JUP #JTO #DeFi #Solana #Crypto #Altcoins #BinanceSquare
🚨 COMP, JUP & JTO: 3 Token yang Mungkin Sedang Menyiapkan Perhatian
Pasar bisa terlihat tenang… sampai beberapa altcoin tiba-tiba mulai menarik volume, trader, dan likuiditas.
Hari ini, COMP, JUP, dan JTO adalah tiga nama yang layak masuk watchlist. Tapi pertanyaannya yang sebenarnya bukan:
👉 “Yang mana yang akan memompa?”
Pertanyaan yang lebih baik adalah:
“Yang sedang dikatakan pasar kepada kita sebelum pergerakan terjadi?”
🔎 1️⃣ $COMP — Likuiditas DeFi
Compound adalah salah satu nama mapan di DeFi lending. Ketika aktivitas DeFi meningkat, token yang terhubung dengan lending dan likuiditas dapat kembali menarik perhatian.
Untuk COMP, perhatikan volume dan struktur harga. Breakout tanpa volume yang berarti bisa lebih lemah daripada yang terlihat.
🪐 2️⃣ $JUP — Infrastruktur Trading Solana
Jupiter sangat terkait dengan ekosistem trading Solana. Karena berperan sebagai lapisan infrastruktur routing likuiditas dan trading utama, peningkatan aktivitas di Solana dapat membuat JUP masuk radar para trader.
Perhatikan perluasan volume dan tembusnya resistance, bukan mengejar candle yang muncul tiba-tiba.
⚡ 3️⃣ $JTO — Staking Solana & MEV
Jito adalah bagian penting lain dari ekosistem Solana, terutama di sekitar infrastruktur staking dan MEV.
Jika aktivitas Solana meningkat, trader mungkin mulai mengamati JTO untuk peluang momentum.
📊 KEUNGGULAN NYATA
Jangan beli hanya karena sebuah token sedang tren.
Cari:
✅ Volume yang meningkat
✅ Breakout + konfirmasi
✅ Support kuat yang bertahan
✅ Arah pasar BTC
✅ Likuiditas yang makin bertambah
✅ Risk/reward minimal 1:2
Sebuah candle hijau bukan konfirmasi dengan sendirinya.
🔥 Yang mana paling kamu pantau: COMP, JUP, atau JTO?
Tulis pilihanmu di bawah dan jelaskan alasannya.
#COMP #JUP #JTO #DeFi #Solana #Crypto #Altcoins #BinanceSquare
Pasar bisa terlihat tenang… sampai beberapa altcoin tiba-tiba mulai menarik volume, trader, dan likuiditas.
Hari ini, COMP, JUP, dan JTO adalah tiga nama yang layak masuk watchlist. Tapi pertanyaannya yang sebenarnya bukan:
👉 “Yang mana yang akan memompa?”
Pertanyaan yang lebih baik adalah:
“Yang sedang dikatakan pasar kepada kita sebelum pergerakan terjadi?”
🔎 1️⃣ $COMP — Likuiditas DeFi
Compound adalah salah satu nama mapan di DeFi lending. Ketika aktivitas DeFi meningkat, token yang terhubung dengan lending dan likuiditas dapat kembali menarik perhatian.
Untuk COMP, perhatikan volume dan struktur harga. Breakout tanpa volume yang berarti bisa lebih lemah daripada yang terlihat.
🪐 2️⃣ $JUP — Infrastruktur Trading Solana
Jupiter sangat terkait dengan ekosistem trading Solana. Karena berperan sebagai lapisan infrastruktur routing likuiditas dan trading utama, peningkatan aktivitas di Solana dapat membuat JUP masuk radar para trader.
Perhatikan perluasan volume dan tembusnya resistance, bukan mengejar candle yang muncul tiba-tiba.
⚡ 3️⃣ $JTO — Staking Solana & MEV
Jito adalah bagian penting lain dari ekosistem Solana, terutama di sekitar infrastruktur staking dan MEV.
Jika aktivitas Solana meningkat, trader mungkin mulai mengamati JTO untuk peluang momentum.
📊 KEUNGGULAN NYATA
Jangan beli hanya karena sebuah token sedang tren.
Cari:
✅ Volume yang meningkat
✅ Breakout + konfirmasi
✅ Support kuat yang bertahan
✅ Arah pasar BTC
✅ Likuiditas yang makin bertambah
✅ Risk/reward minimal 1:2
Sebuah candle hijau bukan konfirmasi dengan sendirinya.
🔥 Yang mana paling kamu pantau: COMP, JUP, atau JTO?
Tulis pilihanmu di bawah dan jelaskan alasannya.
#COMP #JUP #JTO #DeFi #Solana #Crypto #Altcoins #BinanceSquare
7
·
--
🚨 LDO, MKR & CRV: 3 Token DeFi yang Mungkin Layak Ditonton
Pasar DeFi bisa bergerak dengan tenang.
Sementara para trader mengejar koin-koin yang sedang tren terbaru, protokol DeFi mapan seperti LDO, MKR, dan CRV terus membangun infrastruktur seputar staking, lending, dan likuiditas terdesentralisasi.
Tapi ini pertanyaannya yang penting:
Apakah token-token ini menunjukkan peluang nyata—atau para trader hanya mengejar narasi DeFi yang sudah familiar? 👀
🔹 $LDO — Liquid Staking
{spot}(LDOUSDT)
LDO terhubung erat dengan staking Ethereum melalui Lido. Narasinya terkait dengan pertumbuhan liquid staking dan kebutuhan akan cara yang lebih fleksibel untuk ikut berpartisipasi dalam staking.
Hal-hal kunci yang perlu diperhatikan: aktivitas staking ETH, volume LDO, struktur pasar, dan likuiditas.
🔹 $MKR — Tata Kelola DeFi
MKR secara historis terkait dengan ekosistem lending desentralisasi milik Maker dan tata kelola (governance). Perilaku pasarnya dapat memberi petunjuk tentang bagaimana para trader menempatkan diri di tengah sektor DeFi yang lebih luas.
Pantau volume, support/resistance, serta perubahan sentimen DeFi.
🔹 $CRV — Likuiditas DeFi
{spot}(CRVUSDT)
CRV berhubungan dengan Curve, sebuah ekosistem bursa terdesentralisasi utama yang berfokus pada perdagangan stablecoin dan aset serupa secara efisien.
Untuk CRV, para trader sebaiknya memperhatikan likuiditas, volume, volatilitas, dan aktivitas ekosistem.
📊 Gambaran Besar
Ketiga token ini mewakili bagian berbeda dari lanskap DeFi:
LDO → Staking
MKR → Lending/Governance
CRV → Likuiditas/DEX
Jika aktivitas DeFi berkembang, narasi-narasi ini bisa menarik perhatian pasar yang kembali. Namun, kripto tetap sangat volatil—narasi yang kuat tidak menjamin kenaikan harga.
🎯 Checklist untuk Trader
Sebelum masuk ke setiap trading, cek:
• Arah tren
• Volume trading
• Struktur pasar BTC
• Support/resistance utama
• Open interest & funding
• Risk/reward
• Level stop-loss
💬 PERTANYAAN: Jika DeFi mulai memanas lagi, yang mana akan Anda masukkan dulu ke WATCHLIST: LDO, MKR, atau CRV?
#LDO #MKR #CRV #DeFi #Crypto #BinanceSquare #Ethereum #Altcoins #Web3 #CryptoTrading
🚨 LDO, MKR & CRV: 3 Token DeFi yang Mungkin Layak Ditonton
Pasar DeFi bisa bergerak dengan tenang.
Sementara para trader mengejar koin-koin yang sedang tren terbaru, protokol DeFi mapan seperti LDO, MKR, dan CRV terus membangun infrastruktur seputar staking, lending, dan likuiditas terdesentralisasi.
Tapi ini pertanyaannya yang penting:
Apakah token-token ini menunjukkan peluang nyata—atau para trader hanya mengejar narasi DeFi yang sudah familiar? 👀
🔹 $LDO — Liquid Staking
LDO terhubung erat dengan staking Ethereum melalui Lido. Narasinya terkait dengan pertumbuhan liquid staking dan kebutuhan akan cara yang lebih fleksibel untuk ikut berpartisipasi dalam staking.
Hal-hal kunci yang perlu diperhatikan: aktivitas staking ETH, volume LDO, struktur pasar, dan likuiditas.
🔹 $MKR — Tata Kelola DeFi
MKR secara historis terkait dengan ekosistem lending desentralisasi milik Maker dan tata kelola (governance). Perilaku pasarnya dapat memberi petunjuk tentang bagaimana para trader menempatkan diri di tengah sektor DeFi yang lebih luas.
Pantau volume, support/resistance, serta perubahan sentimen DeFi.
🔹 $CRV — Likuiditas DeFi
CRV berhubungan dengan Curve, sebuah ekosistem bursa terdesentralisasi utama yang berfokus pada perdagangan stablecoin dan aset serupa secara efisien.
Untuk CRV, para trader sebaiknya memperhatikan likuiditas, volume, volatilitas, dan aktivitas ekosistem.
📊 Gambaran Besar
Ketiga token ini mewakili bagian berbeda dari lanskap DeFi:
LDO → Staking
MKR → Lending/Governance
CRV → Likuiditas/DEX
Jika aktivitas DeFi berkembang, narasi-narasi ini bisa menarik perhatian pasar yang kembali. Namun, kripto tetap sangat volatil—narasi yang kuat tidak menjamin kenaikan harga.
🎯 Checklist untuk Trader
Sebelum masuk ke setiap trading, cek:
• Arah tren
• Volume trading
• Struktur pasar BTC
• Support/resistance utama
• Open interest & funding
• Risk/reward
• Level stop-loss
💬 PERTANYAAN: Jika DeFi mulai memanas lagi, yang mana akan Anda masukkan dulu ke WATCHLIST: LDO, MKR, atau CRV?
#LDO #MKR #CRV #DeFi #Crypto #BinanceSquare #Ethereum #Altcoins #Web3 #CryptoTrading
Pasar DeFi bisa bergerak dengan tenang.
Sementara para trader mengejar koin-koin yang sedang tren terbaru, protokol DeFi mapan seperti LDO, MKR, dan CRV terus membangun infrastruktur seputar staking, lending, dan likuiditas terdesentralisasi.
Tapi ini pertanyaannya yang penting:
Apakah token-token ini menunjukkan peluang nyata—atau para trader hanya mengejar narasi DeFi yang sudah familiar? 👀
🔹 $LDO — Liquid Staking
LDO terhubung erat dengan staking Ethereum melalui Lido. Narasinya terkait dengan pertumbuhan liquid staking dan kebutuhan akan cara yang lebih fleksibel untuk ikut berpartisipasi dalam staking.
Hal-hal kunci yang perlu diperhatikan: aktivitas staking ETH, volume LDO, struktur pasar, dan likuiditas.
🔹 $MKR — Tata Kelola DeFi
MKR secara historis terkait dengan ekosistem lending desentralisasi milik Maker dan tata kelola (governance). Perilaku pasarnya dapat memberi petunjuk tentang bagaimana para trader menempatkan diri di tengah sektor DeFi yang lebih luas.
Pantau volume, support/resistance, serta perubahan sentimen DeFi.
🔹 $CRV — Likuiditas DeFi
CRV berhubungan dengan Curve, sebuah ekosistem bursa terdesentralisasi utama yang berfokus pada perdagangan stablecoin dan aset serupa secara efisien.
Untuk CRV, para trader sebaiknya memperhatikan likuiditas, volume, volatilitas, dan aktivitas ekosistem.
📊 Gambaran Besar
Ketiga token ini mewakili bagian berbeda dari lanskap DeFi:
LDO → Staking
MKR → Lending/Governance
CRV → Likuiditas/DEX
Jika aktivitas DeFi berkembang, narasi-narasi ini bisa menarik perhatian pasar yang kembali. Namun, kripto tetap sangat volatil—narasi yang kuat tidak menjamin kenaikan harga.
🎯 Checklist untuk Trader
Sebelum masuk ke setiap trading, cek:
• Arah tren
• Volume trading
• Struktur pasar BTC
• Support/resistance utama
• Open interest & funding
• Risk/reward
• Level stop-loss
💬 PERTANYAAN: Jika DeFi mulai memanas lagi, yang mana akan Anda masukkan dulu ke WATCHLIST: LDO, MKR, atau CRV?
#LDO #MKR #CRV #DeFi #Crypto #BinanceSquare #Ethereum #Altcoins #Web3 #CryptoTrading
182
Masuk untuk menjelajahi konten lainnya
Bergabunglah dengan pengguna kripto global di Binance Square
⚡️ Dapatkan informasi terbaru dan berguna tentang kripto.
💬 Dipercayai oleh bursa kripto terbesar di dunia.
👍 Temukan wawasan nyata dari kreator terverifikasi.
Email/Nomor Ponsel
Topik Sedang Tren
SolanaTokenizedStockVolumeTops$4.4BInSeptember
46 penayangan
3 Berdiskusi
#SolanaTokenizedStockVolumeTops$4.4BInSeptember
Solana baru saja mencatat volume perdagangan saham token (Tokenized Stock) melebihi 4,4 miliar USD pada bulan September 2026. Dua “lokomotif” Raydium dan Orca menanggung arus dana ini.
Faktanya, tren tokenisasi aset dunia nyata (RWA) sedang meledak luar biasa. Selain Solana, perlombaan RWA juga diikuti para raksasa seperti BNB Chain, Base, Avalanche, Stellar, XRP Ledger. Namun, Ethereum tetap menjadi “bos” yang memimpin segmen RWA dengan pangsa pasar yang dominan untuk arus dana maupun likuiditas.
Trader harus berbuat apa? Hanya diam saja melihat aset dunia “on-chain”? Perhatikan arus dana RWA, buru peluang di DEX besar, dan siapkan posisi Anda.
Ini bukan nasihat keuangan.
Daftar akun baru untuk mendapatkan promo:
Kode referensi: VINHTOCDO
Link pendaftaran: Binance
Klik perdagangan di bawah ini untuk mendukung saya:
$SOL
$RAY
$ORCA
#SolanaRWA #TokenizedStocks #RealWorldAssets #CryptoTrading #DeFi #VINHTOCDO
Vinhtocdo
·Disukai 1 Kali
·27 penayangan
BitcoinSpotETFsDraw$6.34BInflowsInQ3
7,727 penayangan
115 Berdiskusi
EthereumValidatorExitQueueJumps392%
144,119 penayangan
1,144 Berdiskusi