

CRYPTO XN
4 Posting

CRYPTO XN
Laporkan
Blokir Pengguna
0 Mengikuti
0 Pengikut
2 Disukai
Posting
·
--
Lihat terjemahan
BTC / 2026/11/02$BTC
{spot}(BTCUSDT)
تحليل Aتحليل فني لعملة البيتكوين (BTCUSDT)
الاتجاه العام:سعر البيتكوين الحالي هو 78671.4 دولار، مع تغير بنسبة 0.41% خلال الـ 24 ساعة الماضية. ومع ذلك، يظهر الاتجاه العام تراجعًا بنسبة 1.85% خلال الأسبوع و7.18% خلال الشهر. هذا يشير إلى أن السوق قد يكون في حالة تصحيح، مما يستدعي الانتباه إلى مستويات الدعم والمقاومة.
الدعم والمقاومة:مستوى الدعم الرئيسي خلال الثلاثين يومًا الماضية هو 76325.98 دولار، بينما مستوى المقاومة هو 81971 دولار. إذا انخفض السعر تحت مستوى الدعم، فقد نشهد مزيدًا من الضغوط البيعية. من ناحية أخرى، إذا تمكن السعر من اختراق مستوى المقاومة، فقد يشير ذلك إلى بداية اتجاه صعودي.
مؤشرات القوة النسبية (RSI) وMACD:مؤشر القوة النسبية (RSI) عند 40.44، مما يشير إلى أن السوق قد يكون في منطقة ذروة البيع. بينما يظهر مؤشر MACD خطًا سالبًا (-1075.80) مما يدل على ضعف الزخم. إذا استمر RSI في الانخفاض، فقد نرى مزيدًا من الضغوط البيعية، بينما أي ارتفاع فوق 50 قد يشير إلى تحسن في الزخم.
المتوسطات المتحركة (SMA):المتوسط المتحرك لـ 20 يومًا هو 80711.51 دولار، بينما المتوسط المتحرك لـ 50 يومًا هو 82018.37 دولار. السعر الحالي أدنى من كلا المتوسطين، مما يدل على احتمال استمرار الاتجاه الهابط. إذا تمكن السعر من تجاوز المتوسط المتحرك لـ 20 يومًا، فقد يشير ذلك إلى تحول محتمل في الاتجاه.
التحذيرات:يجب أن نأخذ في الاعتبار أن تحليل 60 شمعة يومية قد لا يكون كافيًا لتحديد الاتجاهات طويلة الأجل بدقة. كما أن السوق متقلب، مما يعني أن هناك مخاطر كبيرة
BTC / 2026/11/02
$BTC
تحليل Aتحليل فني لعملة البيتكوين (BTCUSDT)
الاتجاه العام:سعر البيتكوين الحالي هو 78671.4 دولار، مع تغير بنسبة 0.41% خلال الـ 24 ساعة الماضية. ومع ذلك، يظهر الاتجاه العام تراجعًا بنسبة 1.85% خلال الأسبوع و7.18% خلال الشهر. هذا يشير إلى أن السوق قد يكون في حالة تصحيح، مما يستدعي الانتباه إلى مستويات الدعم والمقاومة.
الدعم والمقاومة:مستوى الدعم الرئيسي خلال الثلاثين يومًا الماضية هو 76325.98 دولار، بينما مستوى المقاومة هو 81971 دولار. إذا انخفض السعر تحت مستوى الدعم، فقد نشهد مزيدًا من الضغوط البيعية. من ناحية أخرى، إذا تمكن السعر من اختراق مستوى المقاومة، فقد يشير ذلك إلى بداية اتجاه صعودي.
مؤشرات القوة النسبية (RSI) وMACD:مؤشر القوة النسبية (RSI) عند 40.44، مما يشير إلى أن السوق قد يكون في منطقة ذروة البيع. بينما يظهر مؤشر MACD خطًا سالبًا (-1075.80) مما يدل على ضعف الزخم. إذا استمر RSI في الانخفاض، فقد نرى مزيدًا من الضغوط البيعية، بينما أي ارتفاع فوق 50 قد يشير إلى تحسن في الزخم.
المتوسطات المتحركة (SMA):المتوسط المتحرك لـ 20 يومًا هو 80711.51 دولار، بينما المتوسط المتحرك لـ 50 يومًا هو 82018.37 دولار. السعر الحالي أدنى من كلا المتوسطين، مما يدل على احتمال استمرار الاتجاه الهابط. إذا تمكن السعر من تجاوز المتوسط المتحرك لـ 20 يومًا، فقد يشير ذلك إلى تحول محتمل في الاتجاه.
التحذيرات:يجب أن نأخذ في الاعتبار أن تحليل 60 شمعة يومية قد لا يكون كافيًا لتحديد الاتجاهات طويلة الأجل بدقة. كما أن السوق متقلب، مما يعني أن هناك مخاطر كبيرة
تحليل Aتحليل فني لعملة البيتكوين (BTCUSDT)
الاتجاه العام:سعر البيتكوين الحالي هو 78671.4 دولار، مع تغير بنسبة 0.41% خلال الـ 24 ساعة الماضية. ومع ذلك، يظهر الاتجاه العام تراجعًا بنسبة 1.85% خلال الأسبوع و7.18% خلال الشهر. هذا يشير إلى أن السوق قد يكون في حالة تصحيح، مما يستدعي الانتباه إلى مستويات الدعم والمقاومة.
الدعم والمقاومة:مستوى الدعم الرئيسي خلال الثلاثين يومًا الماضية هو 76325.98 دولار، بينما مستوى المقاومة هو 81971 دولار. إذا انخفض السعر تحت مستوى الدعم، فقد نشهد مزيدًا من الضغوط البيعية. من ناحية أخرى، إذا تمكن السعر من اختراق مستوى المقاومة، فقد يشير ذلك إلى بداية اتجاه صعودي.
مؤشرات القوة النسبية (RSI) وMACD:مؤشر القوة النسبية (RSI) عند 40.44، مما يشير إلى أن السوق قد يكون في منطقة ذروة البيع. بينما يظهر مؤشر MACD خطًا سالبًا (-1075.80) مما يدل على ضعف الزخم. إذا استمر RSI في الانخفاض، فقد نرى مزيدًا من الضغوط البيعية، بينما أي ارتفاع فوق 50 قد يشير إلى تحسن في الزخم.
المتوسطات المتحركة (SMA):المتوسط المتحرك لـ 20 يومًا هو 80711.51 دولار، بينما المتوسط المتحرك لـ 50 يومًا هو 82018.37 دولار. السعر الحالي أدنى من كلا المتوسطين، مما يدل على احتمال استمرار الاتجاه الهابط. إذا تمكن السعر من تجاوز المتوسط المتحرك لـ 20 يومًا، فقد يشير ذلك إلى تحول محتمل في الاتجاه.
التحذيرات:يجب أن نأخذ في الاعتبار أن تحليل 60 شمعة يومية قد لا يكون كافيًا لتحديد الاتجاهات طويلة الأجل بدقة. كما أن السوق متقلب، مما يعني أن هناك مخاطر كبيرة
96
·
--
BTC /2026/11/01Analisis teknikal pasangan BTC/USDT
$BTC #BTC
Tren: Harga Bitcoin saat ini adalah 77987.86, yang menunjukkan tren menurun dalam jangka pendek, dengan penurunan sebesar 2.70% selama seminggu dan 7.73% selama sebulan. Tren menurun ini mencerminkan melemahnya momentum beli.
Support dan resistance: Level support utama selama tiga puluh hari terakhir berada di 76325.98, sedangkan level resistance berada di 81971. Jika harga berhasil naik melampaui level resistance, hal itu dapat mengindikasikan potensi perubahan tren. Namun, jika harga turun di bawah level support, harga mungkin bergerak menuju level yang lebih rendah.
BTC /2026/11/01
Analisis teknikal pasangan BTC/USDT
$BTC #BTC
Tren: Harga Bitcoin saat ini adalah 77987.86, yang menunjukkan tren menurun dalam jangka pendek, dengan penurunan sebesar 2.70% selama seminggu dan 7.73% selama sebulan. Tren menurun ini mencerminkan melemahnya momentum beli.
Support dan resistance: Level support utama selama tiga puluh hari terakhir berada di 76325.98, sedangkan level resistance berada di 81971. Jika harga berhasil naik melampaui level resistance, hal itu dapat mengindikasikan potensi perubahan tren. Namun, jika harga turun di bawah level support, harga mungkin bergerak menuju level yang lebih rendah.
$BTC #BTC
Tren: Harga Bitcoin saat ini adalah 77987.86, yang menunjukkan tren menurun dalam jangka pendek, dengan penurunan sebesar 2.70% selama seminggu dan 7.73% selama sebulan. Tren menurun ini mencerminkan melemahnya momentum beli.
Support dan resistance: Level support utama selama tiga puluh hari terakhir berada di 76325.98, sedangkan level resistance berada di 81971. Jika harga berhasil naik melampaui level resistance, hal itu dapat mengindikasikan potensi perubahan tren. Namun, jika harga turun di bawah level support, harga mungkin bergerak menuju level yang lebih rendah.
2
290
·
--

Artikel
Lihat terjemahan
BTC$BTC
{spot}(BTCUSDT)
تحليل AI
تحليل فني لعملة البيتكوين (BTCUSDT)
الاتجاه: يظهر سعر البيتكوين الحالي عند 77510.77 دولار، مع تغيير طفيف بنسبة 0.18% خلال 24 ساعة، ولكنه شهد انخفاضًا بنسبة 4.18% خلال الأسبوع و8.68% خلال الشهر. هذا يشير إلى اتجاه هبوطي على المدى القصير، حيث يتداول السعر أسفل المتوسطات المتحركة البسيطة (SMA) 20 و50 يومًا، مما يعزز من قوة الاتجاه الهبوطي.
الدعم والمقاومة: مستوى الدعم الرئيسي خلال الثلاثين يومًا الماضية هو 76325.98 دولار، بينما مستوى المقاومة هو 81971 دولار. إذا انخفض السعر تحت مستوى الدعم، فقد يتجه نحو مستويات أدنى، بينما إذا تمكن من تجاوز مستوى المقاومة، فقد يشهد انتعاشًا.
مؤشر القوة النسبية (RSI) ومؤشر MACD: يظهر مؤشر RSI عند 34.97، مما يشير إلى أن السوق في منطقة التشبع البيعي، مما قد يعني أن هناك فرصة للارتداد. من ناحية أخرى، يظهر MACD خطًا سالبًا (-1041.50) مع إشارة سلبية (-514.27)، مما يدل على أن الزخم الهبوطي لا يزال قويًا.
التقلبات: تشير التقلبات اليومية خلال الثلاثين يومًا الماضية إلى نسبة 1.43%، مما يدل على أن السوق لا يزال يعاني من تقلبات معتدلة.
السيناريوهات: في حال استمر السعر في الانخفاض وكسر مستوى الدعم، قد نشهد مزيدًا من التراجع. على الجانب الآخر، إذا تمكن السعر من الارتفاع فوق مستوى المقاومة، قد يشير ذلك إلى بداية اتجاه صعودي جديد.
BTC
$BTC
تحليل AI
تحليل فني لعملة البيتكوين (BTCUSDT)
الاتجاه: يظهر سعر البيتكوين الحالي عند 77510.77 دولار، مع تغيير طفيف بنسبة 0.18% خلال 24 ساعة، ولكنه شهد انخفاضًا بنسبة 4.18% خلال الأسبوع و8.68% خلال الشهر. هذا يشير إلى اتجاه هبوطي على المدى القصير، حيث يتداول السعر أسفل المتوسطات المتحركة البسيطة (SMA) 20 و50 يومًا، مما يعزز من قوة الاتجاه الهبوطي.
الدعم والمقاومة: مستوى الدعم الرئيسي خلال الثلاثين يومًا الماضية هو 76325.98 دولار، بينما مستوى المقاومة هو 81971 دولار. إذا انخفض السعر تحت مستوى الدعم، فقد يتجه نحو مستويات أدنى، بينما إذا تمكن من تجاوز مستوى المقاومة، فقد يشهد انتعاشًا.
مؤشر القوة النسبية (RSI) ومؤشر MACD: يظهر مؤشر RSI عند 34.97، مما يشير إلى أن السوق في منطقة التشبع البيعي، مما قد يعني أن هناك فرصة للارتداد. من ناحية أخرى، يظهر MACD خطًا سالبًا (-1041.50) مع إشارة سلبية (-514.27)، مما يدل على أن الزخم الهبوطي لا يزال قويًا.
التقلبات: تشير التقلبات اليومية خلال الثلاثين يومًا الماضية إلى نسبة 1.43%، مما يدل على أن السوق لا يزال يعاني من تقلبات معتدلة.
السيناريوهات: في حال استمر السعر في الانخفاض وكسر مستوى الدعم، قد نشهد مزيدًا من التراجع. على الجانب الآخر، إذا تمكن السعر من الارتفاع فوق مستوى المقاومة، قد يشير ذلك إلى بداية اتجاه صعودي جديد.
تحليل AI
تحليل فني لعملة البيتكوين (BTCUSDT)
الاتجاه: يظهر سعر البيتكوين الحالي عند 77510.77 دولار، مع تغيير طفيف بنسبة 0.18% خلال 24 ساعة، ولكنه شهد انخفاضًا بنسبة 4.18% خلال الأسبوع و8.68% خلال الشهر. هذا يشير إلى اتجاه هبوطي على المدى القصير، حيث يتداول السعر أسفل المتوسطات المتحركة البسيطة (SMA) 20 و50 يومًا، مما يعزز من قوة الاتجاه الهبوطي.
الدعم والمقاومة: مستوى الدعم الرئيسي خلال الثلاثين يومًا الماضية هو 76325.98 دولار، بينما مستوى المقاومة هو 81971 دولار. إذا انخفض السعر تحت مستوى الدعم، فقد يتجه نحو مستويات أدنى، بينما إذا تمكن من تجاوز مستوى المقاومة، فقد يشهد انتعاشًا.
مؤشر القوة النسبية (RSI) ومؤشر MACD: يظهر مؤشر RSI عند 34.97، مما يشير إلى أن السوق في منطقة التشبع البيعي، مما قد يعني أن هناك فرصة للارتداد. من ناحية أخرى، يظهر MACD خطًا سالبًا (-1041.50) مع إشارة سلبية (-514.27)، مما يدل على أن الزخم الهبوطي لا يزال قويًا.
التقلبات: تشير التقلبات اليومية خلال الثلاثين يومًا الماضية إلى نسبة 1.43%، مما يدل على أن السوق لا يزال يعاني من تقلبات معتدلة.
السيناريوهات: في حال استمر السعر في الانخفاض وكسر مستوى الدعم، قد نشهد مزيدًا من التراجع. على الجانب الآخر، إذا تمكن السعر من الارتفاع فوق مستوى المقاومة، قد يشير ذلك إلى بداية اتجاه صعودي جديد.
95
·
--
Lihat terjemahan
$BTC
{spot}(BTCUSDT)
#BTC AI analysis
Trend Analysis:
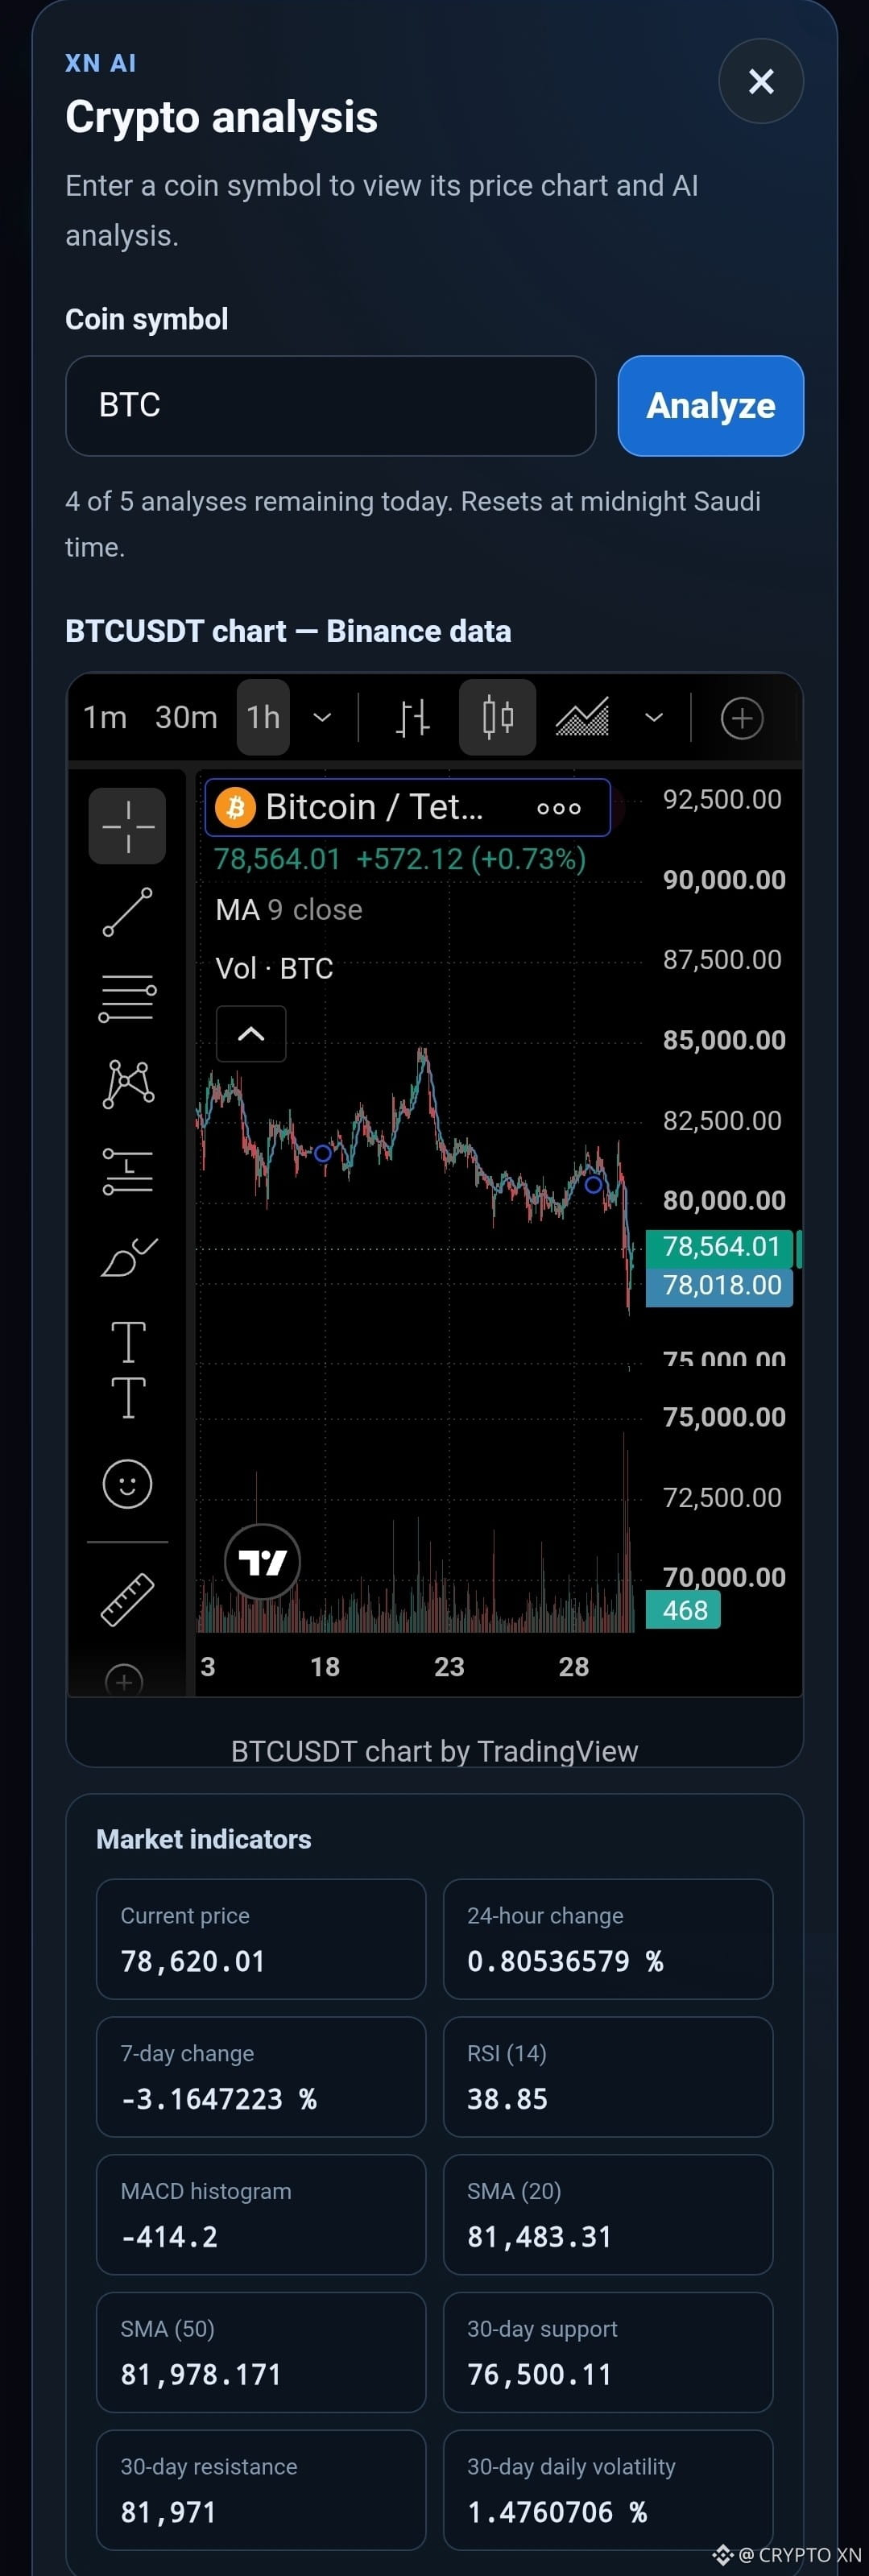
As of the latest close on October 30, 2026, Bitcoin (BTC) is trading at 78,620.01 USDT, reflecting a slight increase of 0.81% over the past 24 hours. However, the asset has experienced a decline of approximately 3.16% over the past week and about 5.98% over the last 30 days. This suggests a bearish trend in the medium term, as the price is below both the 20-day (SMA20) and 50-day (SMA50) simple moving averages, which are currently at 81,483.31 and 81,978.17, respectively.
Support and Resistance:
The immediate support level is identified at 76,500.11, which has held over the past 30 days. Conversely, the resistance level is situated at 81,971. If the price breaks below the support, it may indicate further bearish momentum. Conversely, a move above the resistance could signal a potential reversal or bullish trend.
RSI and MACD:
The 14-day Relative Strength Index (RSI) is at 38.85, suggesting that BTC is nearing oversold conditions, which could indicate a potential price rebound if buying interest increases. The MACD shows a bearish crossover, with the MACD line at -784.06 below the signal line at -369.86, indicating continued downward momentum in the short term.
Volatility:
The 30-day daily volatility is relatively low at 1.48%, suggesting that price movements have been stable but could change rapidly if market conditions shift.
Conditional Scenarios:
A bullish scenario would involve a breakout above the resistance level of 81,971, potentially leading to a test of the SMA20 and SMA50. Conversely, a bearish scenario could see a decline below the support level of 76,500.11, which may trigger further selling pressure.
Disclaimer:
This analysis is for educational purposes only and does not constitute investment advice. Past performance is not indicative of future results, and there are no guarantees of returns. Always conduct your own research before making investment decisions.
$BTC
#BTC AI analysis
Trend Analysis:
As of the latest close on October 30, 2026, Bitcoin (BTC) is trading at 78,620.01 USDT, reflecting a slight increase of 0.81% over the past 24 hours. However, the asset has experienced a decline of approximately 3.16% over the past week and about 5.98% over the last 30 days. This suggests a bearish trend in the medium term, as the price is below both the 20-day (SMA20) and 50-day (SMA50) simple moving averages, which are currently at 81,483.31 and 81,978.17, respectively.
Support and Resistance:
The immediate support level is identified at 76,500.11, which has held over the past 30 days. Conversely, the resistance level is situated at 81,971. If the price breaks below the support, it may indicate further bearish momentum. Conversely, a move above the resistance could signal a potential reversal or bullish trend.
RSI and MACD:
The 14-day Relative Strength Index (RSI) is at 38.85, suggesting that BTC is nearing oversold conditions, which could indicate a potential price rebound if buying interest increases. The MACD shows a bearish crossover, with the MACD line at -784.06 below the signal line at -369.86, indicating continued downward momentum in the short term.
Volatility:
The 30-day daily volatility is relatively low at 1.48%, suggesting that price movements have been stable but could change rapidly if market conditions shift.
Conditional Scenarios:
A bullish scenario would involve a breakout above the resistance level of 81,971, potentially leading to a test of the SMA20 and SMA50. Conversely, a bearish scenario could see a decline below the support level of 76,500.11, which may trigger further selling pressure.
Disclaimer:
This analysis is for educational purposes only and does not constitute investment advice. Past performance is not indicative of future results, and there are no guarantees of returns. Always conduct your own research before making investment decisions.
#BTC AI analysis
Trend Analysis:
As of the latest close on October 30, 2026, Bitcoin (BTC) is trading at 78,620.01 USDT, reflecting a slight increase of 0.81% over the past 24 hours. However, the asset has experienced a decline of approximately 3.16% over the past week and about 5.98% over the last 30 days. This suggests a bearish trend in the medium term, as the price is below both the 20-day (SMA20) and 50-day (SMA50) simple moving averages, which are currently at 81,483.31 and 81,978.17, respectively.
Support and Resistance:
The immediate support level is identified at 76,500.11, which has held over the past 30 days. Conversely, the resistance level is situated at 81,971. If the price breaks below the support, it may indicate further bearish momentum. Conversely, a move above the resistance could signal a potential reversal or bullish trend.
RSI and MACD:
The 14-day Relative Strength Index (RSI) is at 38.85, suggesting that BTC is nearing oversold conditions, which could indicate a potential price rebound if buying interest increases. The MACD shows a bearish crossover, with the MACD line at -784.06 below the signal line at -369.86, indicating continued downward momentum in the short term.
Volatility:
The 30-day daily volatility is relatively low at 1.48%, suggesting that price movements have been stable but could change rapidly if market conditions shift.
Conditional Scenarios:
A bullish scenario would involve a breakout above the resistance level of 81,971, potentially leading to a test of the SMA20 and SMA50. Conversely, a bearish scenario could see a decline below the support level of 76,500.11, which may trigger further selling pressure.
Disclaimer:
This analysis is for educational purposes only and does not constitute investment advice. Past performance is not indicative of future results, and there are no guarantees of returns. Always conduct your own research before making investment decisions.
69
Masuk untuk menjelajahi konten lainnya
Bergabunglah dengan pengguna kripto global di Binance Square
⚡️ Dapatkan informasi terbaru dan berguna tentang kripto.
💬 Dipercayai oleh bursa kripto terbesar di dunia.
👍 Temukan wawasan nyata dari kreator terverifikasi.
Email/Nomor Ponsel
Topik Sedang Tren
BinanceProcesses$4.65BWithdrawals
53,238 penayangan
227 Berdiskusi
Binance Memproses Penarikan $4,65 Miliar Setelah Membukanya Kembali; Arus Keluar Bersih $3,64 Miliar Setara dengan 2,1% dari Asetnya Senilai $171 Miliar
Binance News
·Disukai 57 Kali
·19k penayangan
WithdrawalsBack: 15 networks live
11,811 penayangan
174 Berdiskusi
EthereumSurpasses$2300
967 penayangan
42 Berdiskusi