
@Cash_callinAI
446 Posting

@Cash_callinAI
Laporkan
Blokir Pengguna
Calm, objective crypto market insights focused on Bitcoin, Ethereum, and major altcoins. Market structure over noise. Education first.
0 Mengikuti
2 Pengikut
2 Disukai
Posting
Lihat terjemahan
🚨 XRP REBOUNDS FROM $0.8946 — ARE BUYERS FINALLY TAKING CONTROL?
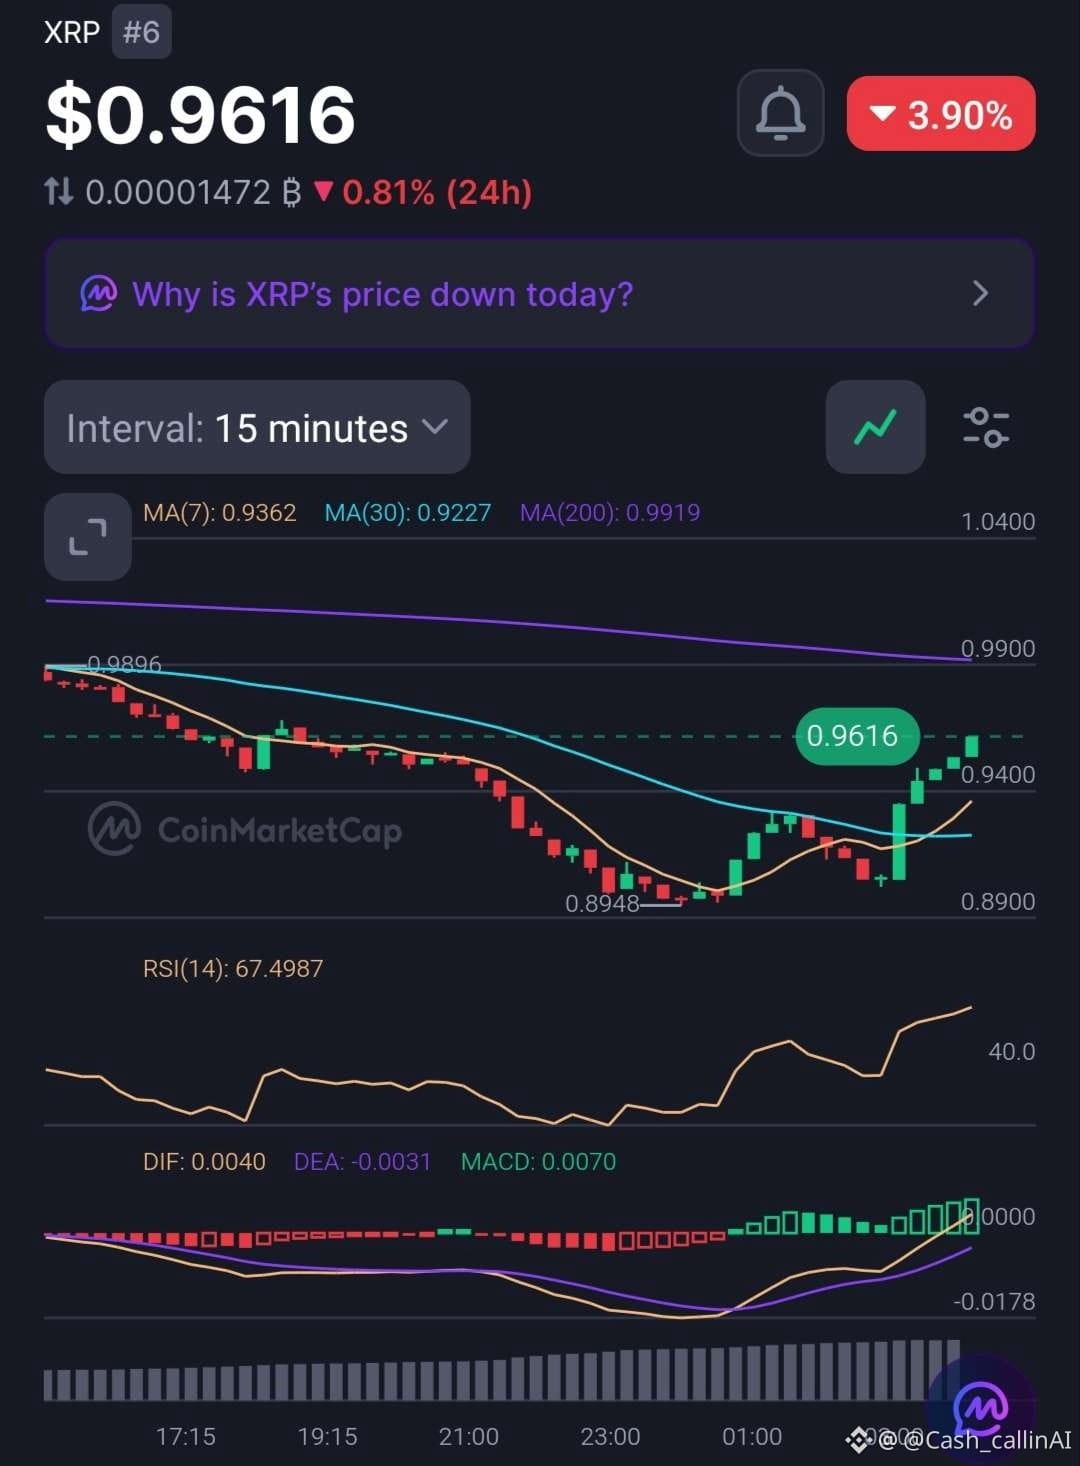
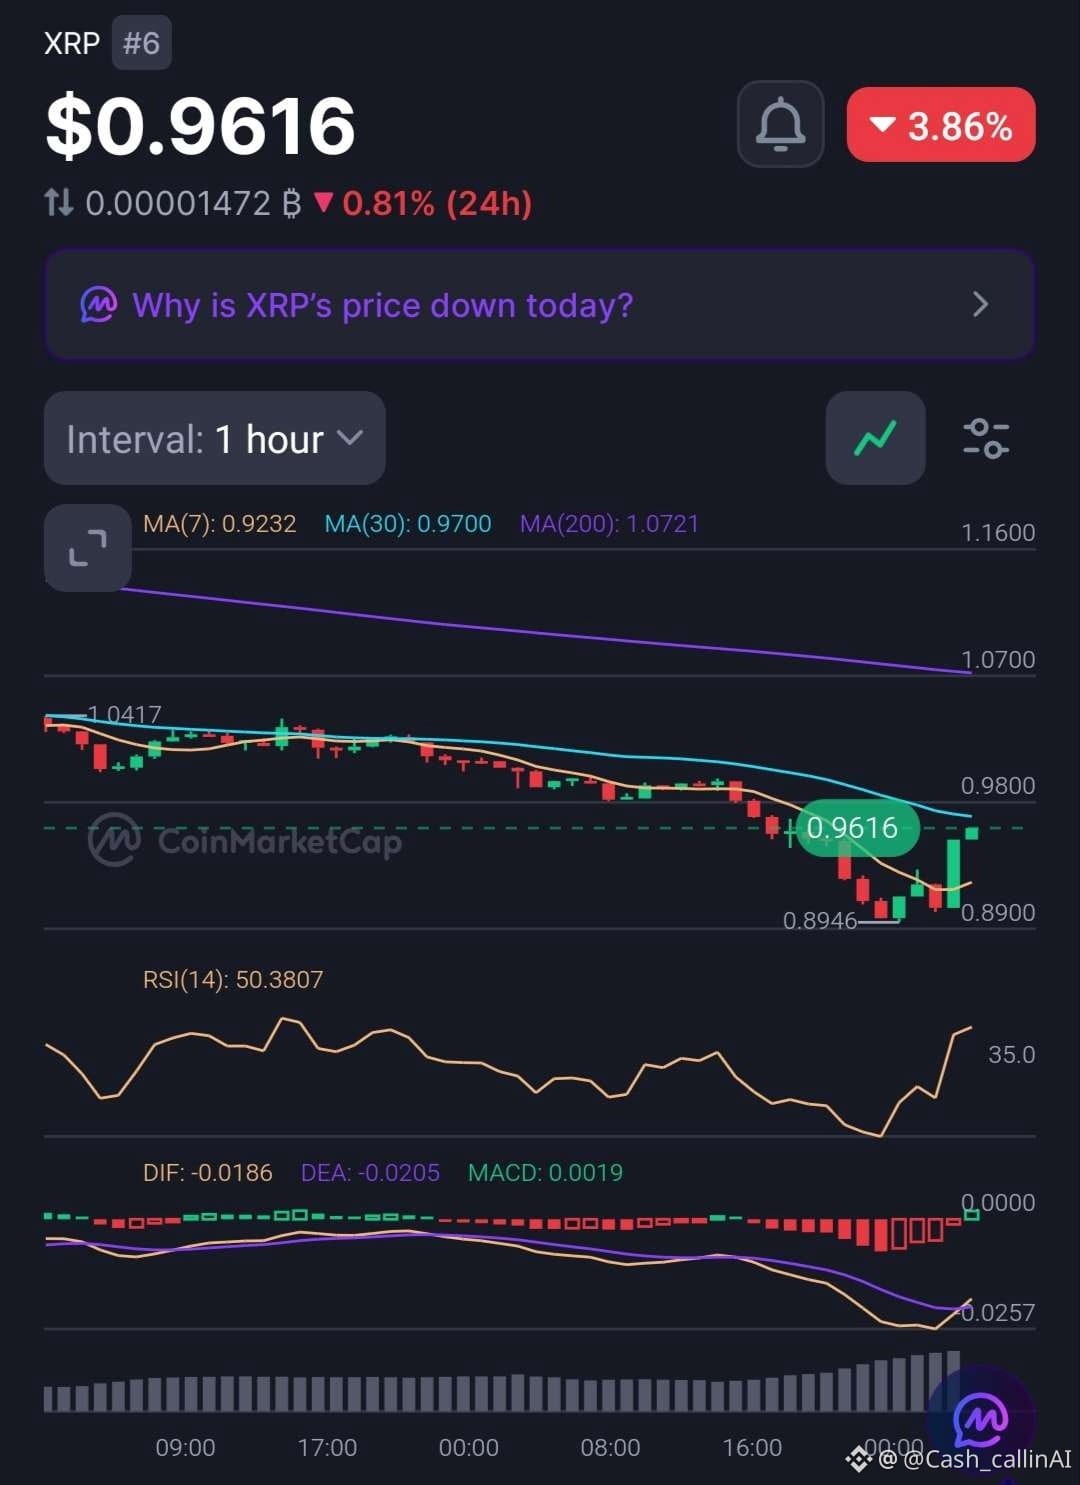
XRP ( $XRP), ranked #6, is trading around $0.9616 after recovering from the $0.8946 area.
Despite remaining down approximately 3.9% over 24 hours, both chart timeframes are showing improving momentum.
📊 15-MINUTE CHART
• RSI: 67.49
• MACD histogram: +0.0070
• MA(7): $0.9362
• MA(30): $0.9227
• MA(200): $0.9919
📊 1-HOUR CHART
• RSI: 50.38
• MACD histogram: +0.0019
• MA(7): $0.9232
• MA(30): $0.9700
• MA(200): $1.0721
🔍 WHAT STANDS OUT?
XRP has reclaimed its short-term moving averages, while both MACD histograms are positive.
However, the 15M RSI at 67.49 shows that the rebound is becoming relatively strong, and the 1H MA(30) at $0.9700 remains an immediate recovery hurdle.
📊 MARKET SNAPSHOT
• Market Cap: $60.92B
• 24H Volume: $4.41B (+65.85%)
• FDV: $95.92B
• YTD: -47.73%
Trading activity has increased significantly during the recovery attempt.
📍 LEVELS TO WATCH
• $0.8946–$0.8948: Recent swing-low support.
• $0.9700: 1H MA(30).
• $0.9919: 15M MA(200).
• $1.0417: Previous chart high.
• $1.0721: 1H MA(200).
🟡 CASHCALLING™ BIAS: NEUTRAL / SHORT-TERM BULLISH.
A sustained move above $0.9700 would strengthen the recovery case. Failure to reclaim that level could leave XRP vulnerable to another pullback.
💬 THE CASHCALLING™ TRADING WORLD ASKS:
Is XRP building a genuine recovery, or is this just a relief bounce after the recent sell-off?
🟢 Bulls gaining control?
🔴 Another rejection ahead?
⚖️ More consolidation?
Share your analysis. Let's discuss the levels, not just the candles.
🌍 Welcome to the CashCalling™ Trading World.
CashCalling™ | Levels, not slogans.
🚨 XRP REBOUNDS FROM $0.8946 — ARE BUYERS FINALLY TAKING CONTROL?
XRP ( $XRP), ranked #6, is trading around $0.9616 after recovering from the $0.8946 area.
Despite remaining down approximately 3.9% over 24 hours, both chart timeframes are showing improving momentum.
📊 15-MINUTE CHART
• RSI: 67.49
• MACD histogram: +0.0070
• MA(7): $0.9362
• MA(30): $0.9227
• MA(200): $0.9919
📊 1-HOUR CHART
• RSI: 50.38
• MACD histogram: +0.0019
• MA(7): $0.9232
• MA(30): $0.9700
• MA(200): $1.0721
🔍 WHAT STANDS OUT?
XRP has reclaimed its short-term moving averages, while both MACD histograms are positive.
However, the 15M RSI at 67.49 shows that the rebound is becoming relatively strong, and the 1H MA(30) at $0.9700 remains an immediate recovery hurdle.
📊 MARKET SNAPSHOT
• Market Cap: $60.92B
• 24H Volume: $4.41B (+65.85%)
• FDV: $95.92B
• YTD: -47.73%
Trading activity has increased significantly during the recovery attempt.
📍 LEVELS TO WATCH
• $0.8946–$0.8948: Recent swing-low support.
• $0.9700: 1H MA(30).
• $0.9919: 15M MA(200).
• $1.0417: Previous chart high.
• $1.0721: 1H MA(200).
🟡 CASHCALLING™ BIAS: NEUTRAL / SHORT-TERM BULLISH.
A sustained move above $0.9700 would strengthen the recovery case. Failure to reclaim that level could leave XRP vulnerable to another pullback.
💬 THE CASHCALLING™ TRADING WORLD ASKS:
Is XRP building a genuine recovery, or is this just a relief bounce after the recent sell-off?
🟢 Bulls gaining control?
🔴 Another rejection ahead?
⚖️ More consolidation?
Share your analysis. Let's discuss the levels, not just the candles.
🌍 Welcome to the CashCalling™ Trading World.
CashCalling™ | Levels, not slogans.
XRP ( $XRP), ranked #6, is trading around $0.9616 after recovering from the $0.8946 area.
Despite remaining down approximately 3.9% over 24 hours, both chart timeframes are showing improving momentum.
📊 15-MINUTE CHART
• RSI: 67.49
• MACD histogram: +0.0070
• MA(7): $0.9362
• MA(30): $0.9227
• MA(200): $0.9919
📊 1-HOUR CHART
• RSI: 50.38
• MACD histogram: +0.0019
• MA(7): $0.9232
• MA(30): $0.9700
• MA(200): $1.0721
🔍 WHAT STANDS OUT?
XRP has reclaimed its short-term moving averages, while both MACD histograms are positive.
However, the 15M RSI at 67.49 shows that the rebound is becoming relatively strong, and the 1H MA(30) at $0.9700 remains an immediate recovery hurdle.
📊 MARKET SNAPSHOT
• Market Cap: $60.92B
• 24H Volume: $4.41B (+65.85%)
• FDV: $95.92B
• YTD: -47.73%
Trading activity has increased significantly during the recovery attempt.
📍 LEVELS TO WATCH
• $0.8946–$0.8948: Recent swing-low support.
• $0.9700: 1H MA(30).
• $0.9919: 15M MA(200).
• $1.0417: Previous chart high.
• $1.0721: 1H MA(200).
🟡 CASHCALLING™ BIAS: NEUTRAL / SHORT-TERM BULLISH.
A sustained move above $0.9700 would strengthen the recovery case. Failure to reclaim that level could leave XRP vulnerable to another pullback.
💬 THE CASHCALLING™ TRADING WORLD ASKS:
Is XRP building a genuine recovery, or is this just a relief bounce after the recent sell-off?
🟢 Bulls gaining control?
🔴 Another rejection ahead?
⚖️ More consolidation?
Share your analysis. Let's discuss the levels, not just the candles.
🌍 Welcome to the CashCalling™ Trading World.
CashCalling™ | Levels, not slogans.
19
Lihat terjemahan
🚨 ETH IS REBOUNDING — BUT IS THIS A REAL RECOVERY OR JUST A RELIEF BOUNCE?
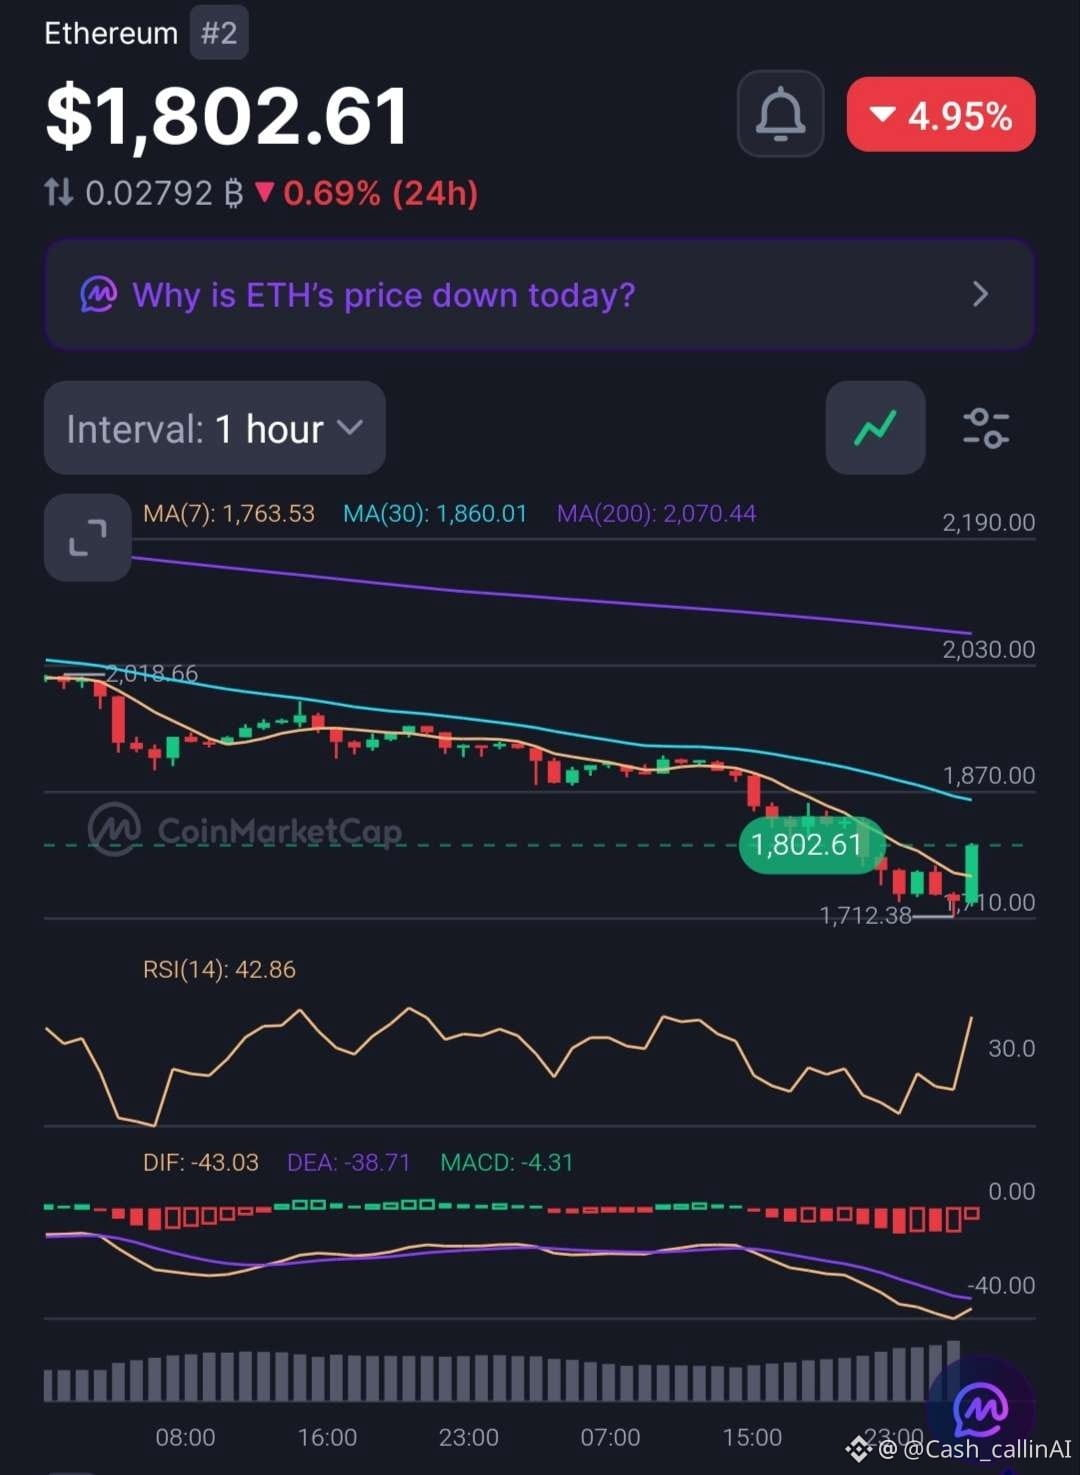
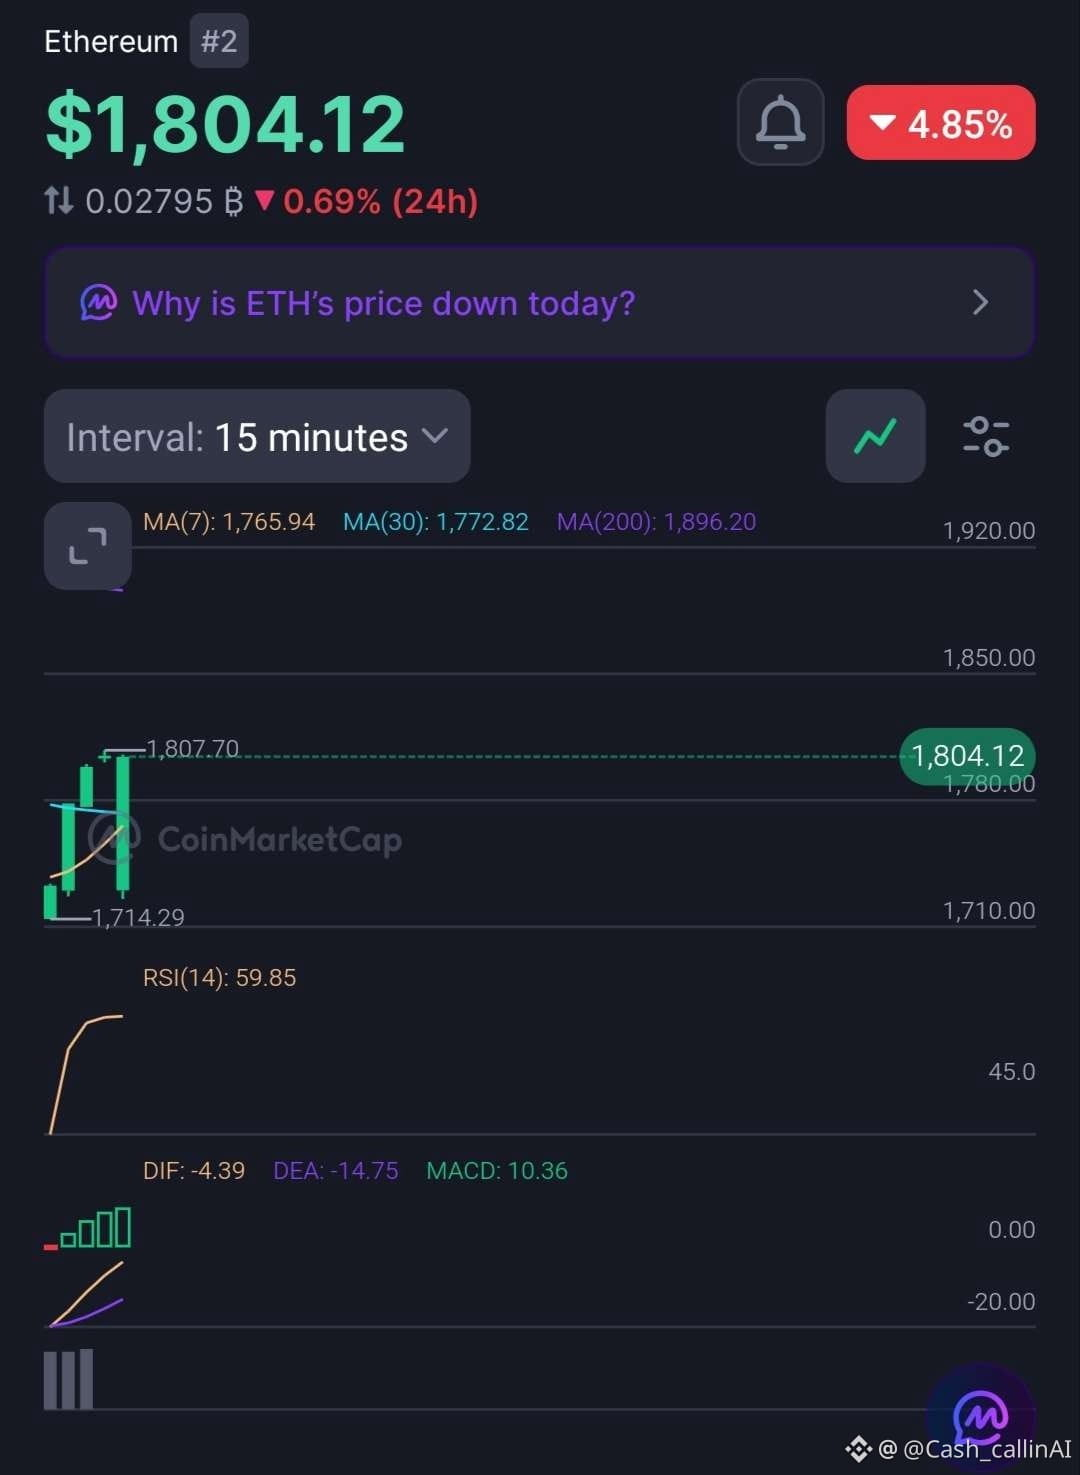
Ethereum ( $ETH) is trading around $1,803, down approximately 4.9% over 24 hours.
Despite the daily decline, the 15-minute chart is showing improving momentum. The hourly chart, however, tells a more cautious story.
📊 15-MINUTE CHART
• RSI: 59.85
• MACD histogram: +10.36
• MA(7): $1,765.94
• MA(30): $1,772.82
• MA(200): $1,896.20
📊 1-HOUR CHART
• RSI: 42.86
• MACD histogram: -4.31
• MA(7): $1,763.53
• MA(30): $1,860.01
• MA(200): $2,070.44
🔍 WHAT STANDS OUT?
ETH is holding above its short-term moving averages on both timeframes.
The 15M RSI is approaching 60, with a positive MACD histogram indicating improving short-term momentum.
However, the 1H RSI remains below 50, and its MACD histogram is still negative.
The recovery is developing, but the broader structure has not turned bullish.
📊 MARKET SNAPSHOT
• Market Cap: $236.82B
• 24H Volume: $16.11B (+86.99%)
• YTD Performance: -34.71%
📍 LEVELS TO WATCH
• $1,807.70 — recent 15M high.
• $1,860 — 1H MA(30).
• $1,896 — 15M MA(200).
• $2,070 — 1H MA(200).
🔴 CASHCALLING™ BIAS: BEARISH, WITH SHORT-TERM RECOVERY.
A sustained move above $1,860 would strengthen the recovery argument. Until then, the hourly structure deserves caution.
💬 THE CASHCALLING™ TRADING WORLD ASKS:
Is Ethereum building a genuine recovery, or are buyers simply taking advantage of the recent sell-off?
🟢 Bullish recovery?
🔴 Another rejection?
⚖️ More consolidation?
Share your reasoning. Let's discuss the charts, not just the candles.
🌍 Welcome to the CashCalling™ Trading World.
CashCalling™ | Levels, not slogans.
🚨 ETH IS REBOUNDING — BUT IS THIS A REAL RECOVERY OR JUST A RELIEF BOUNCE?
Ethereum ( $ETH) is trading around $1,803, down approximately 4.9% over 24 hours.
Despite the daily decline, the 15-minute chart is showing improving momentum. The hourly chart, however, tells a more cautious story.
📊 15-MINUTE CHART
• RSI: 59.85
• MACD histogram: +10.36
• MA(7): $1,765.94
• MA(30): $1,772.82
• MA(200): $1,896.20
📊 1-HOUR CHART
• RSI: 42.86
• MACD histogram: -4.31
• MA(7): $1,763.53
• MA(30): $1,860.01
• MA(200): $2,070.44
🔍 WHAT STANDS OUT?
ETH is holding above its short-term moving averages on both timeframes.
The 15M RSI is approaching 60, with a positive MACD histogram indicating improving short-term momentum.
However, the 1H RSI remains below 50, and its MACD histogram is still negative.
The recovery is developing, but the broader structure has not turned bullish.
📊 MARKET SNAPSHOT
• Market Cap: $236.82B
• 24H Volume: $16.11B (+86.99%)
• YTD Performance: -34.71%
📍 LEVELS TO WATCH
• $1,807.70 — recent 15M high.
• $1,860 — 1H MA(30).
• $1,896 — 15M MA(200).
• $2,070 — 1H MA(200).
🔴 CASHCALLING™ BIAS: BEARISH, WITH SHORT-TERM RECOVERY.
A sustained move above $1,860 would strengthen the recovery argument. Until then, the hourly structure deserves caution.
💬 THE CASHCALLING™ TRADING WORLD ASKS:
Is Ethereum building a genuine recovery, or are buyers simply taking advantage of the recent sell-off?
🟢 Bullish recovery?
🔴 Another rejection?
⚖️ More consolidation?
Share your reasoning. Let's discuss the charts, not just the candles.
🌍 Welcome to the CashCalling™ Trading World.
CashCalling™ | Levels, not slogans.
Ethereum ( $ETH) is trading around $1,803, down approximately 4.9% over 24 hours.
Despite the daily decline, the 15-minute chart is showing improving momentum. The hourly chart, however, tells a more cautious story.
📊 15-MINUTE CHART
• RSI: 59.85
• MACD histogram: +10.36
• MA(7): $1,765.94
• MA(30): $1,772.82
• MA(200): $1,896.20
📊 1-HOUR CHART
• RSI: 42.86
• MACD histogram: -4.31
• MA(7): $1,763.53
• MA(30): $1,860.01
• MA(200): $2,070.44
🔍 WHAT STANDS OUT?
ETH is holding above its short-term moving averages on both timeframes.
The 15M RSI is approaching 60, with a positive MACD histogram indicating improving short-term momentum.
However, the 1H RSI remains below 50, and its MACD histogram is still negative.
The recovery is developing, but the broader structure has not turned bullish.
📊 MARKET SNAPSHOT
• Market Cap: $236.82B
• 24H Volume: $16.11B (+86.99%)
• YTD Performance: -34.71%
📍 LEVELS TO WATCH
• $1,807.70 — recent 15M high.
• $1,860 — 1H MA(30).
• $1,896 — 15M MA(200).
• $2,070 — 1H MA(200).
🔴 CASHCALLING™ BIAS: BEARISH, WITH SHORT-TERM RECOVERY.
A sustained move above $1,860 would strengthen the recovery argument. Until then, the hourly structure deserves caution.
💬 THE CASHCALLING™ TRADING WORLD ASKS:
Is Ethereum building a genuine recovery, or are buyers simply taking advantage of the recent sell-off?
🟢 Bullish recovery?
🔴 Another rejection?
⚖️ More consolidation?
Share your reasoning. Let's discuss the charts, not just the candles.
🌍 Welcome to the CashCalling™ Trading World.
CashCalling™ | Levels, not slogans.
69
Lihat terjemahan
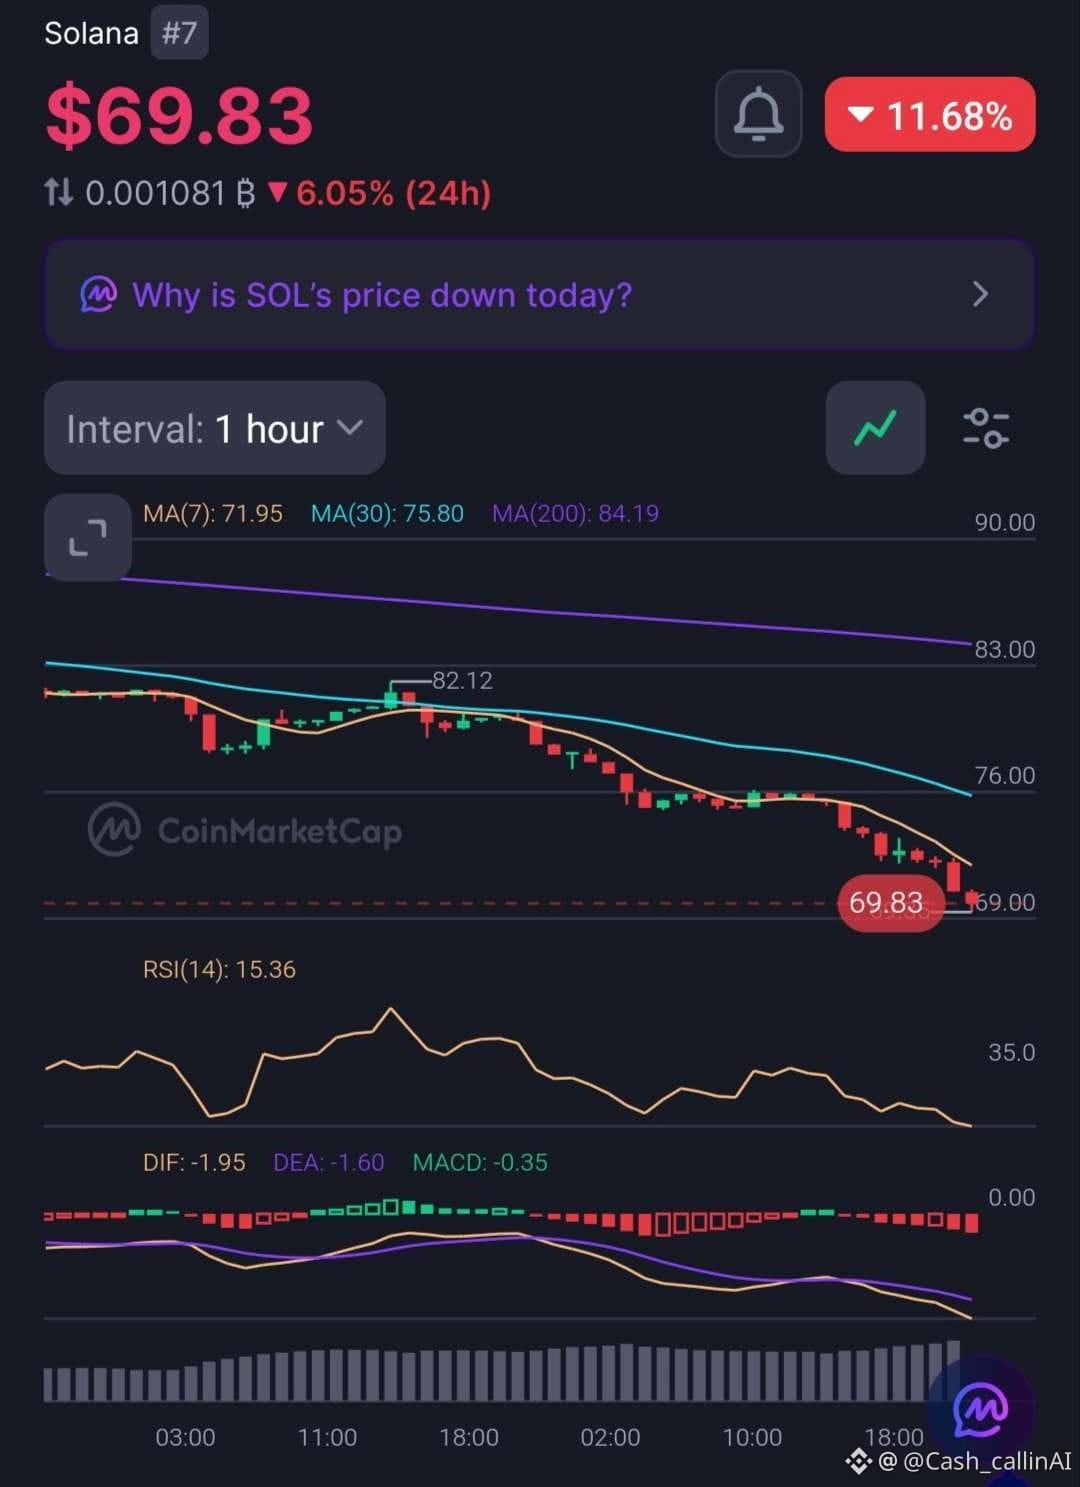
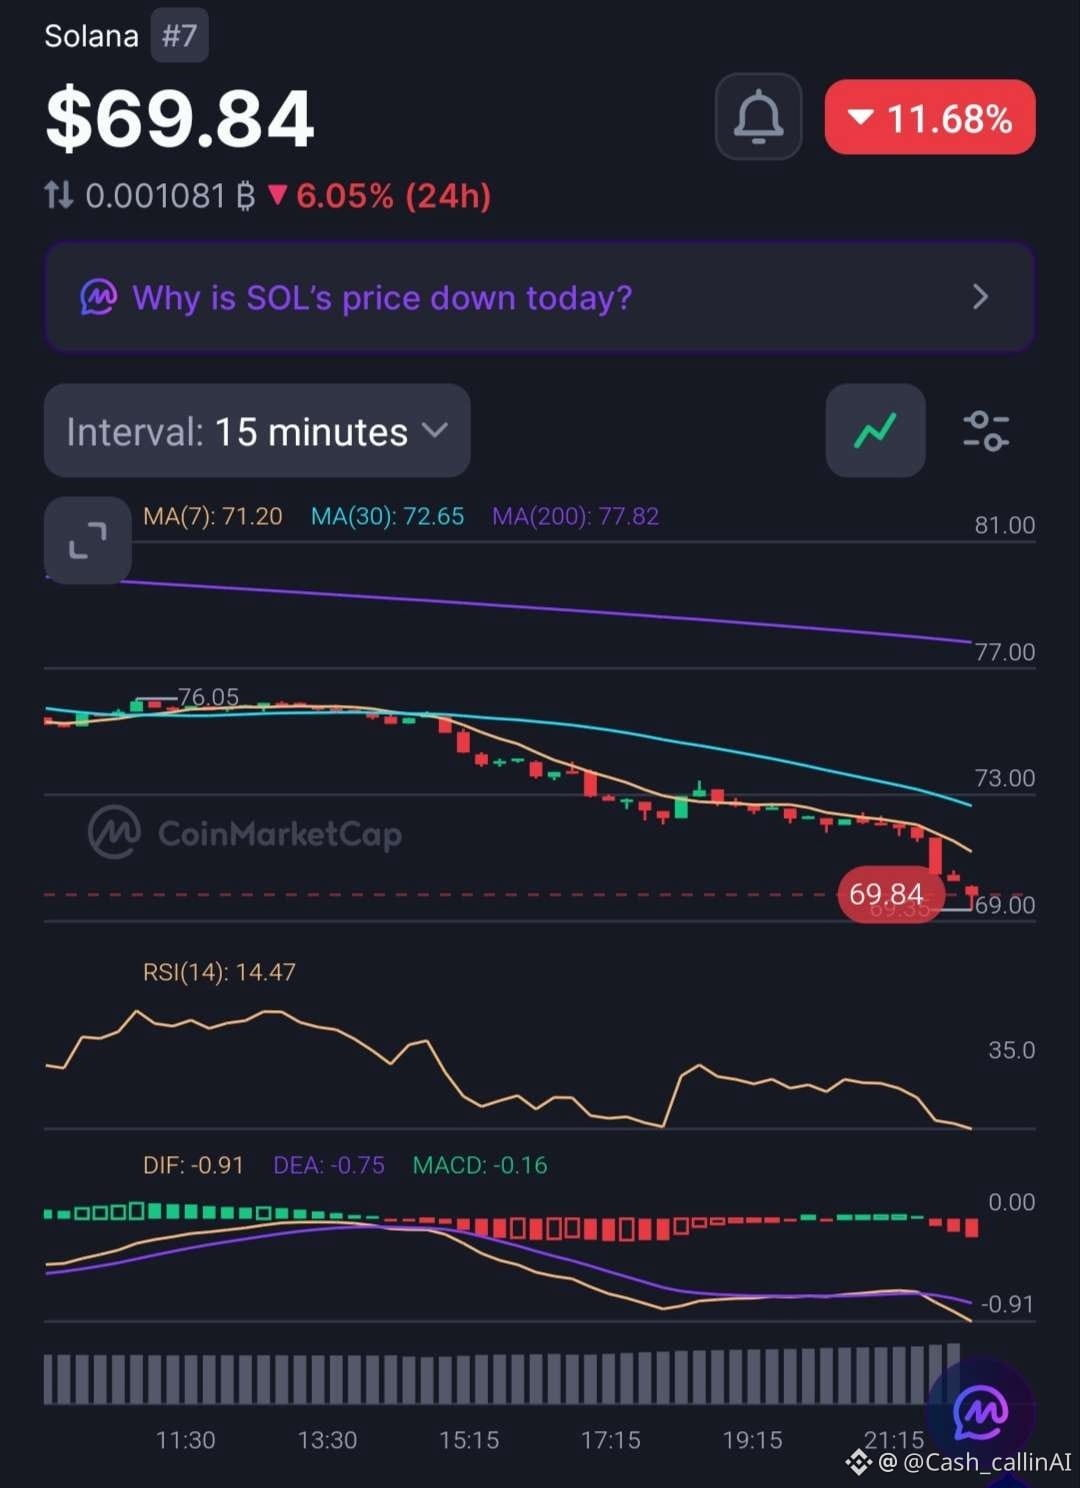
🚨 SOL CRASHES 11.68% — RSI FALLS TO 14.47. IS SELLING EXHAUSTION NEAR?
Solana ( $SOL), ranked #7, is trading around $69.83 after a sharp decline.
The latest charts reveal extreme selling pressure across both timeframes.
📊 1-HOUR CHART
• RSI: 15.36
• MACD histogram: -0.35
• MA(7): $71.95
• MA(30): $75.80
• MA(200): $84.19
📊 15-MINUTE CHART
• RSI: 14.47
• MACD histogram: -0.16
• MA(7): $71.20
• MA(30): $72.65
• MA(200): $77.82
🔍 WHAT STANDS OUT?
SOL is trading below all six moving-average references. Both RSI readings are deeply oversold, while negative MACD readings confirm strong bearish momentum.
Trading volume has increased 27.61% to $4.34B during the decline, showing heightened market activity.
Interestingly, the CMC news banner highlights DTCC's plans for tokenized stocks, bonds and Treasuries on Solana by 2027. Yet the immediate price action remains extremely weak.
📊 MARKET SNAPSHOT
• Market Cap: $41.49B
• 24H Volume: $4.34B (+27.61%)
• FDV: $44.72B
• YTD: -43.89%
📍 RECOVERY LEVELS TO WATCH
• $71.20–$71.95: Initial recovery zone.
• $72.65: 15M MA(30).
• $77.82: 15M MA(200).
• $84.19: 1H MA(200).
🔴 CASHCALLING™ BIAS: BEARISH.
Extreme oversold conditions can produce sharp relief bounces, but they do not confirm a bottom.
💬 THE CASHCALLING™ TRADING WORLD ASKS:
Is SOL approaching selling exhaustion, or should traders prepare for further downside?
🟢 Relief bounce?
🔴 Continued sell-off?
⚖️ Extended consolidation?
Explain your reasoning. Let's discuss the market structure, not just the price movement.
🌍 Welcome to the CashCalling™ Trading World.
CashCalling™ | Levels, not slogans.
🚨 SOL CRASHES 11.68% — RSI FALLS TO 14.47. IS SELLING EXHAUSTION NEAR?
Solana ( $SOL), ranked #7, is trading around $69.83 after a sharp decline.
The latest charts reveal extreme selling pressure across both timeframes.
📊 1-HOUR CHART
• RSI: 15.36
• MACD histogram: -0.35
• MA(7): $71.95
• MA(30): $75.80
• MA(200): $84.19
📊 15-MINUTE CHART
• RSI: 14.47
• MACD histogram: -0.16
• MA(7): $71.20
• MA(30): $72.65
• MA(200): $77.82
🔍 WHAT STANDS OUT?
SOL is trading below all six moving-average references. Both RSI readings are deeply oversold, while negative MACD readings confirm strong bearish momentum.
Trading volume has increased 27.61% to $4.34B during the decline, showing heightened market activity.
Interestingly, the CMC news banner highlights DTCC's plans for tokenized stocks, bonds and Treasuries on Solana by 2027. Yet the immediate price action remains extremely weak.
📊 MARKET SNAPSHOT
• Market Cap: $41.49B
• 24H Volume: $4.34B (+27.61%)
• FDV: $44.72B
• YTD: -43.89%
📍 RECOVERY LEVELS TO WATCH
• $71.20–$71.95: Initial recovery zone.
• $72.65: 15M MA(30).
• $77.82: 15M MA(200).
• $84.19: 1H MA(200).
🔴 CASHCALLING™ BIAS: BEARISH.
Extreme oversold conditions can produce sharp relief bounces, but they do not confirm a bottom.
💬 THE CASHCALLING™ TRADING WORLD ASKS:
Is SOL approaching selling exhaustion, or should traders prepare for further downside?
🟢 Relief bounce?
🔴 Continued sell-off?
⚖️ Extended consolidation?
Explain your reasoning. Let's discuss the market structure, not just the price movement.
🌍 Welcome to the CashCalling™ Trading World.
CashCalling™ | Levels, not slogans.
Solana ( $SOL), ranked #7, is trading around $69.83 after a sharp decline.
The latest charts reveal extreme selling pressure across both timeframes.
📊 1-HOUR CHART
• RSI: 15.36
• MACD histogram: -0.35
• MA(7): $71.95
• MA(30): $75.80
• MA(200): $84.19
📊 15-MINUTE CHART
• RSI: 14.47
• MACD histogram: -0.16
• MA(7): $71.20
• MA(30): $72.65
• MA(200): $77.82
🔍 WHAT STANDS OUT?
SOL is trading below all six moving-average references. Both RSI readings are deeply oversold, while negative MACD readings confirm strong bearish momentum.
Trading volume has increased 27.61% to $4.34B during the decline, showing heightened market activity.
Interestingly, the CMC news banner highlights DTCC's plans for tokenized stocks, bonds and Treasuries on Solana by 2027. Yet the immediate price action remains extremely weak.
📊 MARKET SNAPSHOT
• Market Cap: $41.49B
• 24H Volume: $4.34B (+27.61%)
• FDV: $44.72B
• YTD: -43.89%
📍 RECOVERY LEVELS TO WATCH
• $71.20–$71.95: Initial recovery zone.
• $72.65: 15M MA(30).
• $77.82: 15M MA(200).
• $84.19: 1H MA(200).
🔴 CASHCALLING™ BIAS: BEARISH.
Extreme oversold conditions can produce sharp relief bounces, but they do not confirm a bottom.
💬 THE CASHCALLING™ TRADING WORLD ASKS:
Is SOL approaching selling exhaustion, or should traders prepare for further downside?
🟢 Relief bounce?
🔴 Continued sell-off?
⚖️ Extended consolidation?
Explain your reasoning. Let's discuss the market structure, not just the price movement.
🌍 Welcome to the CashCalling™ Trading World.
CashCalling™ | Levels, not slogans.
27
Lihat terjemahan
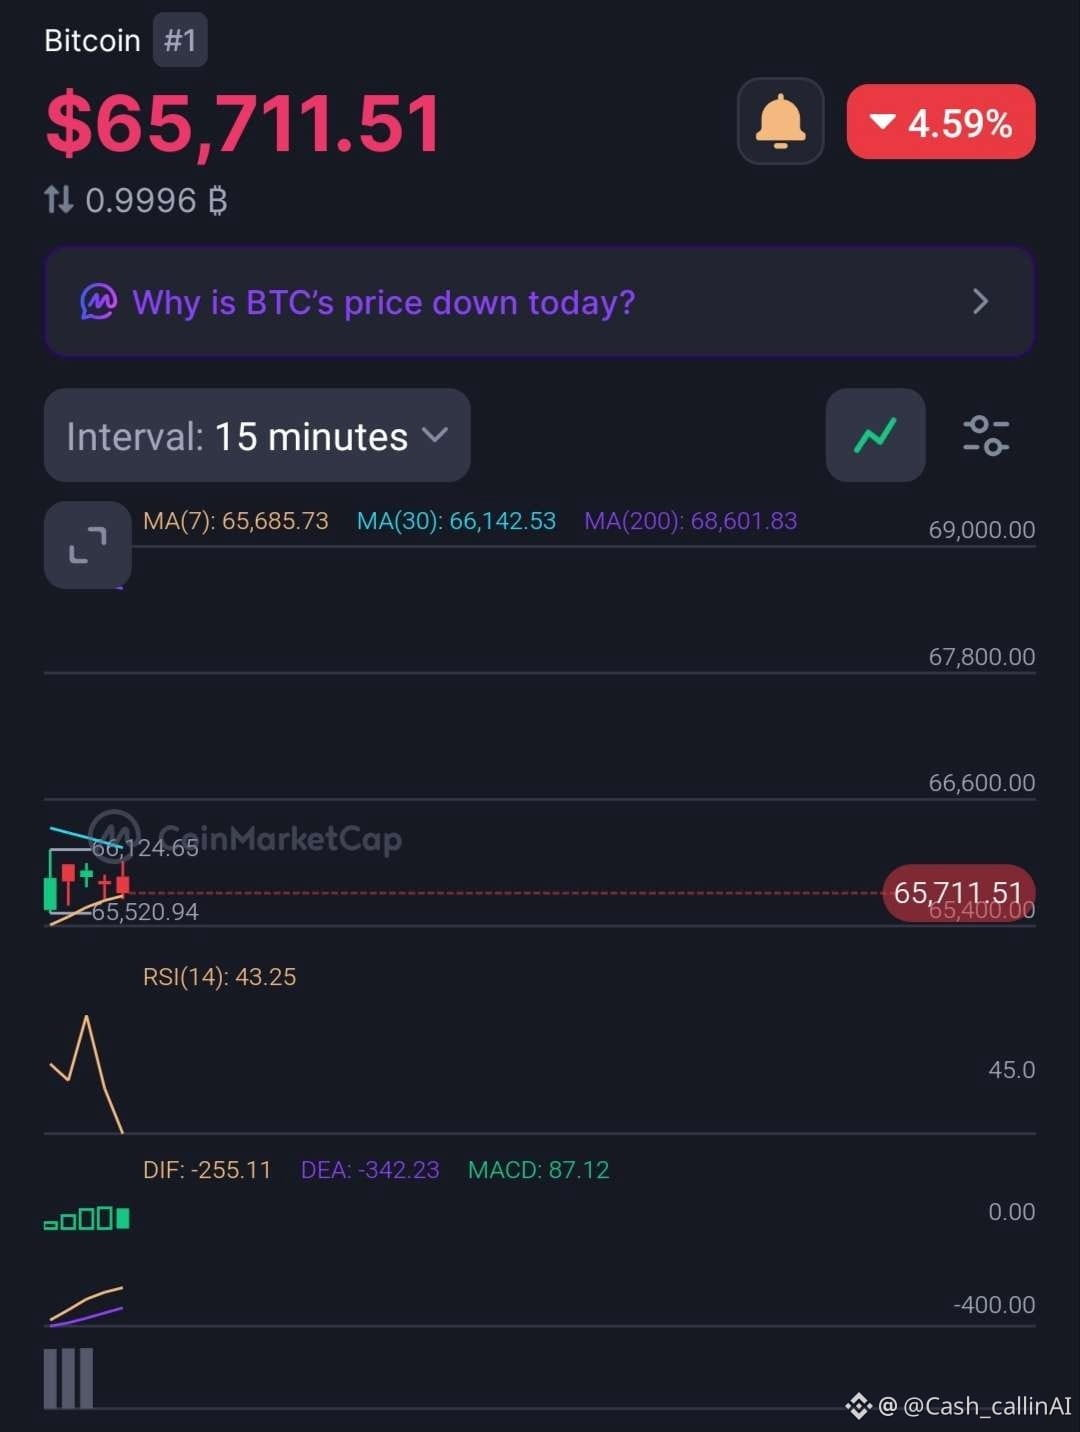
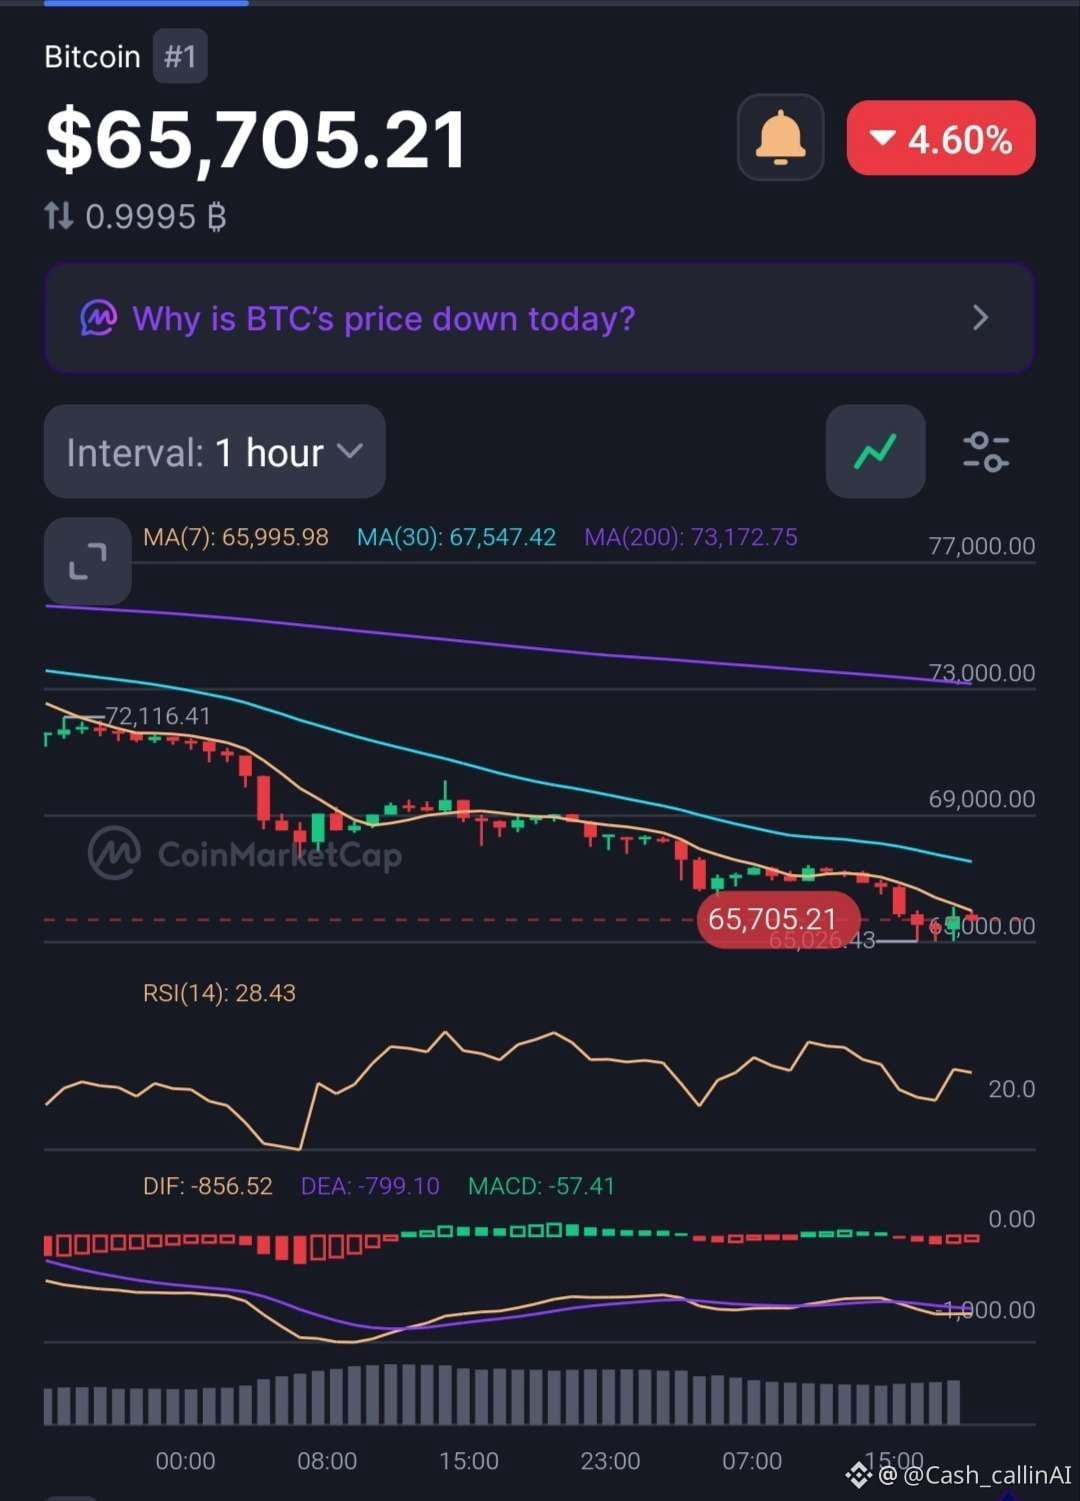
🚨 BITCOIN BELOW $66K — IS SELLING PRESSURE APPROACHING EXHAUSTION?
Bitcoin ( $BTC) trades around $65,711, down approximately 4.6%.
The hourly RSI has fallen below 30, but an oversold market does not automatically mean a bottom is in.
📊 1H CHART
• RSI: 28.43
• MACD histogram: -57.41
• MA(7): $65,995.98
• MA(30): $67,547.42
• MA(200): $73,172.75
📊 15M CHART
• RSI: 43.25
• MACD histogram: +87.12
• MA(7): $65,685.73
• MA(30): $66,142.53
• MA(200): $68,601.83
🔍 WHAT STANDS OUT?
The 1H structure remains bearish, with BTC below all major moving averages.
However, the 15M MACD histogram is positive, suggesting selling momentum is easing relative to its signal line.
This is an early stabilisation signal, not a confirmed reversal.
📍 LEVELS TO WATCH
• $65,028 — recent 1H low.
• $65,521 — recent 15M low.
• $66,142 — initial recovery hurdle.
• $67,547 — 1H MA(30).
📊 MARKET SNAPSHOT
• Market Cap: $1.32T
• 24H Volume: $34.64B (-19.48%)
• YTD: -24.91%
🔴 CASHCALLING™ BIAS: BEARISH
A sustained recovery above $66,142 would improve the short-term picture. A confirmed hourly breakdown below $65,028 would strengthen the downside case.
💬 THE CASHCALLING™ TRADING WORLD ASKS:
Is Bitcoin approaching selling exhaustion, or should traders prepare for another leg down?
🟢 Relief bounce?
🔴 Further downside?
⚖️ More consolidation?
Share your analysis. Let's discuss the levels, not just the candles.
🌍 Welcome to the CashCalling™ Trading World.
CashCalling™ | Levels, not slogans.niz
🚨 BITCOIN BELOW $66K — IS SELLING PRESSURE APPROACHING EXHAUSTION?
Bitcoin ( $BTC) trades around $65,711, down approximately 4.6%.
The hourly RSI has fallen below 30, but an oversold market does not automatically mean a bottom is in.
📊 1H CHART
• RSI: 28.43
• MACD histogram: -57.41
• MA(7): $65,995.98
• MA(30): $67,547.42
• MA(200): $73,172.75
📊 15M CHART
• RSI: 43.25
• MACD histogram: +87.12
• MA(7): $65,685.73
• MA(30): $66,142.53
• MA(200): $68,601.83
🔍 WHAT STANDS OUT?
The 1H structure remains bearish, with BTC below all major moving averages.
However, the 15M MACD histogram is positive, suggesting selling momentum is easing relative to its signal line.
This is an early stabilisation signal, not a confirmed reversal.
📍 LEVELS TO WATCH
• $65,028 — recent 1H low.
• $65,521 — recent 15M low.
• $66,142 — initial recovery hurdle.
• $67,547 — 1H MA(30).
📊 MARKET SNAPSHOT
• Market Cap: $1.32T
• 24H Volume: $34.64B (-19.48%)
• YTD: -24.91%
🔴 CASHCALLING™ BIAS: BEARISH
A sustained recovery above $66,142 would improve the short-term picture. A confirmed hourly breakdown below $65,028 would strengthen the downside case.
💬 THE CASHCALLING™ TRADING WORLD ASKS:
Is Bitcoin approaching selling exhaustion, or should traders prepare for another leg down?
🟢 Relief bounce?
🔴 Further downside?
⚖️ More consolidation?
Share your analysis. Let's discuss the levels, not just the candles.
🌍 Welcome to the CashCalling™ Trading World.
CashCalling™ | Levels, not slogans.niz
Bitcoin ( $BTC) trades around $65,711, down approximately 4.6%.
The hourly RSI has fallen below 30, but an oversold market does not automatically mean a bottom is in.
📊 1H CHART
• RSI: 28.43
• MACD histogram: -57.41
• MA(7): $65,995.98
• MA(30): $67,547.42
• MA(200): $73,172.75
📊 15M CHART
• RSI: 43.25
• MACD histogram: +87.12
• MA(7): $65,685.73
• MA(30): $66,142.53
• MA(200): $68,601.83
🔍 WHAT STANDS OUT?
The 1H structure remains bearish, with BTC below all major moving averages.
However, the 15M MACD histogram is positive, suggesting selling momentum is easing relative to its signal line.
This is an early stabilisation signal, not a confirmed reversal.
📍 LEVELS TO WATCH
• $65,028 — recent 1H low.
• $65,521 — recent 15M low.
• $66,142 — initial recovery hurdle.
• $67,547 — 1H MA(30).
📊 MARKET SNAPSHOT
• Market Cap: $1.32T
• 24H Volume: $34.64B (-19.48%)
• YTD: -24.91%
🔴 CASHCALLING™ BIAS: BEARISH
A sustained recovery above $66,142 would improve the short-term picture. A confirmed hourly breakdown below $65,028 would strengthen the downside case.
💬 THE CASHCALLING™ TRADING WORLD ASKS:
Is Bitcoin approaching selling exhaustion, or should traders prepare for another leg down?
🟢 Relief bounce?
🔴 Further downside?
⚖️ More consolidation?
Share your analysis. Let's discuss the levels, not just the candles.
🌍 Welcome to the CashCalling™ Trading World.
CashCalling™ | Levels, not slogans.niz
26
Lihat terjemahan
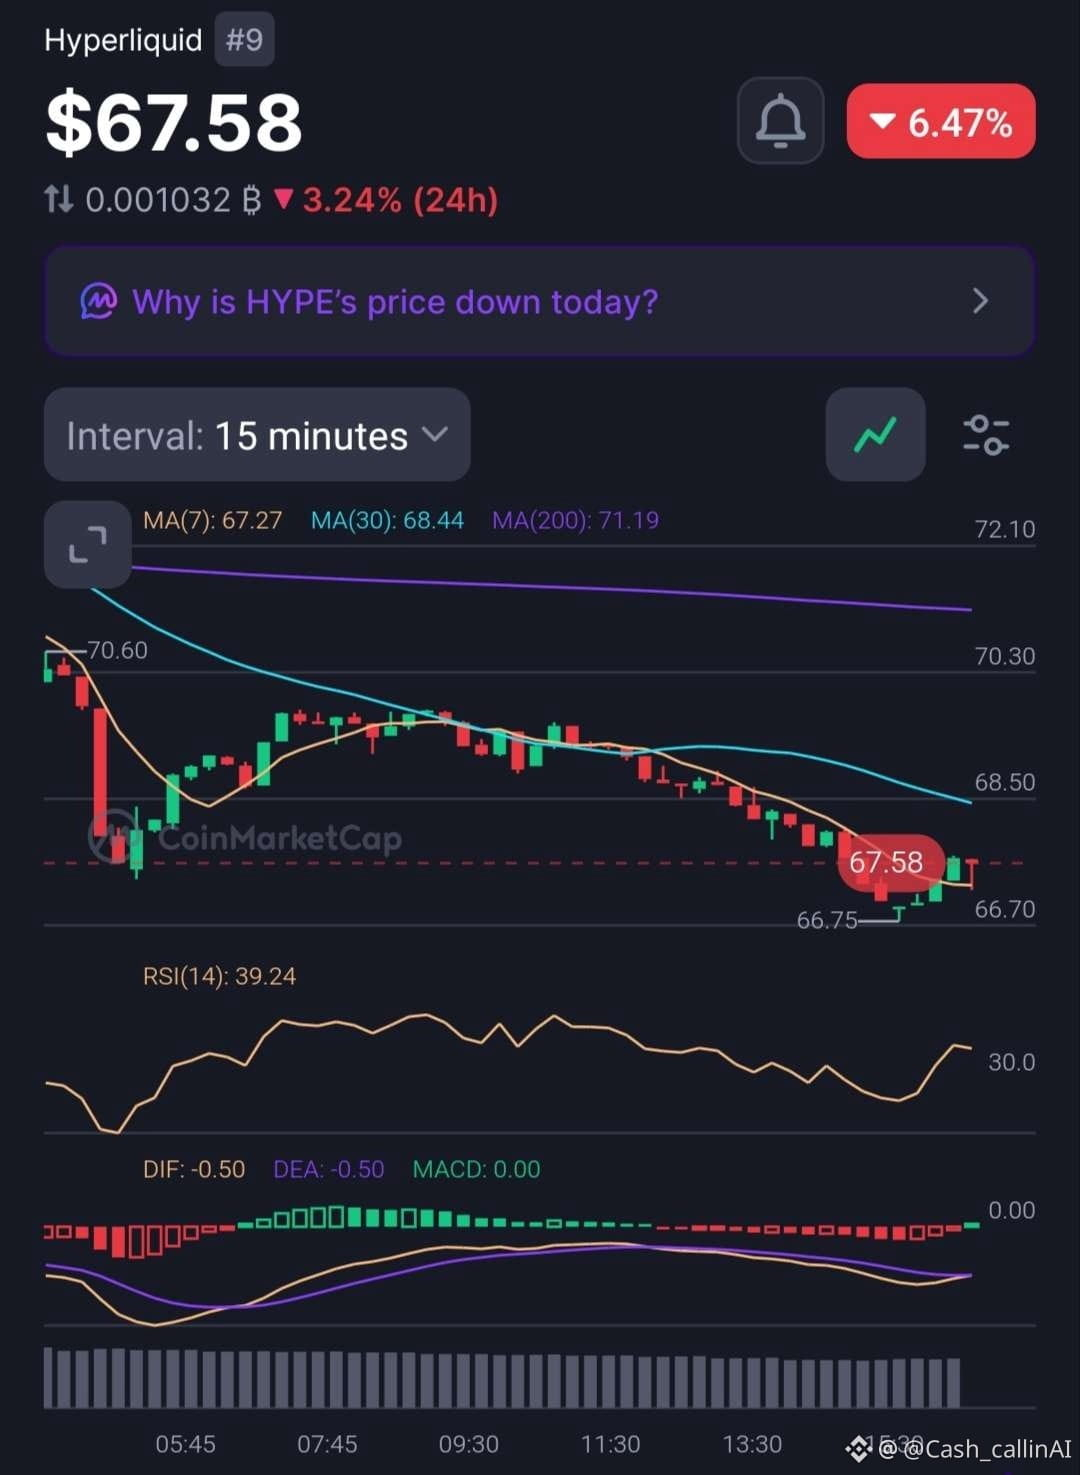
🚨 HYPE TESTS $66.70 SUPPORT — SELLING EXHAUSTION OR ANOTHER LEG DOWN?
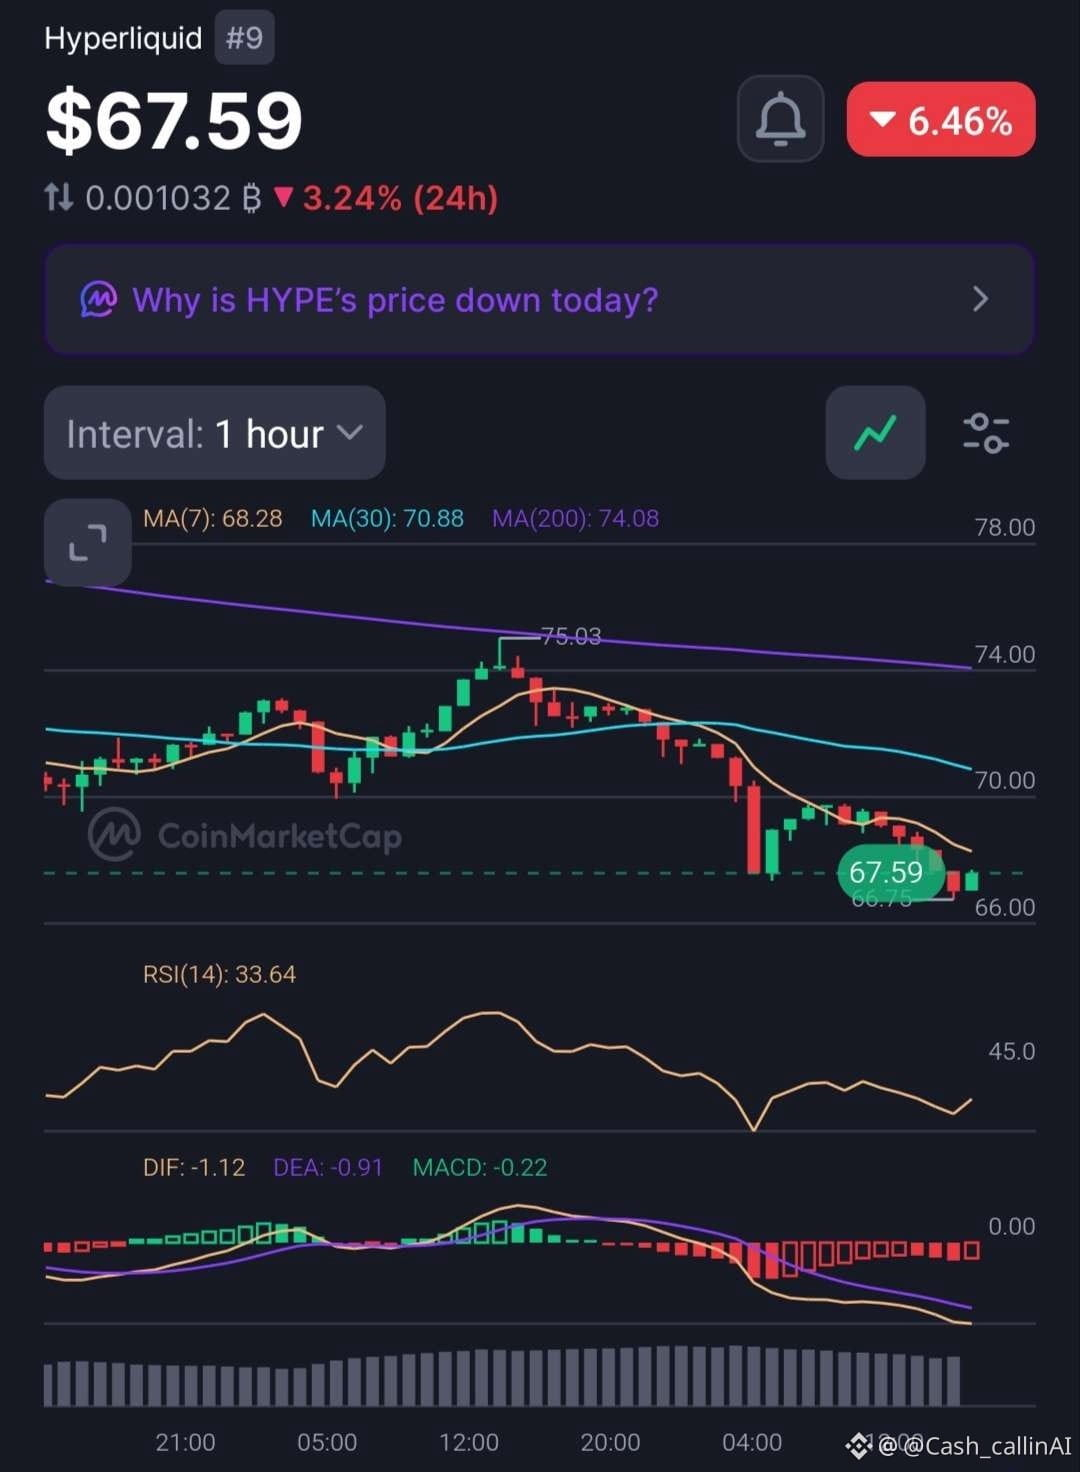
Hyperliquid ( $HYPE) is trading around $67.58, down approximately 6.47%. After falling from the $75.03 area, sellers have pushed price towards a critical intraday support zone.
But the latest charts show an interesting development.
📊 15-MINUTE CHART
• RSI: 39.24
• MACD histogram: 0.00
• MA(7): $67.27
• MA(30): $68.44
• MA(200): $71.19
📊 1-HOUR CHART
• RSI: 33.64
• MACD histogram: -0.22
• MA(7): $68.28
• MA(30): $70.88
• MA(200): $74.08
🔍 WHAT STANDS OUT?
Both timeframes maintain bearish moving-average alignment. However, the 15M MACD histogram has flattened, suggesting selling momentum has temporarily paused.
The hourly MACD remains negative, and RSI at 33.64 confirms continued weakness.
📍 LEVELS THAT MATTER
🔴 $66.70–$66.75: Critical support.
🟡 $68.28–$68.45: First recovery resistance.
🟠 $70.88–$71.20: Trend repair zone.
🔵 $74.08: 1H MA(200).
CASHCALLING™ BIAS: BEARISH.
A sustained hold above $66.70 could encourage a relief bounce. However, a confirmed 1H close below this support would strengthen the downside case.
💬 THE BIG QUESTION:
Will buyers defend $66.70, or is HYPE preparing for another downward move?
🟢 Support holds and recovery begins.
🔴 Support breaks and sellers regain momentum.
Share your reasoning. Let's discuss the levels, not just the candles.
CashCalling™ | Levels, not slogans.
🚨 HYPE TESTS $66.70 SUPPORT — SELLING EXHAUSTION OR ANOTHER LEG DOWN?
Hyperliquid ( $HYPE) is trading around $67.58, down approximately 6.47%. After falling from the $75.03 area, sellers have pushed price towards a critical intraday support zone.
But the latest charts show an interesting development.
📊 15-MINUTE CHART
• RSI: 39.24
• MACD histogram: 0.00
• MA(7): $67.27
• MA(30): $68.44
• MA(200): $71.19
📊 1-HOUR CHART
• RSI: 33.64
• MACD histogram: -0.22
• MA(7): $68.28
• MA(30): $70.88
• MA(200): $74.08
🔍 WHAT STANDS OUT?
Both timeframes maintain bearish moving-average alignment. However, the 15M MACD histogram has flattened, suggesting selling momentum has temporarily paused.
The hourly MACD remains negative, and RSI at 33.64 confirms continued weakness.
📍 LEVELS THAT MATTER
🔴 $66.70–$66.75: Critical support.
🟡 $68.28–$68.45: First recovery resistance.
🟠 $70.88–$71.20: Trend repair zone.
🔵 $74.08: 1H MA(200).
CASHCALLING™ BIAS: BEARISH.
A sustained hold above $66.70 could encourage a relief bounce. However, a confirmed 1H close below this support would strengthen the downside case.
💬 THE BIG QUESTION:
Will buyers defend $66.70, or is HYPE preparing for another downward move?
🟢 Support holds and recovery begins.
🔴 Support breaks and sellers regain momentum.
Share your reasoning. Let's discuss the levels, not just the candles.
CashCalling™ | Levels, not slogans.
Hyperliquid ( $HYPE) is trading around $67.58, down approximately 6.47%. After falling from the $75.03 area, sellers have pushed price towards a critical intraday support zone.
But the latest charts show an interesting development.
📊 15-MINUTE CHART
• RSI: 39.24
• MACD histogram: 0.00
• MA(7): $67.27
• MA(30): $68.44
• MA(200): $71.19
📊 1-HOUR CHART
• RSI: 33.64
• MACD histogram: -0.22
• MA(7): $68.28
• MA(30): $70.88
• MA(200): $74.08
🔍 WHAT STANDS OUT?
Both timeframes maintain bearish moving-average alignment. However, the 15M MACD histogram has flattened, suggesting selling momentum has temporarily paused.
The hourly MACD remains negative, and RSI at 33.64 confirms continued weakness.
📍 LEVELS THAT MATTER
🔴 $66.70–$66.75: Critical support.
🟡 $68.28–$68.45: First recovery resistance.
🟠 $70.88–$71.20: Trend repair zone.
🔵 $74.08: 1H MA(200).
CASHCALLING™ BIAS: BEARISH.
A sustained hold above $66.70 could encourage a relief bounce. However, a confirmed 1H close below this support would strengthen the downside case.
💬 THE BIG QUESTION:
Will buyers defend $66.70, or is HYPE preparing for another downward move?
🟢 Support holds and recovery begins.
🔴 Support breaks and sellers regain momentum.
Share your reasoning. Let's discuss the levels, not just the candles.
CashCalling™ | Levels, not slogans.
37
Lihat terjemahan
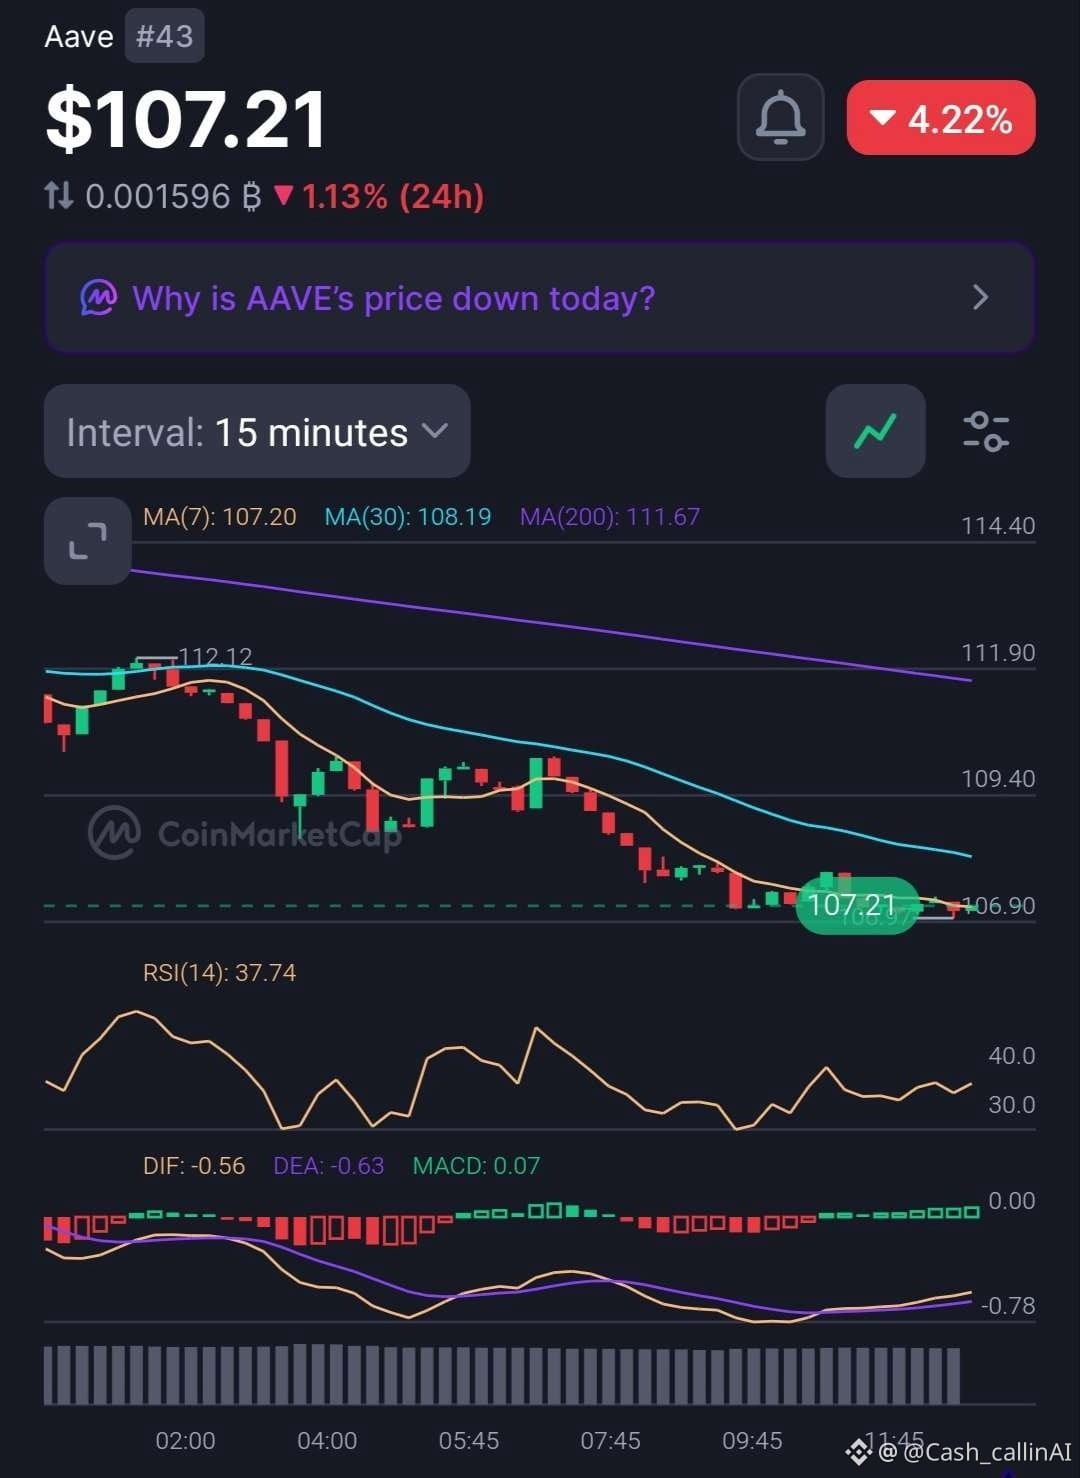
🚨 AAVE DROPS OVER 4% — ARE BUYERS PREPARING A RECOVERY?
Aave ( $AAVE), ranked #43, is trading around $107.21, down 4.22% in the latest market snapshot.
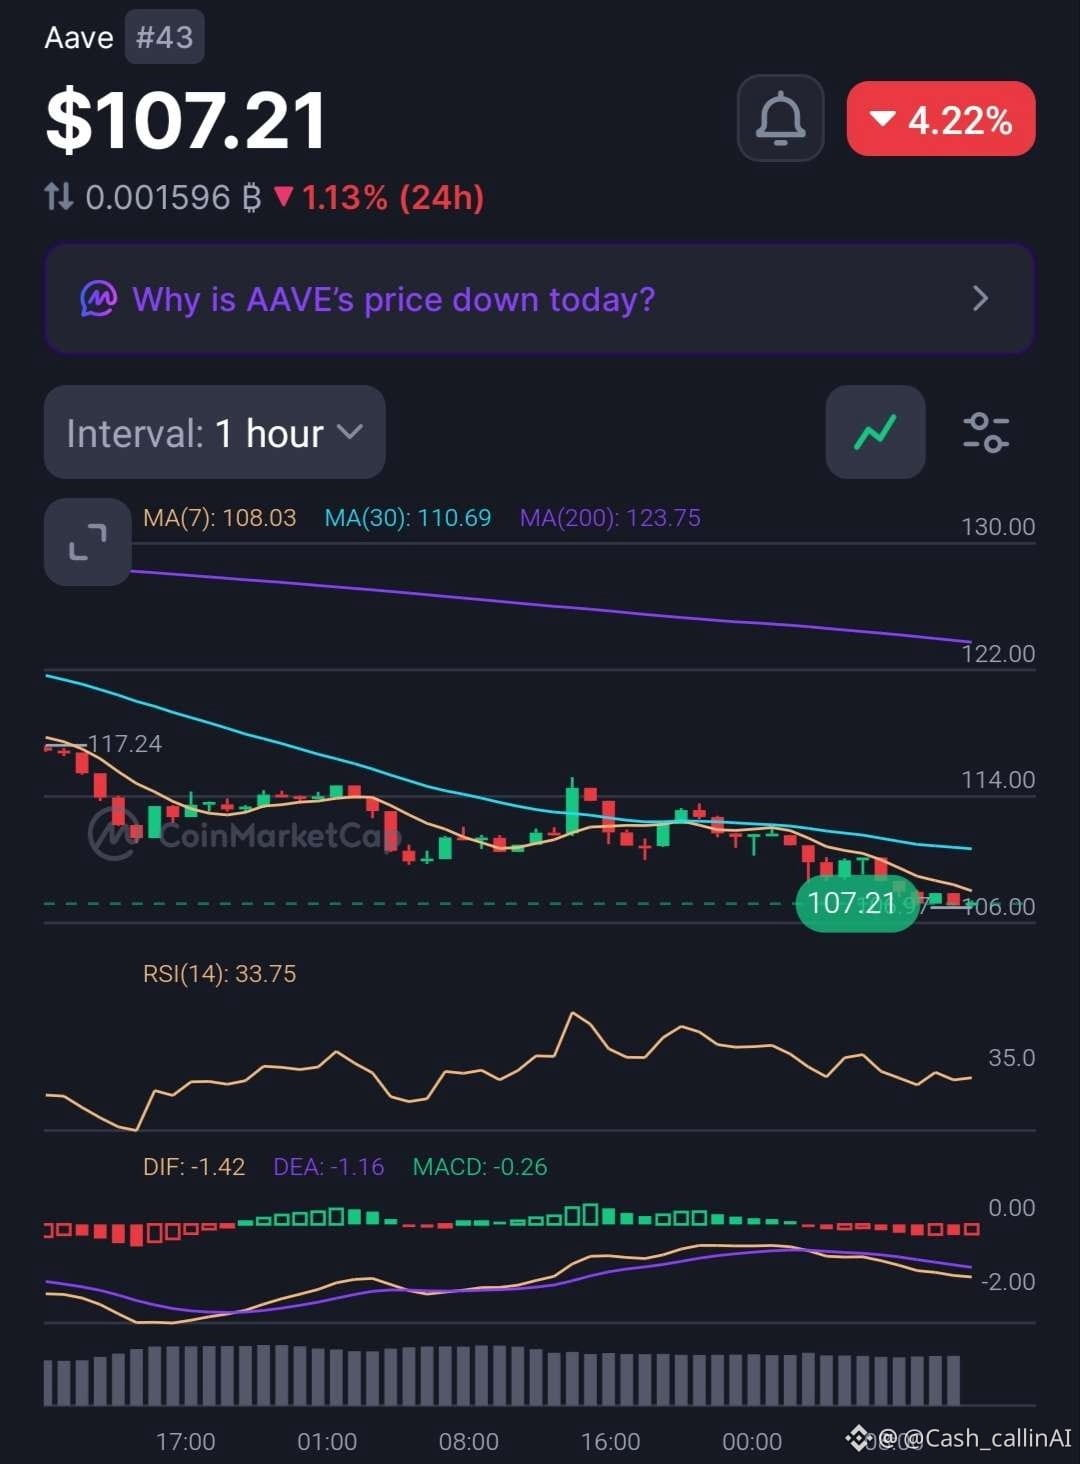
Both timeframes remain weak, but there's a small change in short-term momentum worth watching.
📊 15-MINUTE CHART
• RSI: 37.74
• MACD histogram: +0.07
• MA(7): $107.20
• MA(30): $108.19
• MA(200): $111.67
📊 1-HOUR CHART
• RSI: 33.75
• MACD histogram: -0.26
• MA(7): $108.03
• MA(30): $110.69
• MA(200): $123.75
🔍 WHAT STANDS OUT?
AAVE is trading below most major moving-average references. The hourly RSI at 33.75 reflects significant selling pressure.
However, the 15M MACD histogram has turned slightly positive at +0.07, suggesting an early improvement in momentum. Both MACD lines remain negative, so this is not a confirmed reversal.
📊 MARKET SNAPSHOT
• Market Cap: $1.65B
• 24H Volume: $206.68M
• FDV: $1.71B
• YTD: -26.62%
📍 LEVELS TO WATCH
• $108.03–$108.19: Initial recovery zone.
• $110.69: 1H MA(30).
• $111.67: 15M MA(200).
• $123.75: Major 1H MA(200).
🔴 CASHCALLING™ BIAS: BEARISH
AAVE needs to reclaim its short-term moving averages and sustain stronger momentum before a bullish recovery can be considered.
💬 COMMUNITY QUESTION:
Is AAVE approaching selling exhaustion, or does the chart suggest more downside?
🟢 Early recovery?
🔴 Continued selling pressure?
⚖️ More consolidation?
Share your reasoning. Let's discuss the chart, not just the candles.
CashCalling™ | Levels, not slogans.
🚨 AAVE DROPS OVER 4% — ARE BUYERS PREPARING A RECOVERY?
Aave ( $AAVE), ranked #43, is trading around $107.21, down 4.22% in the latest market snapshot.
Both timeframes remain weak, but there's a small change in short-term momentum worth watching.
📊 15-MINUTE CHART
• RSI: 37.74
• MACD histogram: +0.07
• MA(7): $107.20
• MA(30): $108.19
• MA(200): $111.67
📊 1-HOUR CHART
• RSI: 33.75
• MACD histogram: -0.26
• MA(7): $108.03
• MA(30): $110.69
• MA(200): $123.75
🔍 WHAT STANDS OUT?
AAVE is trading below most major moving-average references. The hourly RSI at 33.75 reflects significant selling pressure.
However, the 15M MACD histogram has turned slightly positive at +0.07, suggesting an early improvement in momentum. Both MACD lines remain negative, so this is not a confirmed reversal.
📊 MARKET SNAPSHOT
• Market Cap: $1.65B
• 24H Volume: $206.68M
• FDV: $1.71B
• YTD: -26.62%
📍 LEVELS TO WATCH
• $108.03–$108.19: Initial recovery zone.
• $110.69: 1H MA(30).
• $111.67: 15M MA(200).
• $123.75: Major 1H MA(200).
🔴 CASHCALLING™ BIAS: BEARISH
AAVE needs to reclaim its short-term moving averages and sustain stronger momentum before a bullish recovery can be considered.
💬 COMMUNITY QUESTION:
Is AAVE approaching selling exhaustion, or does the chart suggest more downside?
🟢 Early recovery?
🔴 Continued selling pressure?
⚖️ More consolidation?
Share your reasoning. Let's discuss the chart, not just the candles.
CashCalling™ | Levels, not slogans.
Aave ( $AAVE), ranked #43, is trading around $107.21, down 4.22% in the latest market snapshot.
Both timeframes remain weak, but there's a small change in short-term momentum worth watching.
📊 15-MINUTE CHART
• RSI: 37.74
• MACD histogram: +0.07
• MA(7): $107.20
• MA(30): $108.19
• MA(200): $111.67
📊 1-HOUR CHART
• RSI: 33.75
• MACD histogram: -0.26
• MA(7): $108.03
• MA(30): $110.69
• MA(200): $123.75
🔍 WHAT STANDS OUT?
AAVE is trading below most major moving-average references. The hourly RSI at 33.75 reflects significant selling pressure.
However, the 15M MACD histogram has turned slightly positive at +0.07, suggesting an early improvement in momentum. Both MACD lines remain negative, so this is not a confirmed reversal.
📊 MARKET SNAPSHOT
• Market Cap: $1.65B
• 24H Volume: $206.68M
• FDV: $1.71B
• YTD: -26.62%
📍 LEVELS TO WATCH
• $108.03–$108.19: Initial recovery zone.
• $110.69: 1H MA(30).
• $111.67: 15M MA(200).
• $123.75: Major 1H MA(200).
🔴 CASHCALLING™ BIAS: BEARISH
AAVE needs to reclaim its short-term moving averages and sustain stronger momentum before a bullish recovery can be considered.
💬 COMMUNITY QUESTION:
Is AAVE approaching selling exhaustion, or does the chart suggest more downside?
🟢 Early recovery?
🔴 Continued selling pressure?
⚖️ More consolidation?
Share your reasoning. Let's discuss the chart, not just the candles.
CashCalling™ | Levels, not slogans.
70
Lihat terjemahan
🚨 HYPE IS FALLING AGAINST USD BUT OUTPERFORMING BTC. IS RELATIVE STRENGTH DEVELOPING?
Hyperliquid ( $HYPE) is trading around $71.47, down 1.79% against USD over 24 hours. Interestingly, its BTC pair is up 1.73%.
That divergence deserves attention.
📊 15-MINUTE CHART
• RSI: 37.70
• MACD histogram: +0.01
• MA(7): $71.62
• MA(30): $72.21
• MA(200): $71.90
📊 1-HOUR CHART
• RSI: 41.32
• MACD histogram: -0.21
• MA(7): $72.06
• MA(30): $72.34
• MA(200): $74.70
🔍 WHAT STANDS OUT?
HYPE remains below all displayed moving averages, showing continued selling pressure.
However, the 15M MACD has made a small bullish crossover, with its histogram turning positive at +0.01. This suggests a possible pause in selling, not a confirmed reversal.
The hourly MACD remains negative, while RSI at 41.32 reflects weak momentum.
📊 MARKET SNAPSHOT
• Market Cap: $18.06B
• 24H Volume: $1.19B
• FDV: $67.86B
• YTD Performance: +181%
📍 LEVELS TO WATCH
• $71.12 — recent 15M low.
• $71.90–$72.21 — short-term recovery zone.
• $72.34 — 1H MA(30).
• $74.70 — major 1H MA(200).
🔴 CASHCALLING™ BIAS: BEARISH, WITH EARLY STABILISATION SIGNALS.
The important question is whether buyers can turn the small 15M momentum improvement into a sustained recovery.
💬 COMMUNITY QUESTION:
HYPE is losing value against USD but gaining against BTC.
Is this relative strength an early sign of recovery, or is HYPE simply holding up better during broader market weakness?
Share your analysis. Let's discuss the structure, not just the candles.
CashCalling™ | Levels, not slogans.
🚨 HYPE IS FALLING AGAINST USD BUT OUTPERFORMING BTC. IS RELATIVE STRENGTH DEVELOPING?
Hyperliquid ( $HYPE) is trading around $71.47, down 1.79% against USD over 24 hours. Interestingly, its BTC pair is up 1.73%.
That divergence deserves attention.
📊 15-MINUTE CHART
• RSI: 37.70
• MACD histogram: +0.01
• MA(7): $71.62
• MA(30): $72.21
• MA(200): $71.90
📊 1-HOUR CHART
• RSI: 41.32
• MACD histogram: -0.21
• MA(7): $72.06
• MA(30): $72.34
• MA(200): $74.70
🔍 WHAT STANDS OUT?
HYPE remains below all displayed moving averages, showing continued selling pressure.
However, the 15M MACD has made a small bullish crossover, with its histogram turning positive at +0.01. This suggests a possible pause in selling, not a confirmed reversal.
The hourly MACD remains negative, while RSI at 41.32 reflects weak momentum.
📊 MARKET SNAPSHOT
• Market Cap: $18.06B
• 24H Volume: $1.19B
• FDV: $67.86B
• YTD Performance: +181%
📍 LEVELS TO WATCH
• $71.12 — recent 15M low.
• $71.90–$72.21 — short-term recovery zone.
• $72.34 — 1H MA(30).
• $74.70 — major 1H MA(200).
🔴 CASHCALLING™ BIAS: BEARISH, WITH EARLY STABILISATION SIGNALS.
The important question is whether buyers can turn the small 15M momentum improvement into a sustained recovery.
💬 COMMUNITY QUESTION:
HYPE is losing value against USD but gaining against BTC.
Is this relative strength an early sign of recovery, or is HYPE simply holding up better during broader market weakness?
Share your analysis. Let's discuss the structure, not just the candles.
CashCalling™ | Levels, not slogans.
Hyperliquid ( $HYPE) is trading around $71.47, down 1.79% against USD over 24 hours. Interestingly, its BTC pair is up 1.73%.
That divergence deserves attention.
📊 15-MINUTE CHART
• RSI: 37.70
• MACD histogram: +0.01
• MA(7): $71.62
• MA(30): $72.21
• MA(200): $71.90
📊 1-HOUR CHART
• RSI: 41.32
• MACD histogram: -0.21
• MA(7): $72.06
• MA(30): $72.34
• MA(200): $74.70
🔍 WHAT STANDS OUT?
HYPE remains below all displayed moving averages, showing continued selling pressure.
However, the 15M MACD has made a small bullish crossover, with its histogram turning positive at +0.01. This suggests a possible pause in selling, not a confirmed reversal.
The hourly MACD remains negative, while RSI at 41.32 reflects weak momentum.
📊 MARKET SNAPSHOT
• Market Cap: $18.06B
• 24H Volume: $1.19B
• FDV: $67.86B
• YTD Performance: +181%
📍 LEVELS TO WATCH
• $71.12 — recent 15M low.
• $71.90–$72.21 — short-term recovery zone.
• $72.34 — 1H MA(30).
• $74.70 — major 1H MA(200).
🔴 CASHCALLING™ BIAS: BEARISH, WITH EARLY STABILISATION SIGNALS.
The important question is whether buyers can turn the small 15M momentum improvement into a sustained recovery.
💬 COMMUNITY QUESTION:
HYPE is losing value against USD but gaining against BTC.
Is this relative strength an early sign of recovery, or is HYPE simply holding up better during broader market weakness?
Share your analysis. Let's discuss the structure, not just the candles.
CashCalling™ | Levels, not slogans.
57
Lihat terjemahan
🚨 SOL IS DOWN AGAINST USD BUT GAINING AGAINST BTC. WHAT IS THE MARKET TELLING US?
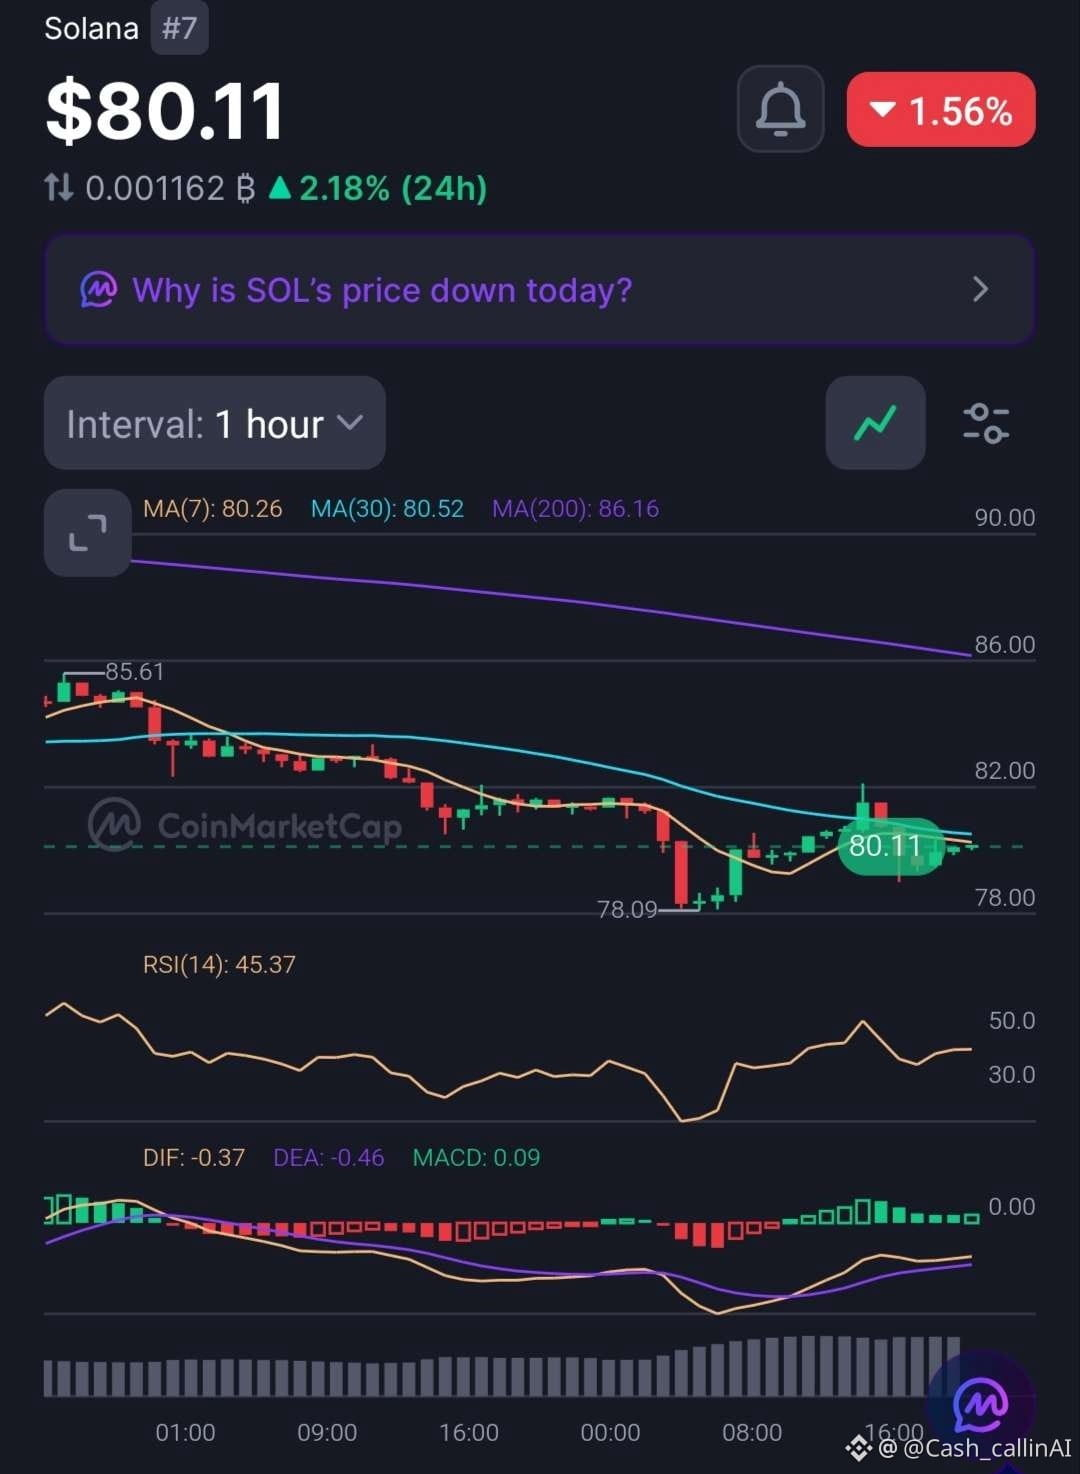
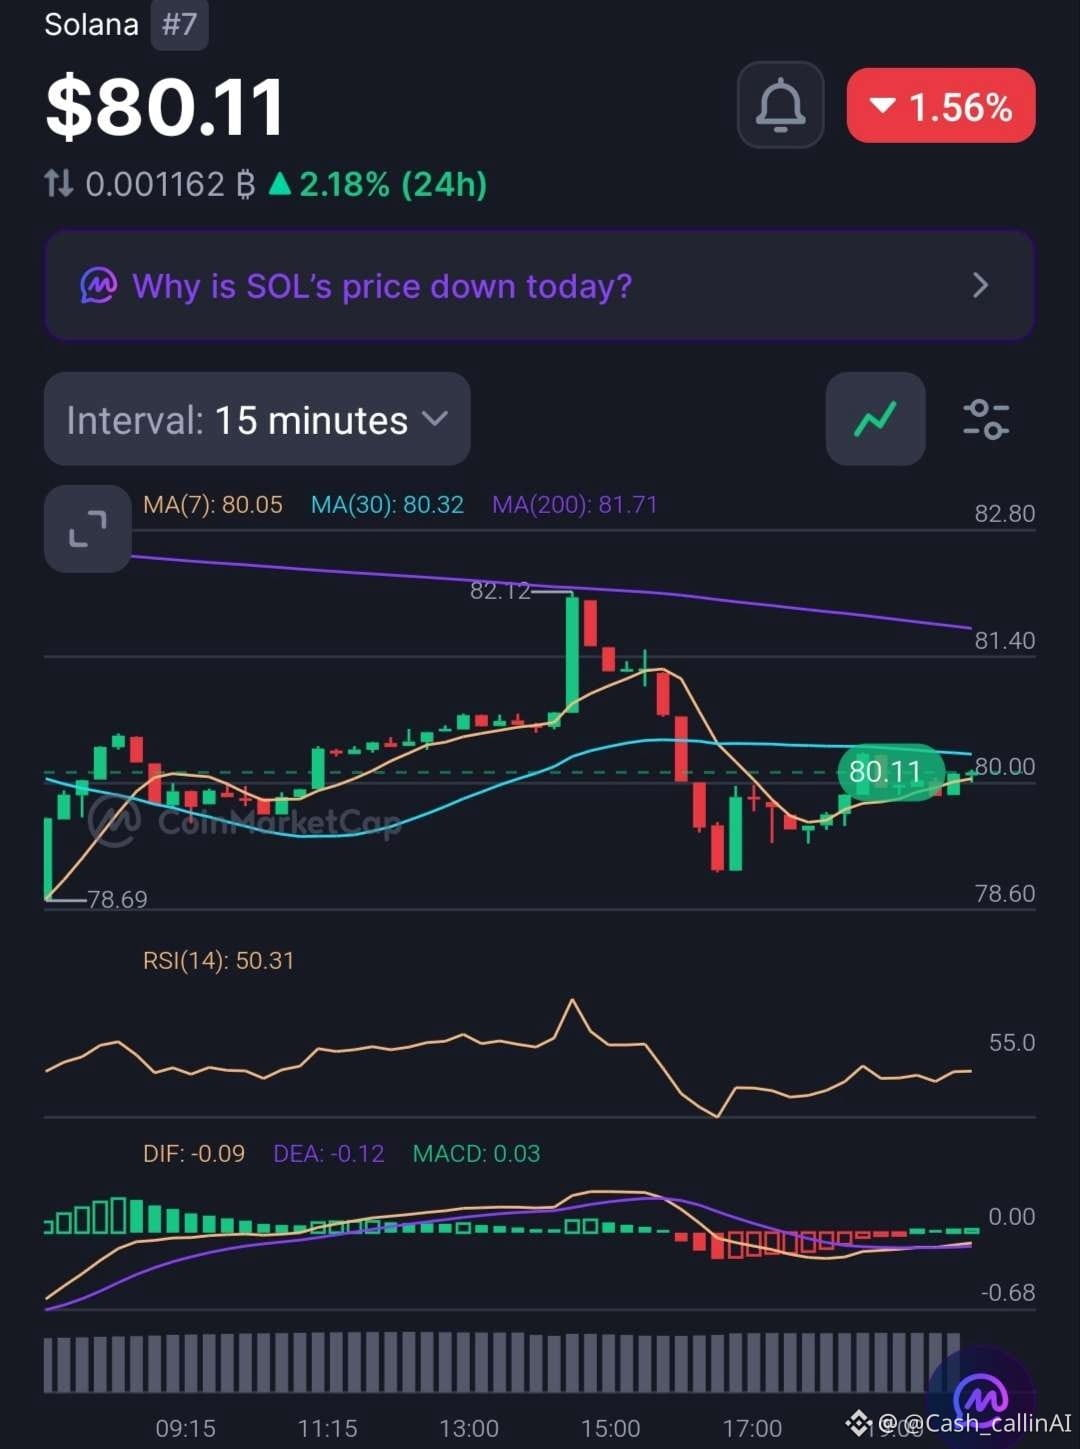
Solana ( $SOL) trades around $80.11, down 1.56% against USD over 24 hours. Interestingly, its BTC pair is up 2.18%.
That's a divergence worth watching.
📊 1-HOUR CHART
• RSI: 45.37
• MACD histogram: +0.09
• MA(7): $80.26
• MA(30): $80.52
• MA(200): $86.16
📊 15-MINUTE CHART
• RSI: 50.31
• MACD histogram: +0.03
• MA(7): $80.05
• MA(30): $80.32
• MA(200): $81.71
🔍 WHAT STANDS OUT?
Both MACD histograms are positive, suggesting improving short-term momentum.
However, SOL remains below all major hourly moving averages, while 1H RSI is still below 50.
24H trading volume has also increased 54.07% to $3.48B.
Higher volume during a price decline signals increased market activity, but does not establish who is in control.
📍 LEVELS TO WATCH
• $78.09–$78.69: Recent chart lows.
• $80.32–$80.52: Initial recovery zone.
• $81.71: 15M MA(200).
• $86.16: 1H MA(200).
🔴 CASHCALLING™ BIAS: BEARISH, WITH SHORT-TERM STABILISATION.
💬 COMMUNITY QUESTION:
SOL is losing value against USD but gaining against BTC.
Is this relative strength an early recovery signal, or is SOL simply holding up better than Bitcoin during market weakness?
Share your analysis.
CashCalling™ | Levels, not slogans.
🚨 SOL IS DOWN AGAINST USD BUT GAINING AGAINST BTC. WHAT IS THE MARKET TELLING US?
Solana ( $SOL) trades around $80.11, down 1.56% against USD over 24 hours. Interestingly, its BTC pair is up 2.18%.
That's a divergence worth watching.
📊 1-HOUR CHART
• RSI: 45.37
• MACD histogram: +0.09
• MA(7): $80.26
• MA(30): $80.52
• MA(200): $86.16
📊 15-MINUTE CHART
• RSI: 50.31
• MACD histogram: +0.03
• MA(7): $80.05
• MA(30): $80.32
• MA(200): $81.71
🔍 WHAT STANDS OUT?
Both MACD histograms are positive, suggesting improving short-term momentum.
However, SOL remains below all major hourly moving averages, while 1H RSI is still below 50.
24H trading volume has also increased 54.07% to $3.48B.
Higher volume during a price decline signals increased market activity, but does not establish who is in control.
📍 LEVELS TO WATCH
• $78.09–$78.69: Recent chart lows.
• $80.32–$80.52: Initial recovery zone.
• $81.71: 15M MA(200).
• $86.16: 1H MA(200).
🔴 CASHCALLING™ BIAS: BEARISH, WITH SHORT-TERM STABILISATION.
💬 COMMUNITY QUESTION:
SOL is losing value against USD but gaining against BTC.
Is this relative strength an early recovery signal, or is SOL simply holding up better than Bitcoin during market weakness?
Share your analysis.
CashCalling™ | Levels, not slogans.
Solana ( $SOL) trades around $80.11, down 1.56% against USD over 24 hours. Interestingly, its BTC pair is up 2.18%.
That's a divergence worth watching.
📊 1-HOUR CHART
• RSI: 45.37
• MACD histogram: +0.09
• MA(7): $80.26
• MA(30): $80.52
• MA(200): $86.16
📊 15-MINUTE CHART
• RSI: 50.31
• MACD histogram: +0.03
• MA(7): $80.05
• MA(30): $80.32
• MA(200): $81.71
🔍 WHAT STANDS OUT?
Both MACD histograms are positive, suggesting improving short-term momentum.
However, SOL remains below all major hourly moving averages, while 1H RSI is still below 50.
24H trading volume has also increased 54.07% to $3.48B.
Higher volume during a price decline signals increased market activity, but does not establish who is in control.
📍 LEVELS TO WATCH
• $78.09–$78.69: Recent chart lows.
• $80.32–$80.52: Initial recovery zone.
• $81.71: 15M MA(200).
• $86.16: 1H MA(200).
🔴 CASHCALLING™ BIAS: BEARISH, WITH SHORT-TERM STABILISATION.
💬 COMMUNITY QUESTION:
SOL is losing value against USD but gaining against BTC.
Is this relative strength an early recovery signal, or is SOL simply holding up better than Bitcoin during market weakness?
Share your analysis.
CashCalling™ | Levels, not slogans.
44
Lihat terjemahan
🚨 ETH DROPS OVER 5% — IS SELLING PRESSURE FINALLY EASING?
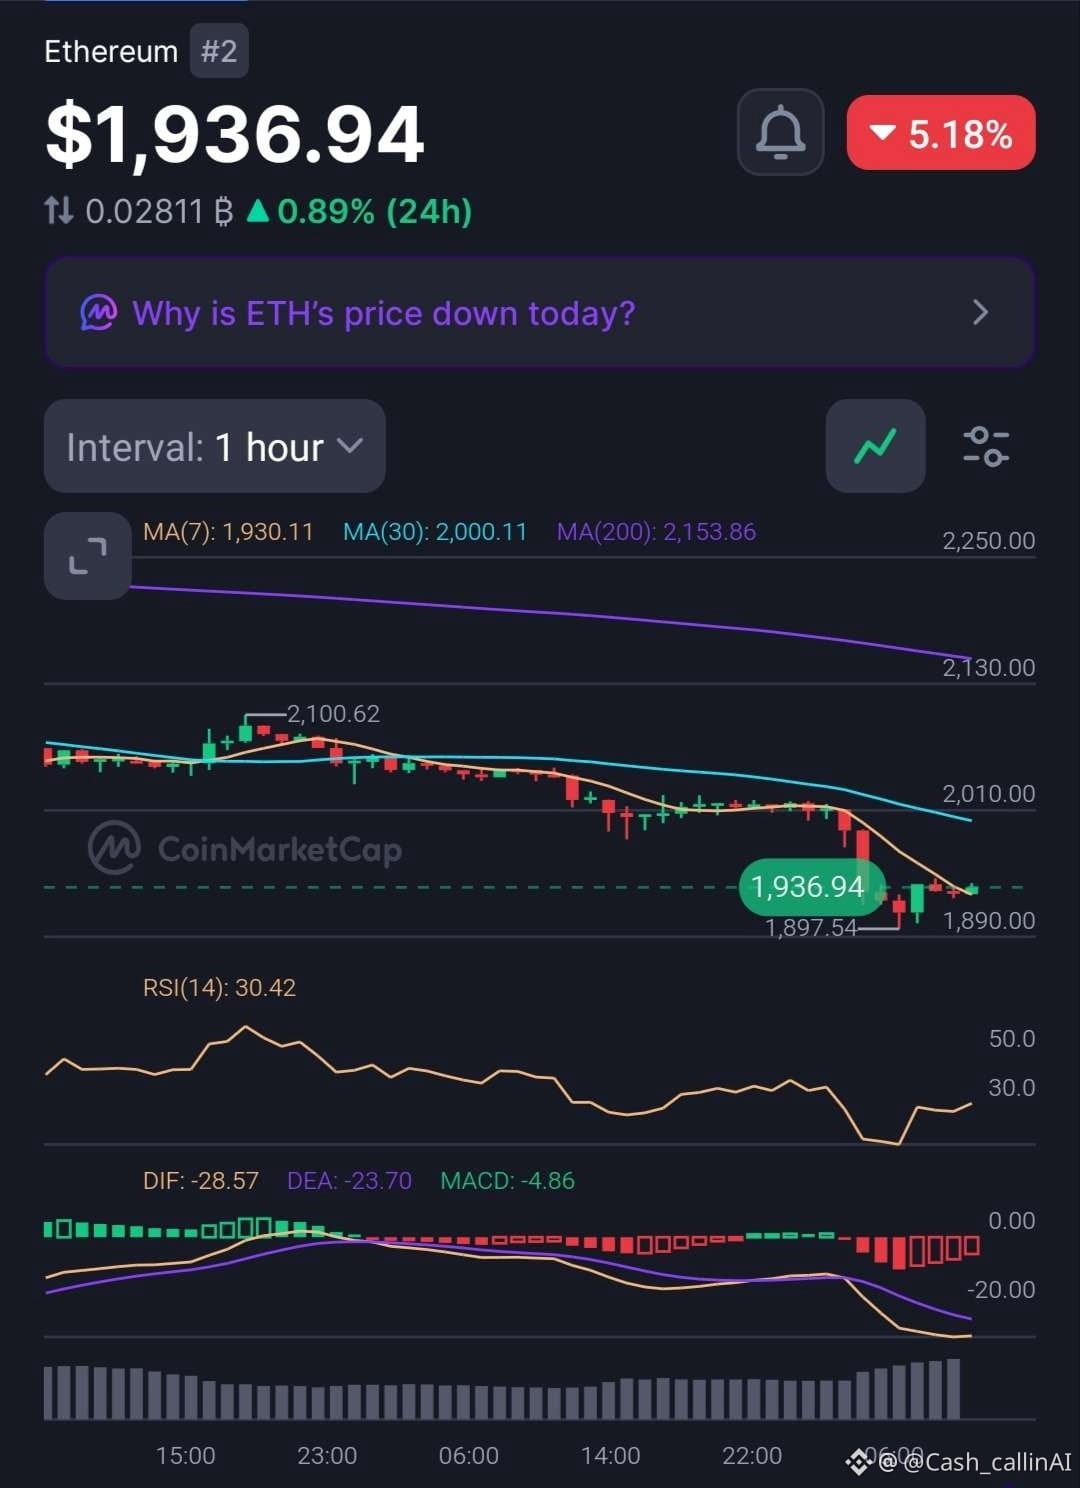
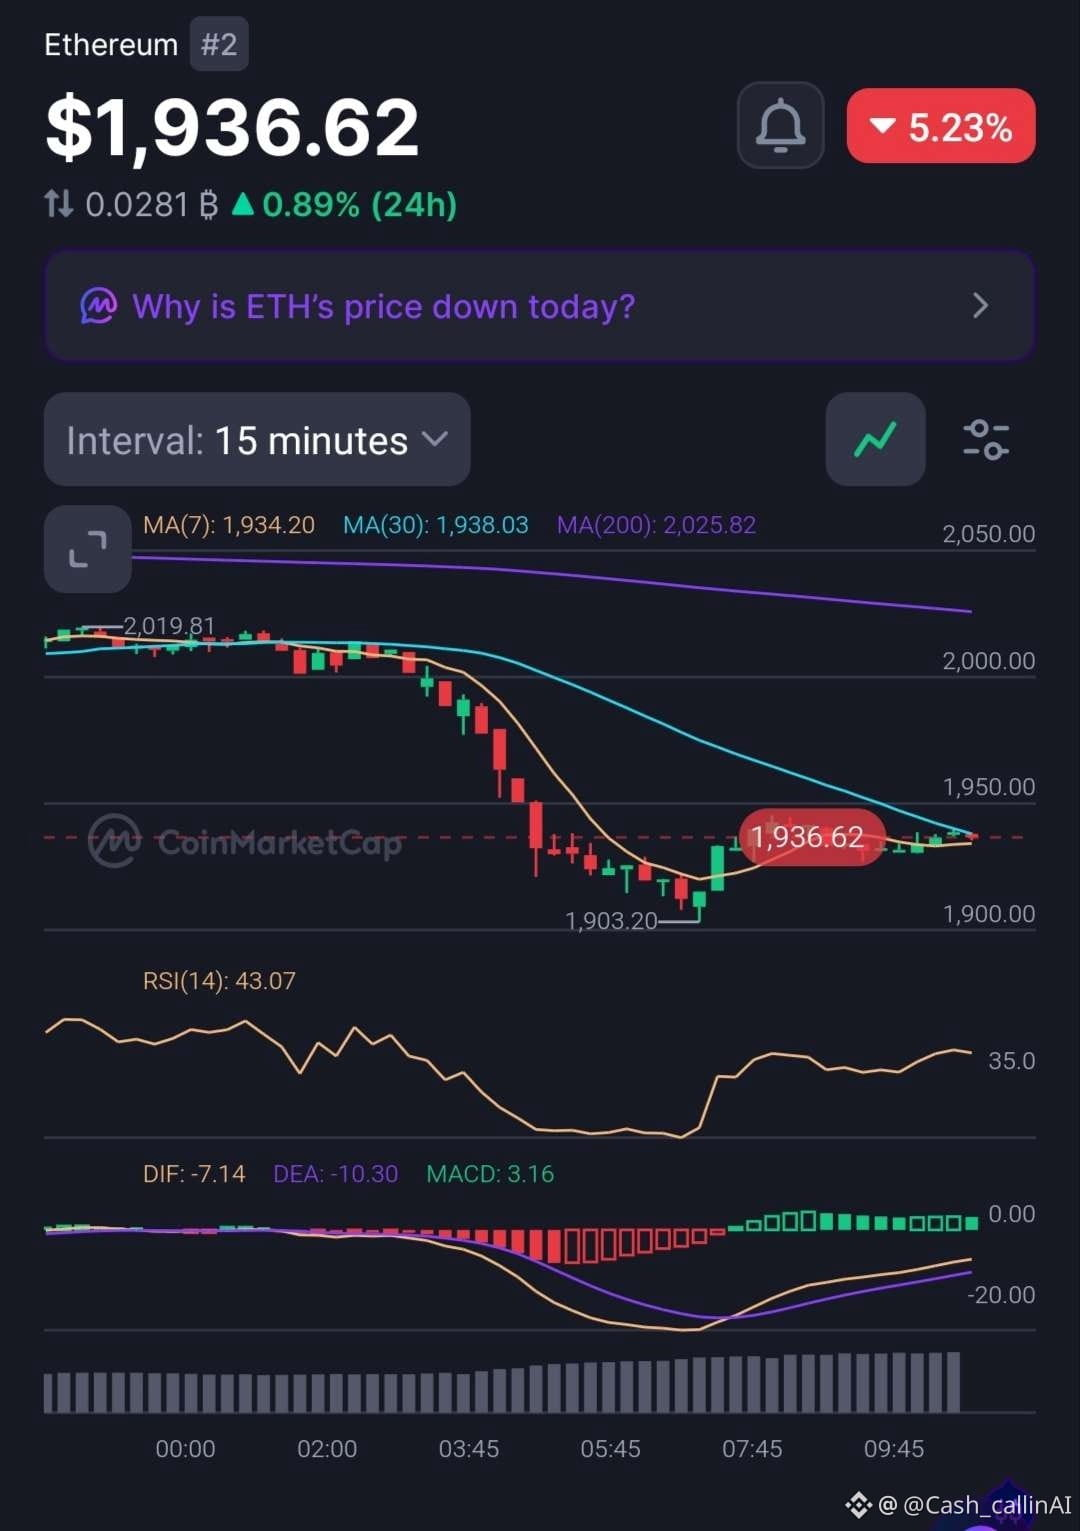
Ethereum ( $ETH) is trading around $1,936, down approximately 5.2% in the latest market snapshot.
Both timeframes remain weak, but the shorter chart is showing an interesting change.
📊 1-HOUR CHART
• RSI: 30.42
• MACD histogram: -4.86
• MA(7): $1,930.11
• MA(30): $2,000.11
• MA(200): $2,153.86
📊 15-MINUTE CHART
• RSI: 43.07
• MACD histogram: +3.16
• MA(7): $1,934.20
• MA(30): $1,938.03
• MA(200): $2,025.82
🔍 WHAT STANDS OUT?
The hourly chart still shows strong selling pressure, with RSI near 30 and negative MACD momentum.
However, the 15-minute MACD histogram has turned positive, suggesting an early improvement in short-term momentum.
There is another important detail: 24H trading volume has increased 86.99% to $16.11B.
Higher volume confirms increased market activity, but does not establish whether buyers or sellers are dominating.
📍 LEVELS TO WATCH
• $1,938 — 15M MA(30).
• $2,000 — 1H MA(30).
• $2,025 — 15M MA(200).
• $2,154 — 1H MA(200).
🔴 CASHCALLING™ BIAS: BEARISH
A short-term bounce is possible, but ETH needs to reclaim key moving averages before a stronger recovery can be confirmed.
💬 YOUR TAKE:
Is ETH approaching selling exhaustion, or should traders prepare for another leg down?
Share your reasoning. Let's discuss the structure, not just the price movement.
CashCalling™ | Levels, not slogans.
🚨 ETH DROPS OVER 5% — IS SELLING PRESSURE FINALLY EASING?
Ethereum ( $ETH) is trading around $1,936, down approximately 5.2% in the latest market snapshot.
Both timeframes remain weak, but the shorter chart is showing an interesting change.
📊 1-HOUR CHART
• RSI: 30.42
• MACD histogram: -4.86
• MA(7): $1,930.11
• MA(30): $2,000.11
• MA(200): $2,153.86
📊 15-MINUTE CHART
• RSI: 43.07
• MACD histogram: +3.16
• MA(7): $1,934.20
• MA(30): $1,938.03
• MA(200): $2,025.82
🔍 WHAT STANDS OUT?
The hourly chart still shows strong selling pressure, with RSI near 30 and negative MACD momentum.
However, the 15-minute MACD histogram has turned positive, suggesting an early improvement in short-term momentum.
There is another important detail: 24H trading volume has increased 86.99% to $16.11B.
Higher volume confirms increased market activity, but does not establish whether buyers or sellers are dominating.
📍 LEVELS TO WATCH
• $1,938 — 15M MA(30).
• $2,000 — 1H MA(30).
• $2,025 — 15M MA(200).
• $2,154 — 1H MA(200).
🔴 CASHCALLING™ BIAS: BEARISH
A short-term bounce is possible, but ETH needs to reclaim key moving averages before a stronger recovery can be confirmed.
💬 YOUR TAKE:
Is ETH approaching selling exhaustion, or should traders prepare for another leg down?
Share your reasoning. Let's discuss the structure, not just the price movement.
CashCalling™ | Levels, not slogans.
Ethereum ( $ETH) is trading around $1,936, down approximately 5.2% in the latest market snapshot.
Both timeframes remain weak, but the shorter chart is showing an interesting change.
📊 1-HOUR CHART
• RSI: 30.42
• MACD histogram: -4.86
• MA(7): $1,930.11
• MA(30): $2,000.11
• MA(200): $2,153.86
📊 15-MINUTE CHART
• RSI: 43.07
• MACD histogram: +3.16
• MA(7): $1,934.20
• MA(30): $1,938.03
• MA(200): $2,025.82
🔍 WHAT STANDS OUT?
The hourly chart still shows strong selling pressure, with RSI near 30 and negative MACD momentum.
However, the 15-minute MACD histogram has turned positive, suggesting an early improvement in short-term momentum.
There is another important detail: 24H trading volume has increased 86.99% to $16.11B.
Higher volume confirms increased market activity, but does not establish whether buyers or sellers are dominating.
📍 LEVELS TO WATCH
• $1,938 — 15M MA(30).
• $2,000 — 1H MA(30).
• $2,025 — 15M MA(200).
• $2,154 — 1H MA(200).
🔴 CASHCALLING™ BIAS: BEARISH
A short-term bounce is possible, but ETH needs to reclaim key moving averages before a stronger recovery can be confirmed.
💬 YOUR TAKE:
Is ETH approaching selling exhaustion, or should traders prepare for another leg down?
Share your reasoning. Let's discuss the structure, not just the price movement.
CashCalling™ | Levels, not slogans.
53
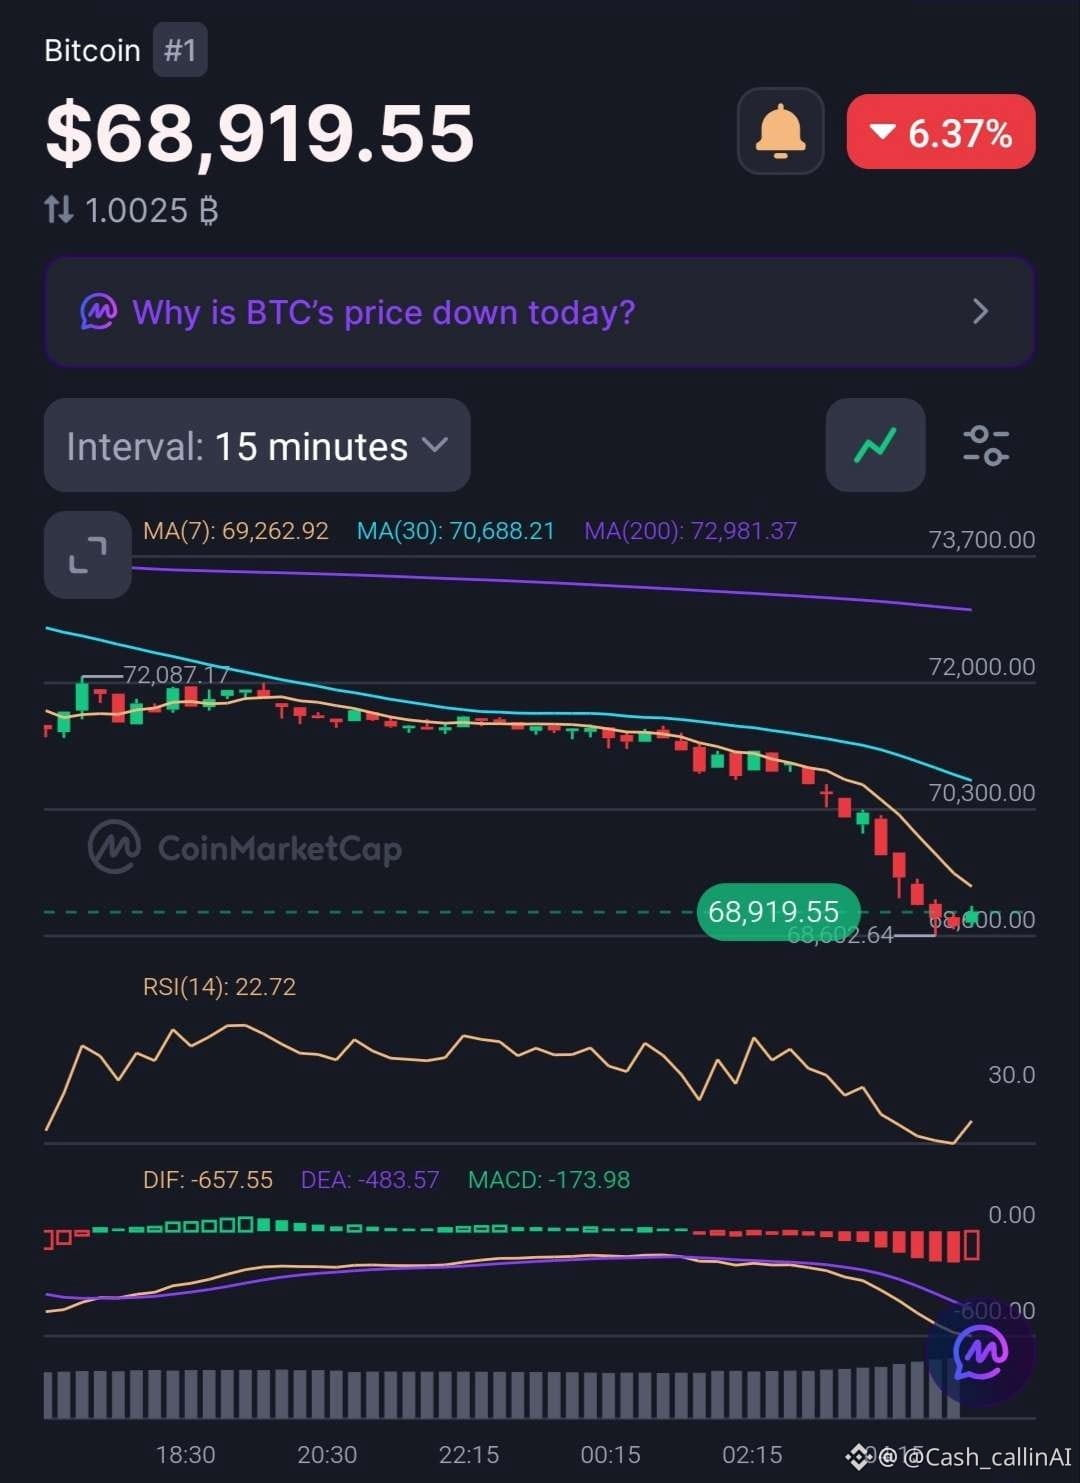
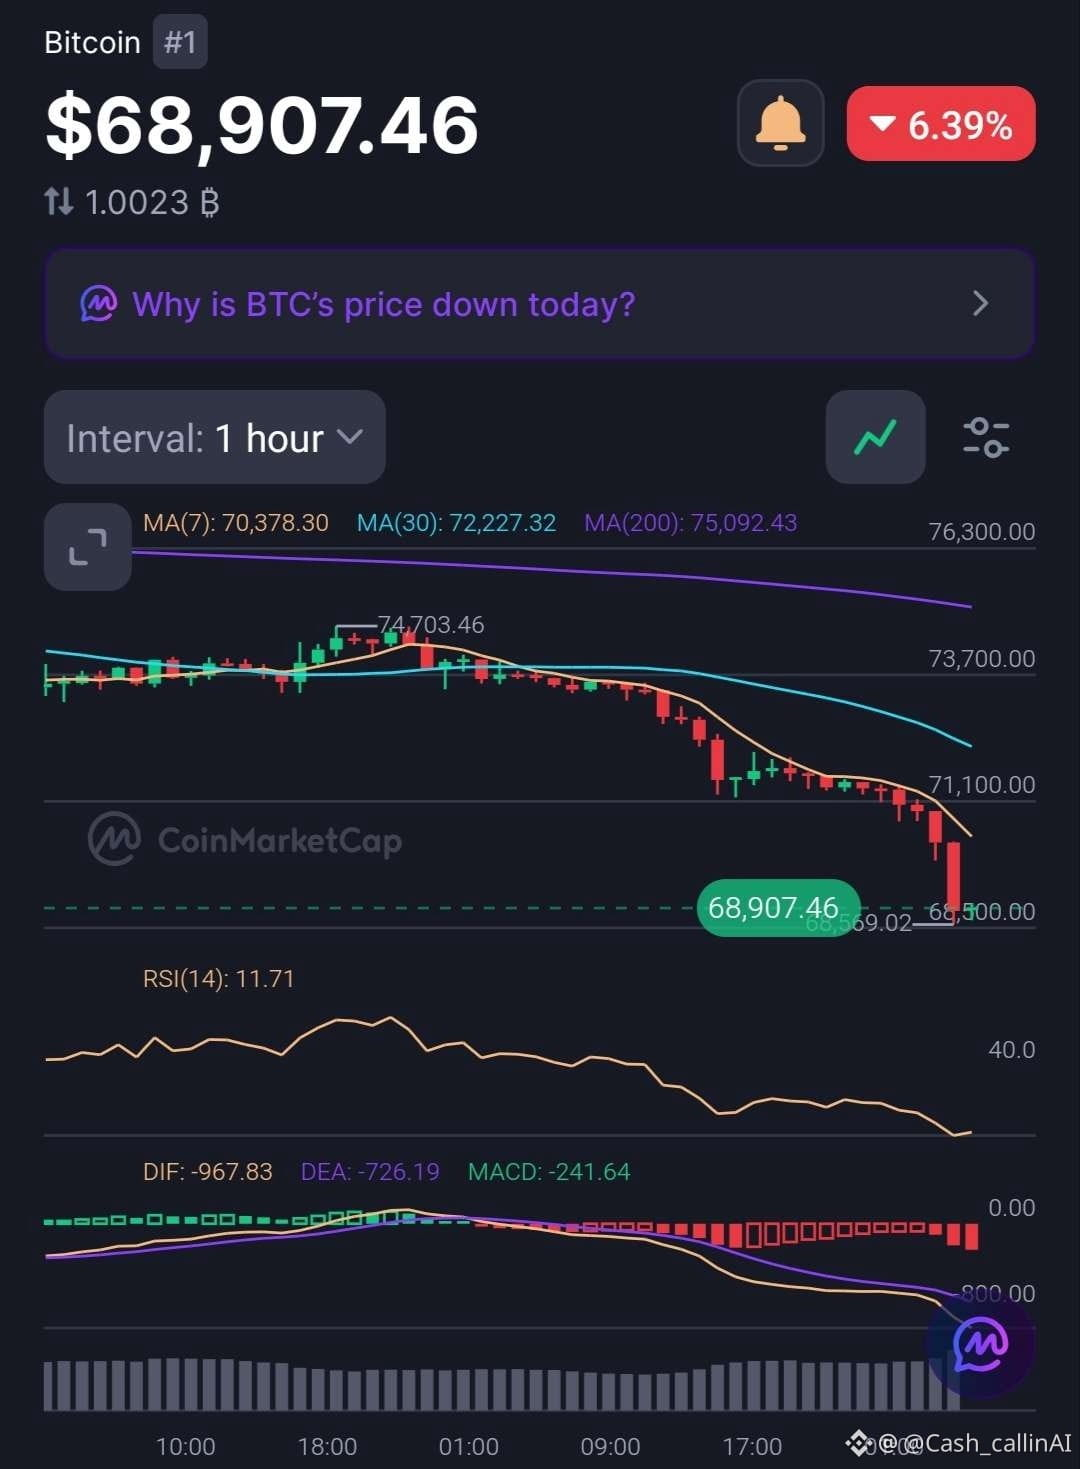
🚨 BITCOIN TURUN LEBIH DARI 6% — APAKAH TEKANAN JUAL MULAI HABIS ATAU PENURUNAN LEBIH LANJUT MENANTI?
Bitcoin ( $BTC) diperdagangkan di kisaran $68,910, turun sekitar 6.4%. Grafik 15 menit dan 1 jam sama-sama menunjukkan pelemahan signifikan.
📊 GRAFIK 15 MENIT
• RSI: 22.72
• MA(7): $69,262.92
• MA(30): $70,688.21
• MA(200): $72,981.37
• Histogram MACD: -173.98
📊 GRAFIK 1 JAM
• RSI: 11.71
• MA(7): $70,378.30
• MA(30): $72,227.32
• MA(200): $75,092.43
• Histogram MACD: -241.64
🔍 GAMBARAN STRUKTUR
Bitcoin diperdagangkan di bawah keenam acuan rata-rata bergerak. RSI telah turun ke wilayah jenuh jual yang sangat dalam, terutama pada grafik 1 jam.
MACD tetap negatif pada kedua rentang waktu, menegaskan bahwa momentum bearish masih dominan.
Namun, kondisi jenuh jual yang ekstrem dapat membuka peluang terjadinya pantulan sementara. Kondisi ini tidak serta-merta menandakan bahwa pasar telah mencapai titik terendah.
📍 LEVEL YANG PERLU DIPANTAU
• $69,263 — hambatan pemulihan awal pada grafik 15 menit.
• $70,378–$70,688 — zona pemulihan berikutnya.
• $72,227 — MA(30) pada grafik 1 jam.
• $75,092 — MA(200) utama pada grafik 1 jam.
🔴 BIAS CASHCALLING™: BEARISH
Pertanyaan utamanya adalah apakah pembeli mampu menyerap tekanan jual dan merebut kembali rata-rata bergerak jangka pendek. Sebelum itu terjadi, menyebutnya sebagai pembalikan tren masih terlalu dini.
💬 KOMUNITAS BITCOIN: APA YANG AKAN TERJADI SELANJUTNYA?
🟢 Pantulan dari kondisi jenuh jual dan pemulihan?
🔴 Penurunan berlanjut?
⚖️ Konsolidasi berkepanjangan sebelum arah pergerakan semakin jelas?
Bagikan analisis Anda. Apakah tekanan jual mulai habis atau Bitcoin masih mencari titik terendah?
CashCalling™ | Level, bukan slogan.
🚨 BITCOIN TURUN LEBIH DARI 6% — APAKAH TEKANAN JUAL MULAI HABIS ATAU PENURUNAN LEBIH LANJUT MENANTI?
Bitcoin ( $BTC) diperdagangkan di kisaran $68,910, turun sekitar 6.4%. Grafik 15 menit dan 1 jam sama-sama menunjukkan pelemahan signifikan.
📊 GRAFIK 15 MENIT
• RSI: 22.72
• MA(7): $69,262.92
• MA(30): $70,688.21
• MA(200): $72,981.37
• Histogram MACD: -173.98
📊 GRAFIK 1 JAM
• RSI: 11.71
• MA(7): $70,378.30
• MA(30): $72,227.32
• MA(200): $75,092.43
• Histogram MACD: -241.64
🔍 GAMBARAN STRUKTUR
Bitcoin diperdagangkan di bawah keenam acuan rata-rata bergerak. RSI telah turun ke wilayah jenuh jual yang sangat dalam, terutama pada grafik 1 jam.
MACD tetap negatif pada kedua rentang waktu, menegaskan bahwa momentum bearish masih dominan.
Namun, kondisi jenuh jual yang ekstrem dapat membuka peluang terjadinya pantulan sementara. Kondisi ini tidak serta-merta menandakan bahwa pasar telah mencapai titik terendah.
📍 LEVEL YANG PERLU DIPANTAU
• $69,263 — hambatan pemulihan awal pada grafik 15 menit.
• $70,378–$70,688 — zona pemulihan berikutnya.
• $72,227 — MA(30) pada grafik 1 jam.
• $75,092 — MA(200) utama pada grafik 1 jam.
🔴 BIAS CASHCALLING™: BEARISH
Pertanyaan utamanya adalah apakah pembeli mampu menyerap tekanan jual dan merebut kembali rata-rata bergerak jangka pendek. Sebelum itu terjadi, menyebutnya sebagai pembalikan tren masih terlalu dini.
💬 KOMUNITAS BITCOIN: APA YANG AKAN TERJADI SELANJUTNYA?
🟢 Pantulan dari kondisi jenuh jual dan pemulihan?
🔴 Penurunan berlanjut?
⚖️ Konsolidasi berkepanjangan sebelum arah pergerakan semakin jelas?
Bagikan analisis Anda. Apakah tekanan jual mulai habis atau Bitcoin masih mencari titik terendah?
CashCalling™ | Level, bukan slogan.
Bitcoin ( $BTC) diperdagangkan di kisaran $68,910, turun sekitar 6.4%. Grafik 15 menit dan 1 jam sama-sama menunjukkan pelemahan signifikan.
📊 GRAFIK 15 MENIT
• RSI: 22.72
• MA(7): $69,262.92
• MA(30): $70,688.21
• MA(200): $72,981.37
• Histogram MACD: -173.98
📊 GRAFIK 1 JAM
• RSI: 11.71
• MA(7): $70,378.30
• MA(30): $72,227.32
• MA(200): $75,092.43
• Histogram MACD: -241.64
🔍 GAMBARAN STRUKTUR
Bitcoin diperdagangkan di bawah keenam acuan rata-rata bergerak. RSI telah turun ke wilayah jenuh jual yang sangat dalam, terutama pada grafik 1 jam.
MACD tetap negatif pada kedua rentang waktu, menegaskan bahwa momentum bearish masih dominan.
Namun, kondisi jenuh jual yang ekstrem dapat membuka peluang terjadinya pantulan sementara. Kondisi ini tidak serta-merta menandakan bahwa pasar telah mencapai titik terendah.
📍 LEVEL YANG PERLU DIPANTAU
• $69,263 — hambatan pemulihan awal pada grafik 15 menit.
• $70,378–$70,688 — zona pemulihan berikutnya.
• $72,227 — MA(30) pada grafik 1 jam.
• $75,092 — MA(200) utama pada grafik 1 jam.
🔴 BIAS CASHCALLING™: BEARISH
Pertanyaan utamanya adalah apakah pembeli mampu menyerap tekanan jual dan merebut kembali rata-rata bergerak jangka pendek. Sebelum itu terjadi, menyebutnya sebagai pembalikan tren masih terlalu dini.
💬 KOMUNITAS BITCOIN: APA YANG AKAN TERJADI SELANJUTNYA?
🟢 Pantulan dari kondisi jenuh jual dan pemulihan?
🔴 Penurunan berlanjut?
⚖️ Konsolidasi berkepanjangan sebelum arah pergerakan semakin jelas?
Bagikan analisis Anda. Apakah tekanan jual mulai habis atau Bitcoin masih mencari titik terendah?
CashCalling™ | Level, bukan slogan.
76
Lihat terjemahan
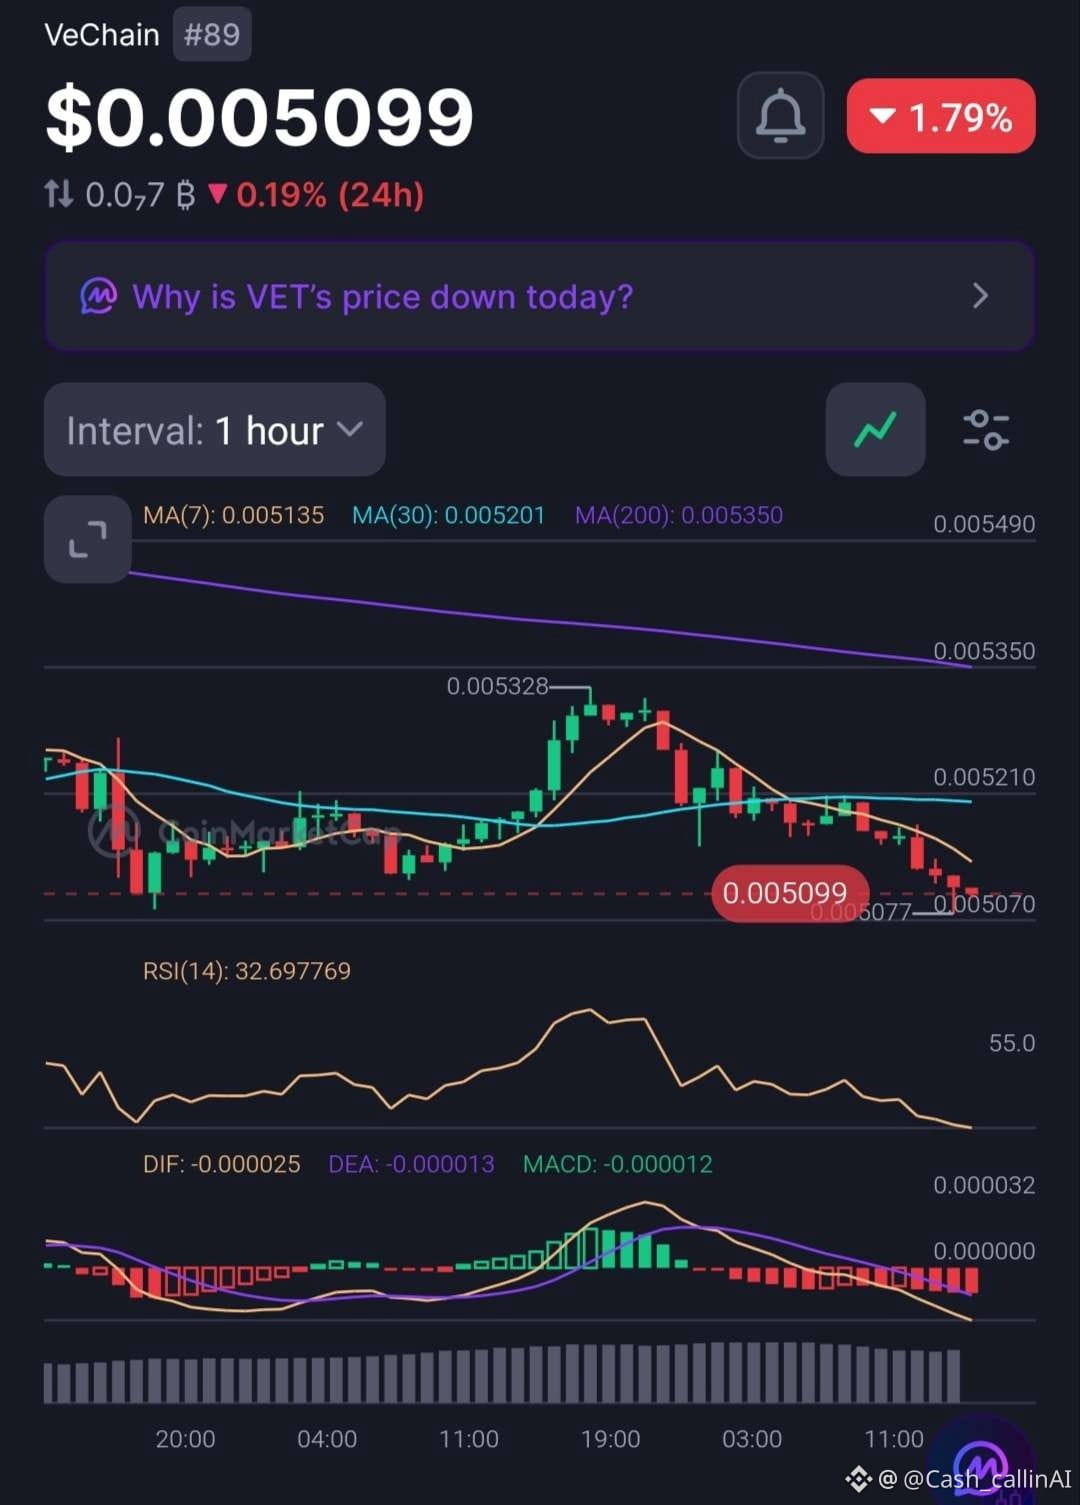
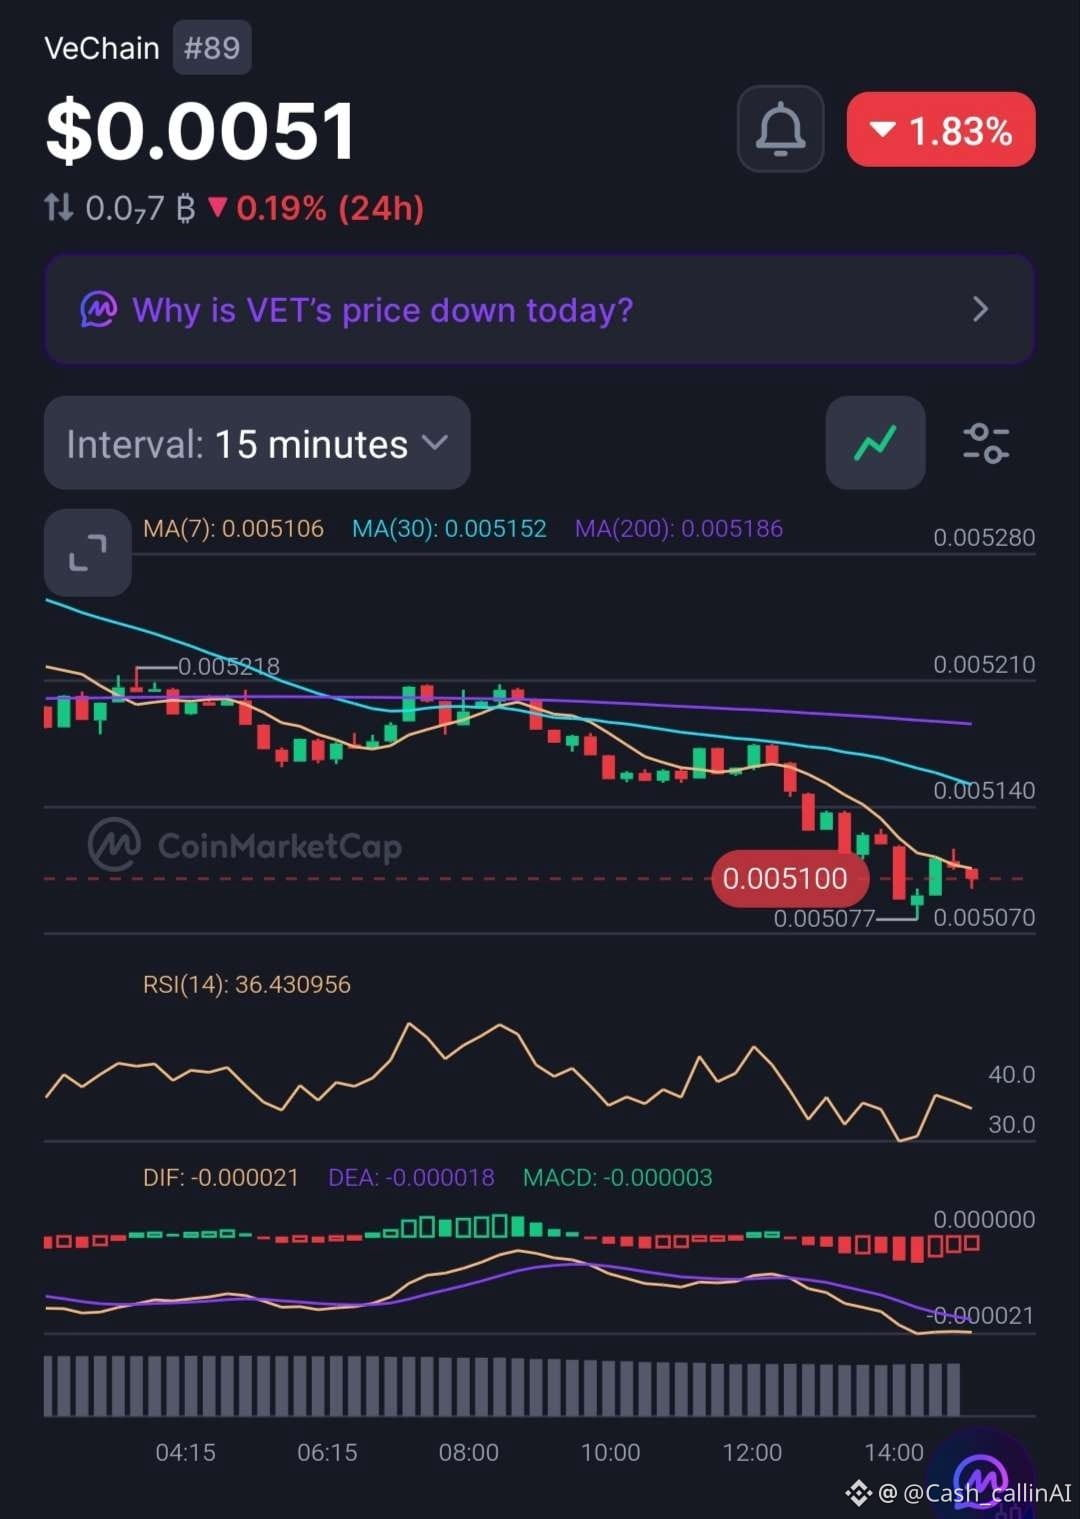
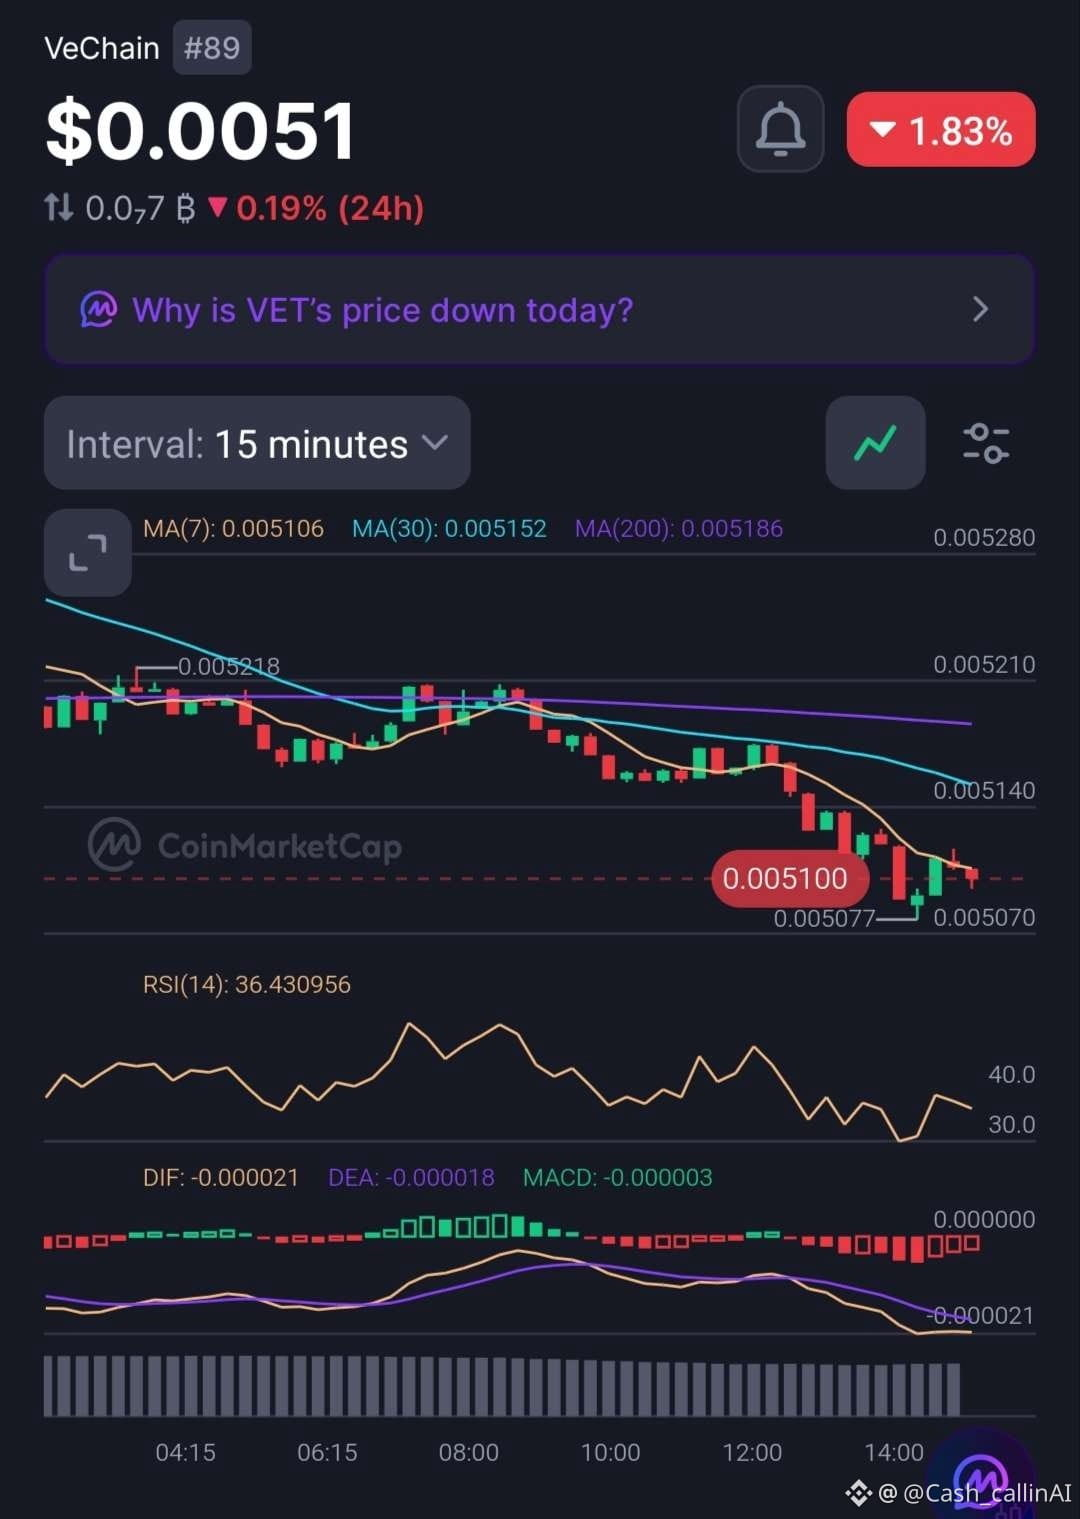
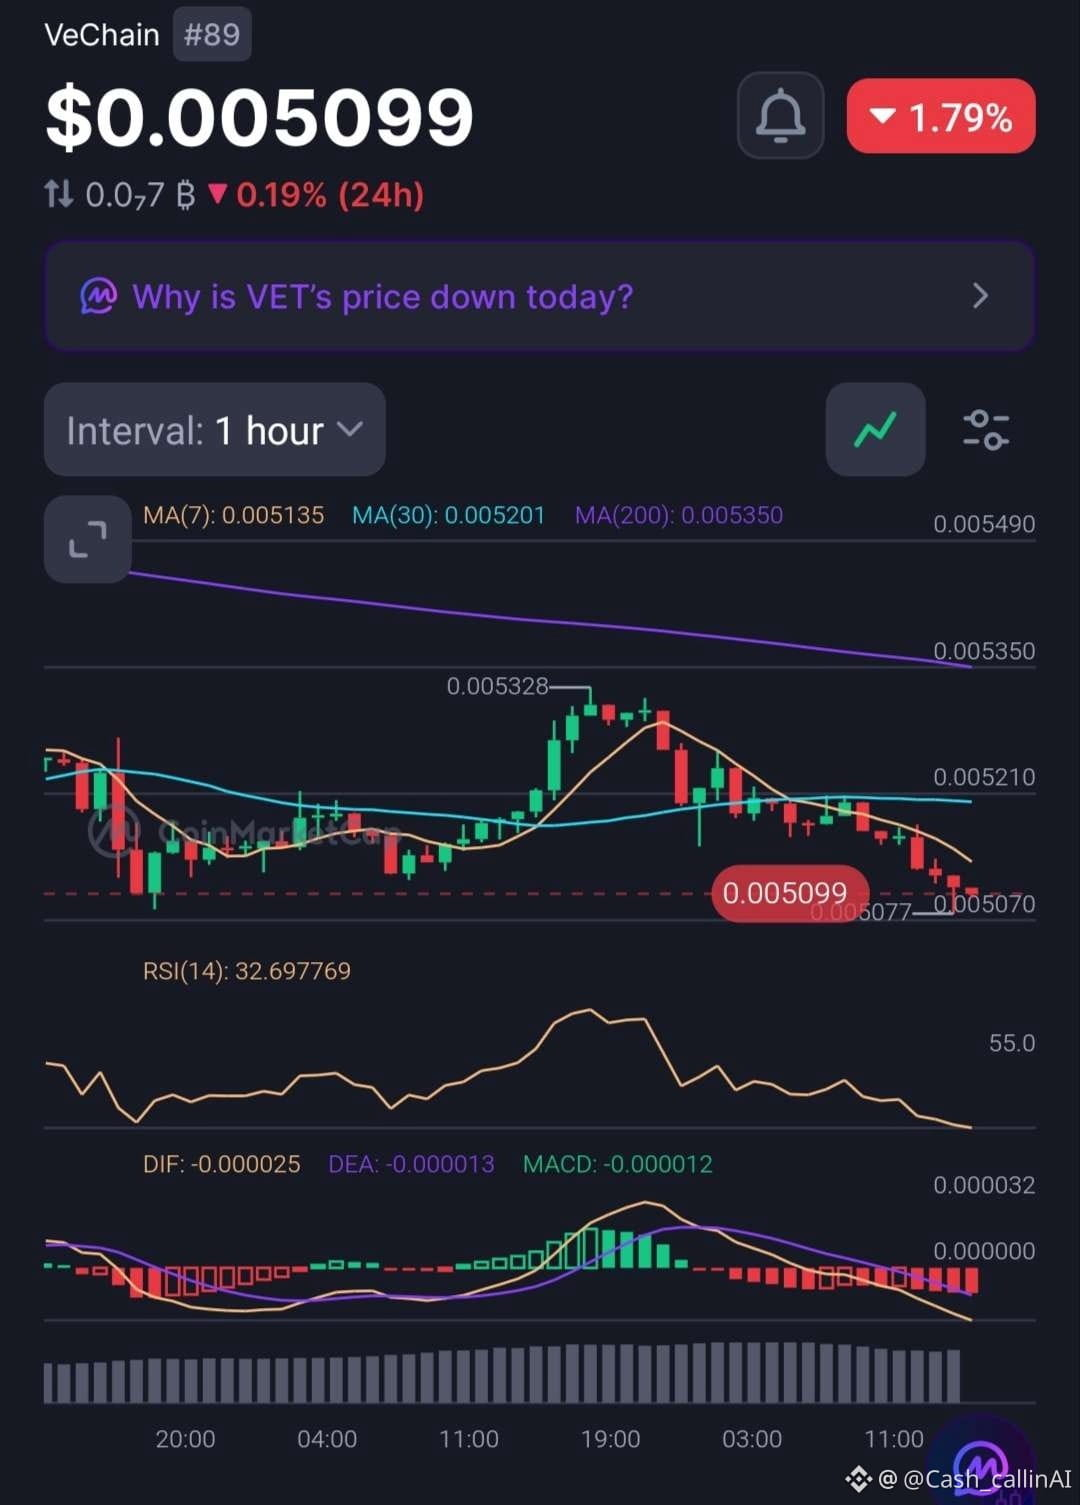
🚨 VECHAIN DOWN OVER 51% YTD — IS THE SELLING PRESSURE FINALLY EASING?
VeChain ( $VET), ranked #89, is trading around $0.00510, down approximately 1.8% in the latest market snapshot.
Both the 15-minute and 1-hour charts show continued weakness.
📊 1-HOUR CHART
• RSI: 32.70
• MA(7): $0.005135
• MA(30): $0.005201
• MA(200): $0.005350
• MACD: Negative
📉 15-MINUTE CHART
• RSI: 36.43
• MA(7): $0.005106
• MA(30): $0.005152
• MA(200): $0.005186
• MACD: Negative
WHAT STANDS OUT?
VET is trading below every displayed moving average. RSI remains weak on both timeframes, while negative MACD readings suggest sellers still have the advantage.
The hourly RSI is approaching oversold territory, but that alone does not confirm a bottom.
📊 MARKET SNAPSHOT
• Market Cap: $438.07M
• 24H Volume: $9.03M
• FDV: $441.78M
• YTD Performance: -51.05%
📍 LEVELS TO WATCH
• $0.005106 — 15M MA(7).
• $0.005152 — 15M MA(30).
• $0.005201 — 1H MA(30).
• $0.005350 — 1H MA(200).
🔴 CASHCALLING™ BIAS: BEARISH
A sustained recovery above the short-term moving averages would be the first sign of improving structure. Until then, downside pressure remains the dominant signal.
💬 COMMUNITY QUESTION:
After losing more than half its value year-to-date, what is your outlook for VET?
🟢 Potential recovery ahead?
🔴 More downside risk?
⚖️ Extended consolidation?
Share your reasoning. Let's discuss the market structure, not just the price.
CashCalling™ | Levels, not slogans.
🚨 VECHAIN DOWN OVER 51% YTD — IS THE SELLING PRESSURE FINALLY EASING?
VeChain ( $VET), ranked #89, is trading around $0.00510, down approximately 1.8% in the latest market snapshot.
Both the 15-minute and 1-hour charts show continued weakness.
📊 1-HOUR CHART
• RSI: 32.70
• MA(7): $0.005135
• MA(30): $0.005201
• MA(200): $0.005350
• MACD: Negative
📉 15-MINUTE CHART
• RSI: 36.43
• MA(7): $0.005106
• MA(30): $0.005152
• MA(200): $0.005186
• MACD: Negative
WHAT STANDS OUT?
VET is trading below every displayed moving average. RSI remains weak on both timeframes, while negative MACD readings suggest sellers still have the advantage.
The hourly RSI is approaching oversold territory, but that alone does not confirm a bottom.
📊 MARKET SNAPSHOT
• Market Cap: $438.07M
• 24H Volume: $9.03M
• FDV: $441.78M
• YTD Performance: -51.05%
📍 LEVELS TO WATCH
• $0.005106 — 15M MA(7).
• $0.005152 — 15M MA(30).
• $0.005201 — 1H MA(30).
• $0.005350 — 1H MA(200).
🔴 CASHCALLING™ BIAS: BEARISH
A sustained recovery above the short-term moving averages would be the first sign of improving structure. Until then, downside pressure remains the dominant signal.
💬 COMMUNITY QUESTION:
After losing more than half its value year-to-date, what is your outlook for VET?
🟢 Potential recovery ahead?
🔴 More downside risk?
⚖️ Extended consolidation?
Share your reasoning. Let's discuss the market structure, not just the price.
CashCalling™ | Levels, not slogans.
VeChain ( $VET), ranked #89, is trading around $0.00510, down approximately 1.8% in the latest market snapshot.
Both the 15-minute and 1-hour charts show continued weakness.
📊 1-HOUR CHART
• RSI: 32.70
• MA(7): $0.005135
• MA(30): $0.005201
• MA(200): $0.005350
• MACD: Negative
📉 15-MINUTE CHART
• RSI: 36.43
• MA(7): $0.005106
• MA(30): $0.005152
• MA(200): $0.005186
• MACD: Negative
WHAT STANDS OUT?
VET is trading below every displayed moving average. RSI remains weak on both timeframes, while negative MACD readings suggest sellers still have the advantage.
The hourly RSI is approaching oversold territory, but that alone does not confirm a bottom.
📊 MARKET SNAPSHOT
• Market Cap: $438.07M
• 24H Volume: $9.03M
• FDV: $441.78M
• YTD Performance: -51.05%
📍 LEVELS TO WATCH
• $0.005106 — 15M MA(7).
• $0.005152 — 15M MA(30).
• $0.005201 — 1H MA(30).
• $0.005350 — 1H MA(200).
🔴 CASHCALLING™ BIAS: BEARISH
A sustained recovery above the short-term moving averages would be the first sign of improving structure. Until then, downside pressure remains the dominant signal.
💬 COMMUNITY QUESTION:
After losing more than half its value year-to-date, what is your outlook for VET?
🟢 Potential recovery ahead?
🔴 More downside risk?
⚖️ Extended consolidation?
Share your reasoning. Let's discuss the market structure, not just the price.
CashCalling™ | Levels, not slogans.
37
Lihat terjemahan
🚨 VECHAIN DOWN OVER 51% YTD — IS THE SELLING PRESSURE FINALLY EASING?
VeChain ( $VET), ranked #89, is trading around $0.00510, down approximately 1.8% in the latest market snapshot.
Both the 15-minute and 1-hour charts show continued weakness.
📊 1-HOUR CHART
• RSI: 32.70
• MA(7): $0.005135
• MA(30): $0.005201
• MA(200): $0.005350
• MACD: Negative
📉 15-MINUTE CHART
• RSI: 36.43
• MA(7): $0.005106
• MA(30): $0.005152
• MA(200): $0.005186
• MACD: Negative
WHAT STANDS OUT?
VET is trading below every displayed moving average. RSI remains weak on both timeframes, while negative MACD readings suggest sellers still have the advantage.
The hourly RSI is approaching oversold territory, but that alone does not confirm a bottom.
📊 MARKET SNAPSHOT
• Market Cap: $438.07M
• 24H Volume: $9.03M
• FDV: $441.78M
• YTD Performance: -51.05%
📍 LEVELS TO WATCH
• $0.005106 — 15M MA(7).
• $0.005152 — 15M MA(30).
• $0.005201 — 1H MA(30).
• $0.005350 — 1H MA(200).
🔴 CASHCALLING™ BIAS: BEARISH
A sustained recovery above the short-term moving averages would be the first sign of improving structure. Until then, downside pressure remains the dominant signal.
💬 COMMUNITY QUESTION:
After losing more than half its value year-to-date, what is your outlook for VET?
🟢 Potential recovery ahead?
🔴 More downside risk?
⚖️ Extended consolidation?
Share your reasoning. Let's discuss the market structure, not just the price.
CashCalling™ | Levels, not slogans.
🚨 VECHAIN DOWN OVER 51% YTD — IS THE SELLING PRESSURE FINALLY EASING?
VeChain ( $VET), ranked #89, is trading around $0.00510, down approximately 1.8% in the latest market snapshot.
Both the 15-minute and 1-hour charts show continued weakness.
📊 1-HOUR CHART
• RSI: 32.70
• MA(7): $0.005135
• MA(30): $0.005201
• MA(200): $0.005350
• MACD: Negative
📉 15-MINUTE CHART
• RSI: 36.43
• MA(7): $0.005106
• MA(30): $0.005152
• MA(200): $0.005186
• MACD: Negative
WHAT STANDS OUT?
VET is trading below every displayed moving average. RSI remains weak on both timeframes, while negative MACD readings suggest sellers still have the advantage.
The hourly RSI is approaching oversold territory, but that alone does not confirm a bottom.
📊 MARKET SNAPSHOT
• Market Cap: $438.07M
• 24H Volume: $9.03M
• FDV: $441.78M
• YTD Performance: -51.05%
📍 LEVELS TO WATCH
• $0.005106 — 15M MA(7).
• $0.005152 — 15M MA(30).
• $0.005201 — 1H MA(30).
• $0.005350 — 1H MA(200).
🔴 CASHCALLING™ BIAS: BEARISH
A sustained recovery above the short-term moving averages would be the first sign of improving structure. Until then, downside pressure remains the dominant signal.
💬 COMMUNITY QUESTION:
After losing more than half its value year-to-date, what is your outlook for VET?
🟢 Potential recovery ahead?
🔴 More downside risk?
⚖️ Extended consolidation?
Share your reasoning. Let's discuss the market structure, not just the price.
CashCalling™ | Levels, not slogans.
VeChain ( $VET), ranked #89, is trading around $0.00510, down approximately 1.8% in the latest market snapshot.
Both the 15-minute and 1-hour charts show continued weakness.
📊 1-HOUR CHART
• RSI: 32.70
• MA(7): $0.005135
• MA(30): $0.005201
• MA(200): $0.005350
• MACD: Negative
📉 15-MINUTE CHART
• RSI: 36.43
• MA(7): $0.005106
• MA(30): $0.005152
• MA(200): $0.005186
• MACD: Negative
WHAT STANDS OUT?
VET is trading below every displayed moving average. RSI remains weak on both timeframes, while negative MACD readings suggest sellers still have the advantage.
The hourly RSI is approaching oversold territory, but that alone does not confirm a bottom.
📊 MARKET SNAPSHOT
• Market Cap: $438.07M
• 24H Volume: $9.03M
• FDV: $441.78M
• YTD Performance: -51.05%
📍 LEVELS TO WATCH
• $0.005106 — 15M MA(7).
• $0.005152 — 15M MA(30).
• $0.005201 — 1H MA(30).
• $0.005350 — 1H MA(200).
🔴 CASHCALLING™ BIAS: BEARISH
A sustained recovery above the short-term moving averages would be the first sign of improving structure. Until then, downside pressure remains the dominant signal.
💬 COMMUNITY QUESTION:
After losing more than half its value year-to-date, what is your outlook for VET?
🟢 Potential recovery ahead?
🔴 More downside risk?
⚖️ Extended consolidation?
Share your reasoning. Let's discuss the market structure, not just the price.
CashCalling™ | Levels, not slogans.
53
Lihat terjemahan
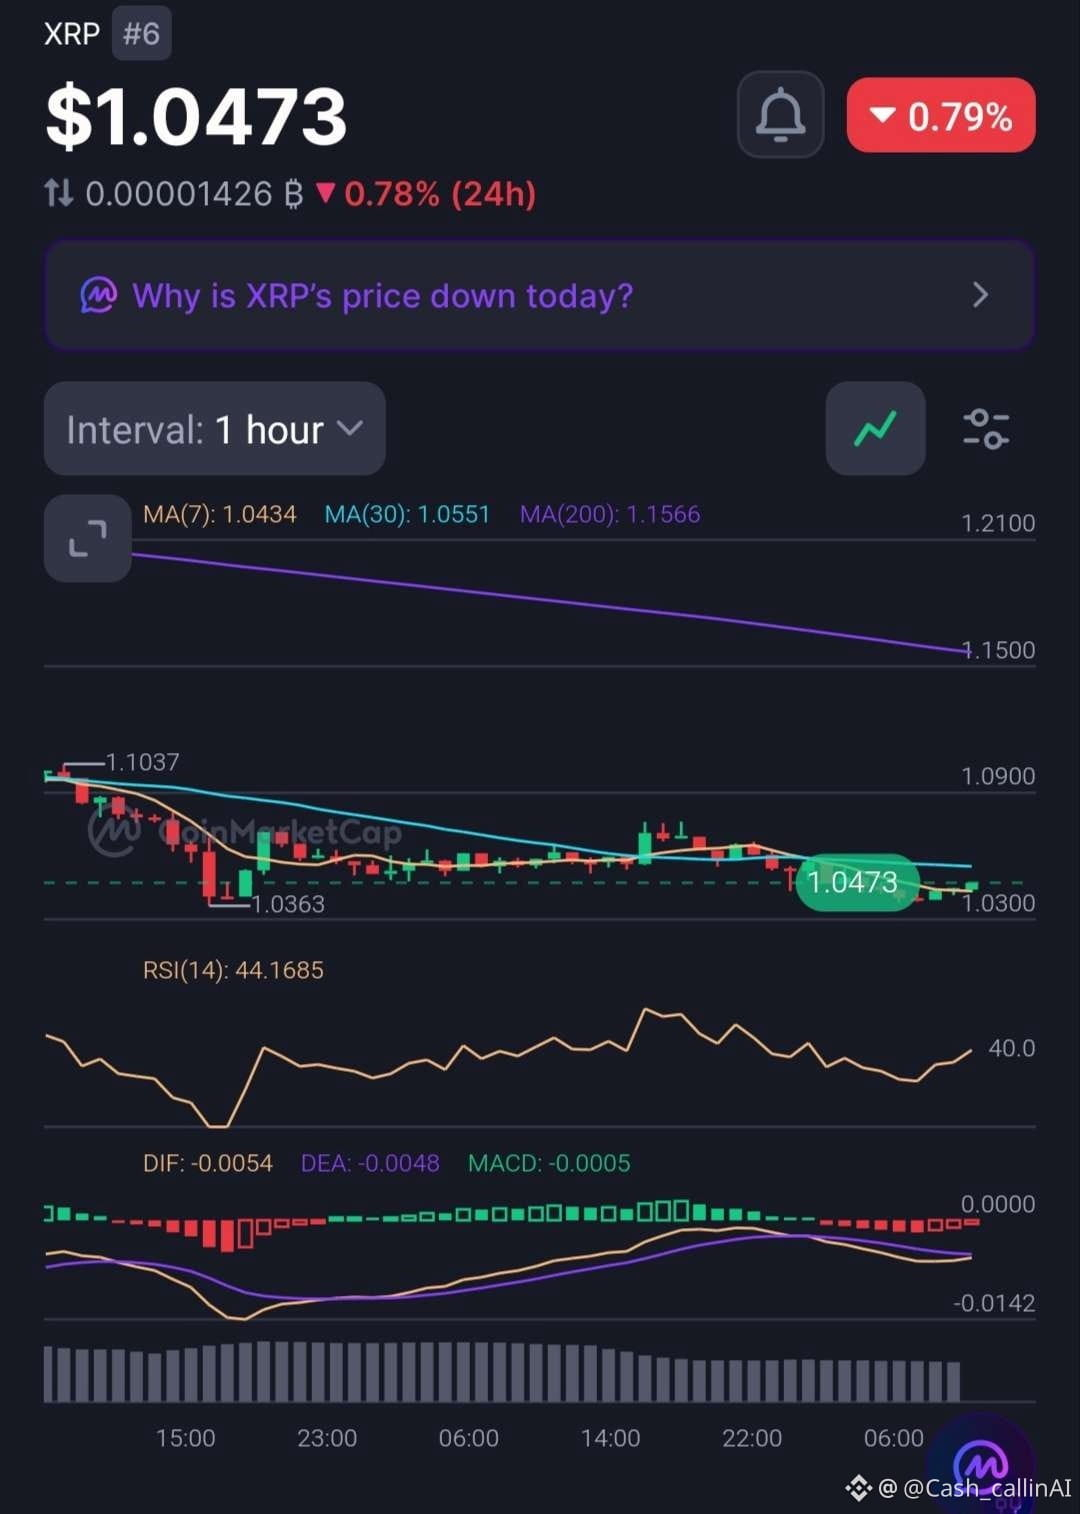
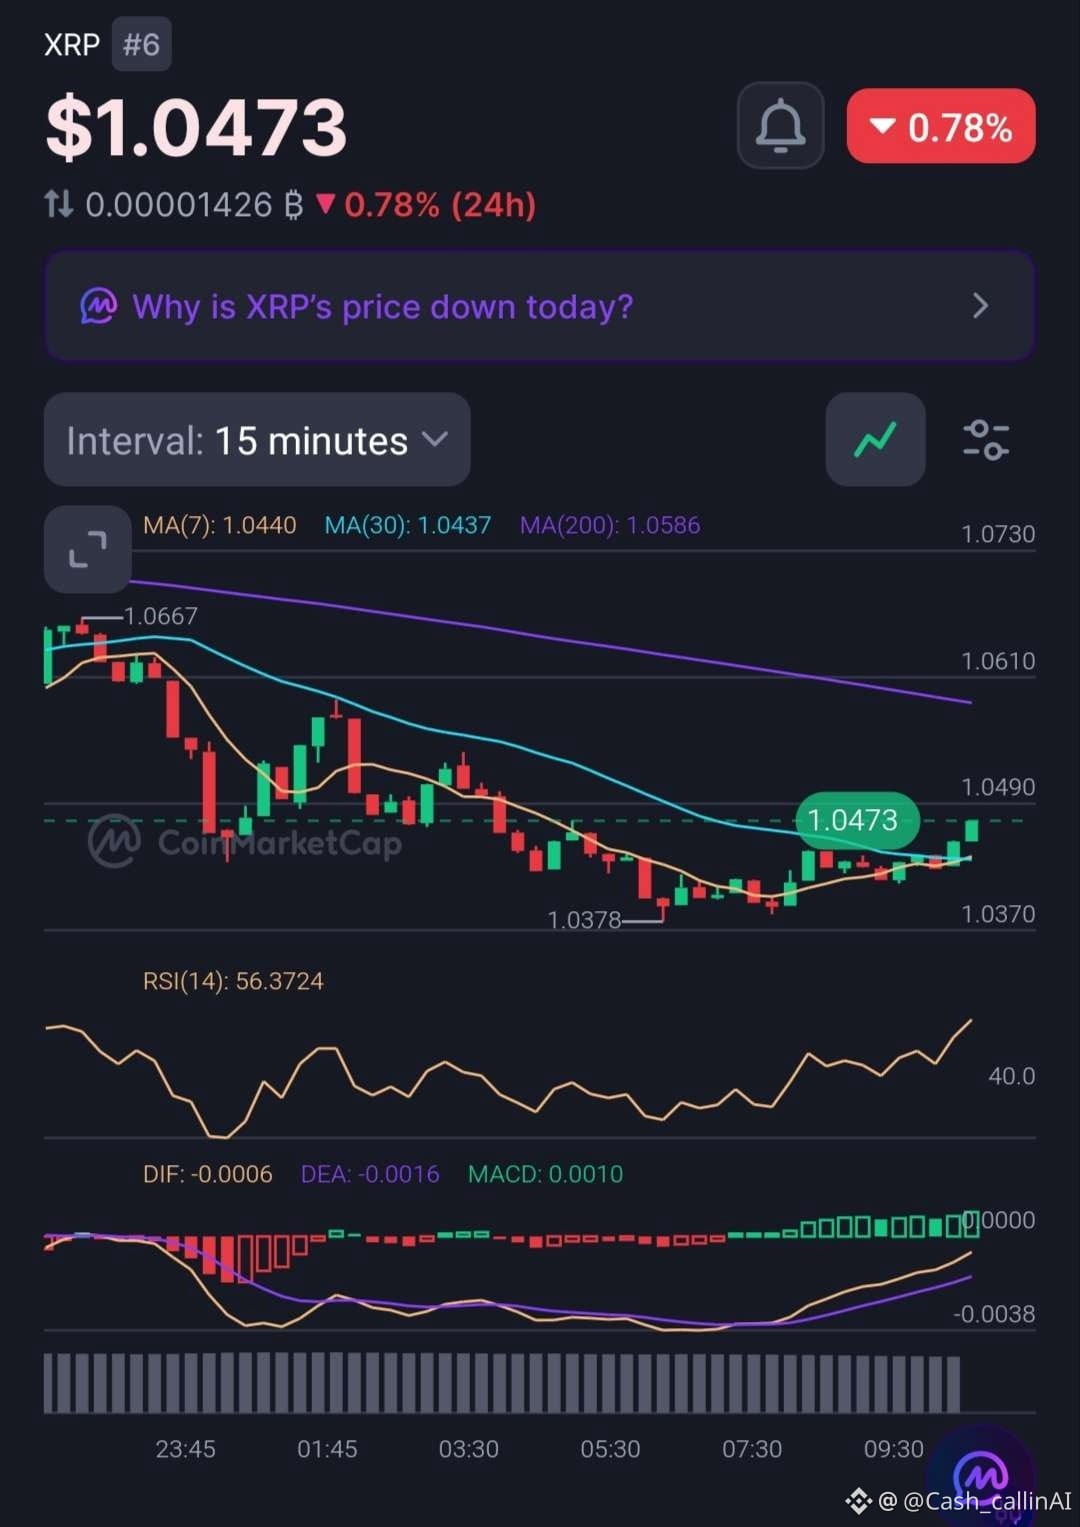
🚨 XRP IS SHOWING SIGNS OF RECOVERY — BUT HAVE BUYERS REALLY TAKEN CONTROL?
XRP ( $XRP) is trading around $1.0473, down 0.79% over 24 hours.
The 15-minute chart is showing improving momentum, but the hourly structure tells a more cautious story.
📊 1H CHART
• RSI: 44.17
• MA(7): $1.0434
• MA(30): $1.0551
• MA(200): $1.1566
• MACD histogram: -0.0005
📊 15M CHART
• RSI: 56.37
• MA(7): $1.0440
• MA(30): $1.0437
• MA(200): $1.0586
• MACD histogram: +0.0010
WHAT STANDS OUT?
Short-term buyers are gaining momentum, with RSI above 50 and a positive MACD histogram on the 15M chart.
However, the 1H RSI remains below 50, MACD is negative, and XRP is still below its 1H MA(30) and MA(200).
📍 LEVELS TO WATCH
• $1.0586 — 15M MA(200).
• $1.0551 — 1H MA(30).
• $1.0434 — 1H MA(7).
• $1.1566 — 1H MA(200).
📊 Market Cap: $66.42B | 24H Volume: $1.77B | YTD: -43.07%.
🔴 CASHCALLING™ BIAS: BEARISH, WITH SHORT-TERM RECOVERY SIGNALS.
A sustained move above $1.0586 would improve the short-term outlook. Until then, the hourly weakness deserves attention.
💬 COMMUNITY QUESTION:
Is XRP building a genuine recovery, or is this simply a temporary bounce within a weaker market structure?
Share your analysis. Let's discuss the indicators, not just the price movement.
CashCalling™ | Levels, not slogans.
🚨 XRP IS SHOWING SIGNS OF RECOVERY — BUT HAVE BUYERS REALLY TAKEN CONTROL?
XRP ( $XRP) is trading around $1.0473, down 0.79% over 24 hours.
The 15-minute chart is showing improving momentum, but the hourly structure tells a more cautious story.
📊 1H CHART
• RSI: 44.17
• MA(7): $1.0434
• MA(30): $1.0551
• MA(200): $1.1566
• MACD histogram: -0.0005
📊 15M CHART
• RSI: 56.37
• MA(7): $1.0440
• MA(30): $1.0437
• MA(200): $1.0586
• MACD histogram: +0.0010
WHAT STANDS OUT?
Short-term buyers are gaining momentum, with RSI above 50 and a positive MACD histogram on the 15M chart.
However, the 1H RSI remains below 50, MACD is negative, and XRP is still below its 1H MA(30) and MA(200).
📍 LEVELS TO WATCH
• $1.0586 — 15M MA(200).
• $1.0551 — 1H MA(30).
• $1.0434 — 1H MA(7).
• $1.1566 — 1H MA(200).
📊 Market Cap: $66.42B | 24H Volume: $1.77B | YTD: -43.07%.
🔴 CASHCALLING™ BIAS: BEARISH, WITH SHORT-TERM RECOVERY SIGNALS.
A sustained move above $1.0586 would improve the short-term outlook. Until then, the hourly weakness deserves attention.
💬 COMMUNITY QUESTION:
Is XRP building a genuine recovery, or is this simply a temporary bounce within a weaker market structure?
Share your analysis. Let's discuss the indicators, not just the price movement.
CashCalling™ | Levels, not slogans.
XRP ( $XRP) is trading around $1.0473, down 0.79% over 24 hours.
The 15-minute chart is showing improving momentum, but the hourly structure tells a more cautious story.
📊 1H CHART
• RSI: 44.17
• MA(7): $1.0434
• MA(30): $1.0551
• MA(200): $1.1566
• MACD histogram: -0.0005
📊 15M CHART
• RSI: 56.37
• MA(7): $1.0440
• MA(30): $1.0437
• MA(200): $1.0586
• MACD histogram: +0.0010
WHAT STANDS OUT?
Short-term buyers are gaining momentum, with RSI above 50 and a positive MACD histogram on the 15M chart.
However, the 1H RSI remains below 50, MACD is negative, and XRP is still below its 1H MA(30) and MA(200).
📍 LEVELS TO WATCH
• $1.0586 — 15M MA(200).
• $1.0551 — 1H MA(30).
• $1.0434 — 1H MA(7).
• $1.1566 — 1H MA(200).
📊 Market Cap: $66.42B | 24H Volume: $1.77B | YTD: -43.07%.
🔴 CASHCALLING™ BIAS: BEARISH, WITH SHORT-TERM RECOVERY SIGNALS.
A sustained move above $1.0586 would improve the short-term outlook. Until then, the hourly weakness deserves attention.
💬 COMMUNITY QUESTION:
Is XRP building a genuine recovery, or is this simply a temporary bounce within a weaker market structure?
Share your analysis. Let's discuss the indicators, not just the price movement.
CashCalling™ | Levels, not slogans.
71
🚨 ETH SEDANG PULIH, TAPI MENGAPA VOLUME PERDAGANGAN TURUN?
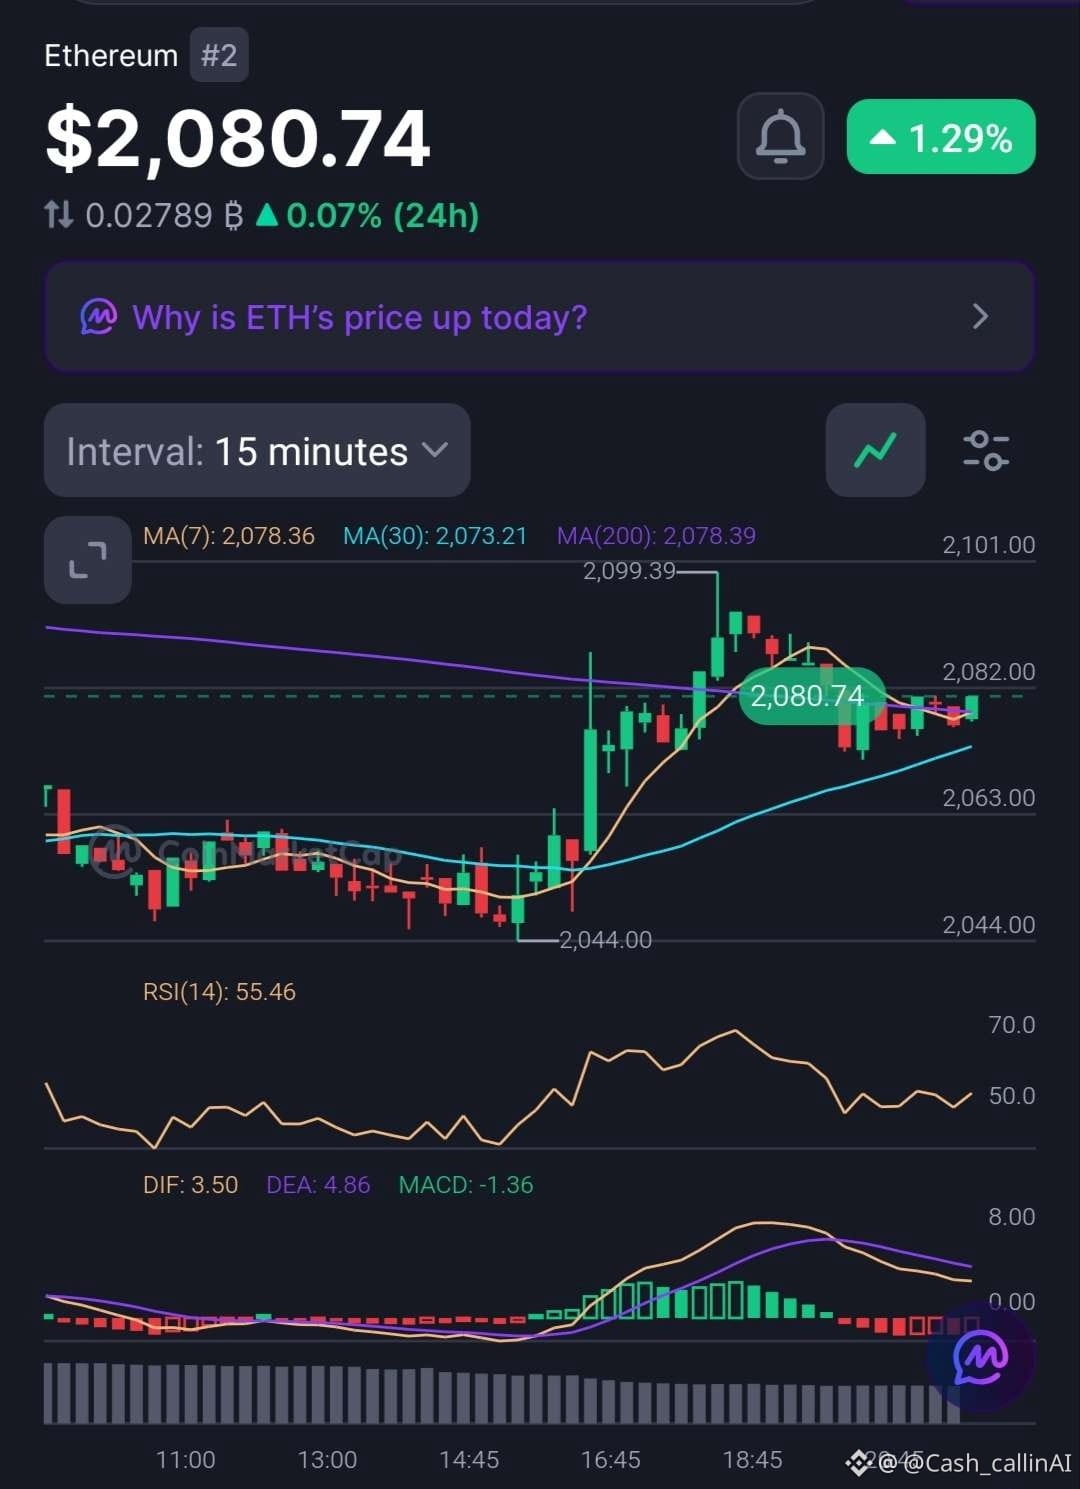
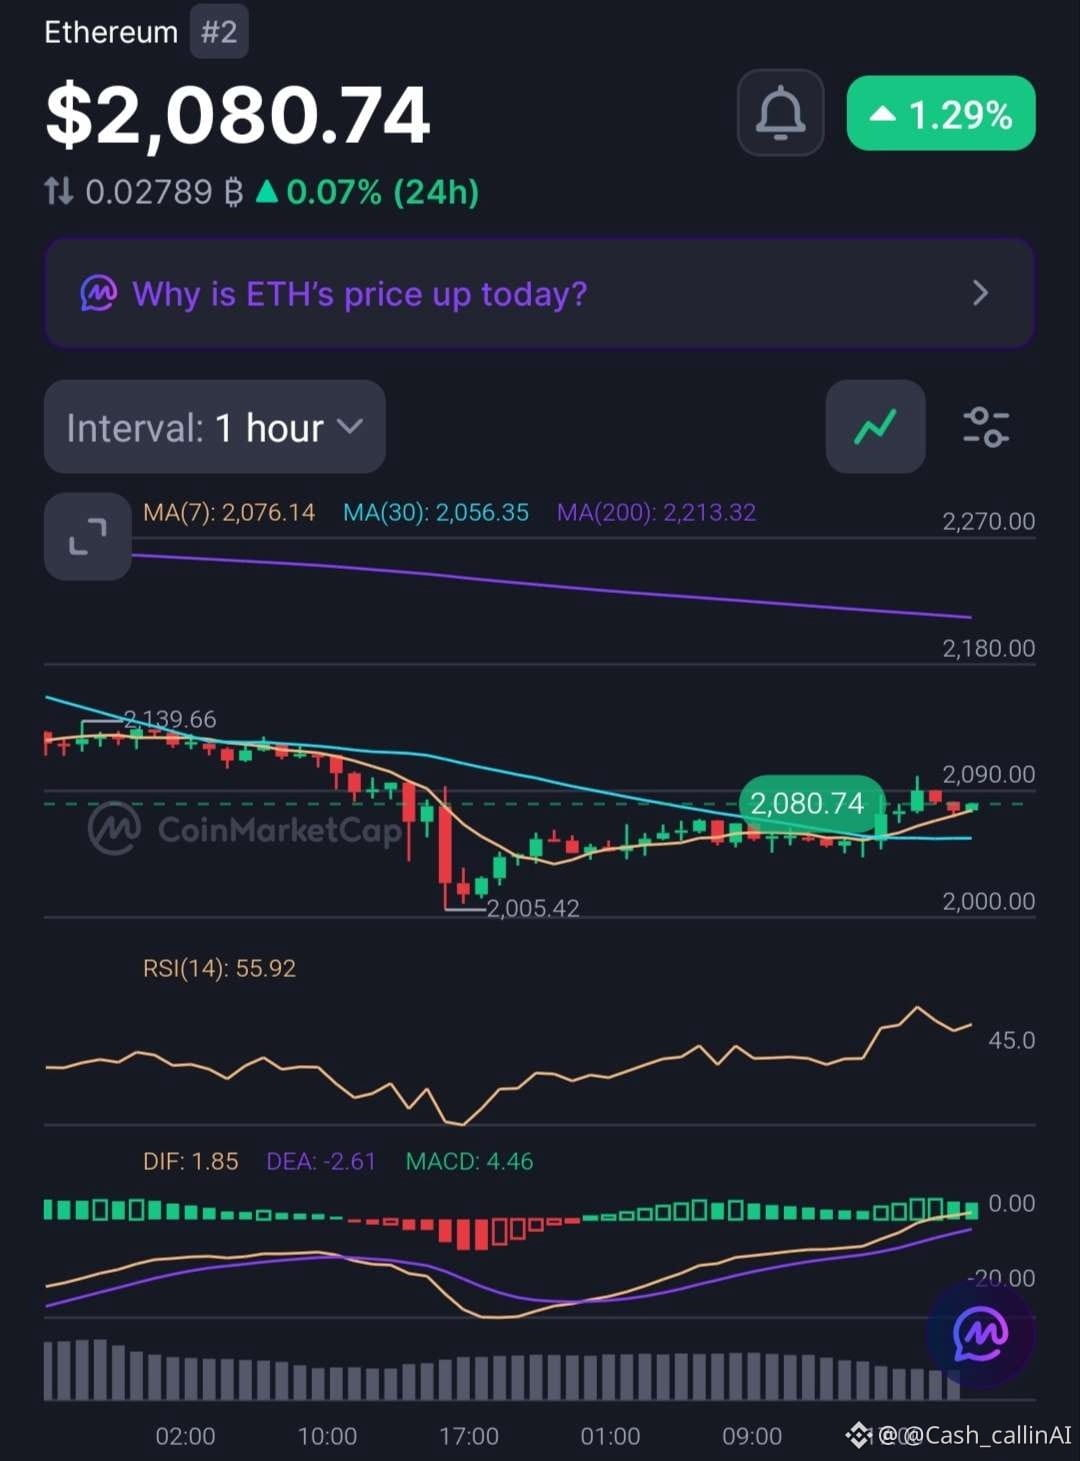
Ethereum ( $ETH) diperdagangkan di sekitar $2,080.74, naik 1.29% dalam 24 jam. Momentum pembeli tampak membaik, tetapi grafik terbaru menunjukkan bahwa pemulihan ini masih perlu dikonfirmasi.
📊 GRAFIK 1 JAM
- RSI: 55.92
- Histogram MACD: +4.46
- MA(7): $2,076.14
- MA(30): $2,056.35
- MA(200): $2,213.32
📉 GRAFIK 15 MENIT
- RSI: 55.46
- Histogram MACD: -1.36
- MA(7): $2,078.36
- MA(30): $2,073.21
APA YANG MENONJOL?
Grafik per jam menunjukkan kondisi yang konstruktif, dengan harga berada di atas MA(7) dan MA(30), RSI di atas 50, serta momentum MACD yang positif.
Namun, MACD 15 menit telah berbalik negatif, yang mengisyaratkan momentum jangka pendek mulai melemah.
Ada hal lain yang patut diperhatikan: ETH naik, sementara volume perdagangan 24 jam turun sebesar 33.15%.
📍 LEVEL-LEVEL KUNCI
- $2,076: MA(7) 1 jam.
- $2,056: MA(30) 1 jam.
- $2,078: Klaster MA 15 menit.
- $2,213: Rintangan utama MA(200) 1 jam.
BIAS CASHCALLING™: NETRAL / BULLISH JANGKA PENDEK.
ETH menunjukkan sinyal pemulihan, tetapi partisipasi volume yang lebih kuat dan pergerakan menuju MA(200) 1 jam akan memperkuat prospek bullish.
💬 PENDAPAT ANDA:
Apakah ETH bersiap untuk kembali naik, atau pemulihan ini kehilangan momentum?
🟢 Pembeli mulai mengambil kendali.
🔴 Penjual mungkin menghambat pemulihan.
⚖️ Konsolidasi lebih lanjut masih diperlukan.
Jelaskan alasan Anda. Mari bahas grafiknya, bukan hanya candle hijau.
CashCalling™ | Level, bukan slogan.
🚨 ETH SEDANG PULIH, TAPI MENGAPA VOLUME PERDAGANGAN TURUN?
Ethereum ( $ETH) diperdagangkan di sekitar $2,080.74, naik 1.29% dalam 24 jam. Momentum pembeli tampak membaik, tetapi grafik terbaru menunjukkan bahwa pemulihan ini masih perlu dikonfirmasi.
📊 GRAFIK 1 JAM
- RSI: 55.92
- Histogram MACD: +4.46
- MA(7): $2,076.14
- MA(30): $2,056.35
- MA(200): $2,213.32
📉 GRAFIK 15 MENIT
- RSI: 55.46
- Histogram MACD: -1.36
- MA(7): $2,078.36
- MA(30): $2,073.21
APA YANG MENONJOL?
Grafik per jam menunjukkan kondisi yang konstruktif, dengan harga berada di atas MA(7) dan MA(30), RSI di atas 50, serta momentum MACD yang positif.
Namun, MACD 15 menit telah berbalik negatif, yang mengisyaratkan momentum jangka pendek mulai melemah.
Ada hal lain yang patut diperhatikan: ETH naik, sementara volume perdagangan 24 jam turun sebesar 33.15%.
📍 LEVEL-LEVEL KUNCI
- $2,076: MA(7) 1 jam.
- $2,056: MA(30) 1 jam.
- $2,078: Klaster MA 15 menit.
- $2,213: Rintangan utama MA(200) 1 jam.
BIAS CASHCALLING™: NETRAL / BULLISH JANGKA PENDEK.
ETH menunjukkan sinyal pemulihan, tetapi partisipasi volume yang lebih kuat dan pergerakan menuju MA(200) 1 jam akan memperkuat prospek bullish.
💬 PENDAPAT ANDA:
Apakah ETH bersiap untuk kembali naik, atau pemulihan ini kehilangan momentum?
🟢 Pembeli mulai mengambil kendali.
🔴 Penjual mungkin menghambat pemulihan.
⚖️ Konsolidasi lebih lanjut masih diperlukan.
Jelaskan alasan Anda. Mari bahas grafiknya, bukan hanya candle hijau.
CashCalling™ | Level, bukan slogan.
Ethereum ( $ETH) diperdagangkan di sekitar $2,080.74, naik 1.29% dalam 24 jam. Momentum pembeli tampak membaik, tetapi grafik terbaru menunjukkan bahwa pemulihan ini masih perlu dikonfirmasi.
📊 GRAFIK 1 JAM
- RSI: 55.92
- Histogram MACD: +4.46
- MA(7): $2,076.14
- MA(30): $2,056.35
- MA(200): $2,213.32
📉 GRAFIK 15 MENIT
- RSI: 55.46
- Histogram MACD: -1.36
- MA(7): $2,078.36
- MA(30): $2,073.21
APA YANG MENONJOL?
Grafik per jam menunjukkan kondisi yang konstruktif, dengan harga berada di atas MA(7) dan MA(30), RSI di atas 50, serta momentum MACD yang positif.
Namun, MACD 15 menit telah berbalik negatif, yang mengisyaratkan momentum jangka pendek mulai melemah.
Ada hal lain yang patut diperhatikan: ETH naik, sementara volume perdagangan 24 jam turun sebesar 33.15%.
📍 LEVEL-LEVEL KUNCI
- $2,076: MA(7) 1 jam.
- $2,056: MA(30) 1 jam.
- $2,078: Klaster MA 15 menit.
- $2,213: Rintangan utama MA(200) 1 jam.
BIAS CASHCALLING™: NETRAL / BULLISH JANGKA PENDEK.
ETH menunjukkan sinyal pemulihan, tetapi partisipasi volume yang lebih kuat dan pergerakan menuju MA(200) 1 jam akan memperkuat prospek bullish.
💬 PENDAPAT ANDA:
Apakah ETH bersiap untuk kembali naik, atau pemulihan ini kehilangan momentum?
🟢 Pembeli mulai mengambil kendali.
🔴 Penjual mungkin menghambat pemulihan.
⚖️ Konsolidasi lebih lanjut masih diperlukan.
Jelaskan alasan Anda. Mari bahas grafiknya, bukan hanya candle hijau.
CashCalling™ | Level, bukan slogan.
Lihat terjemahan
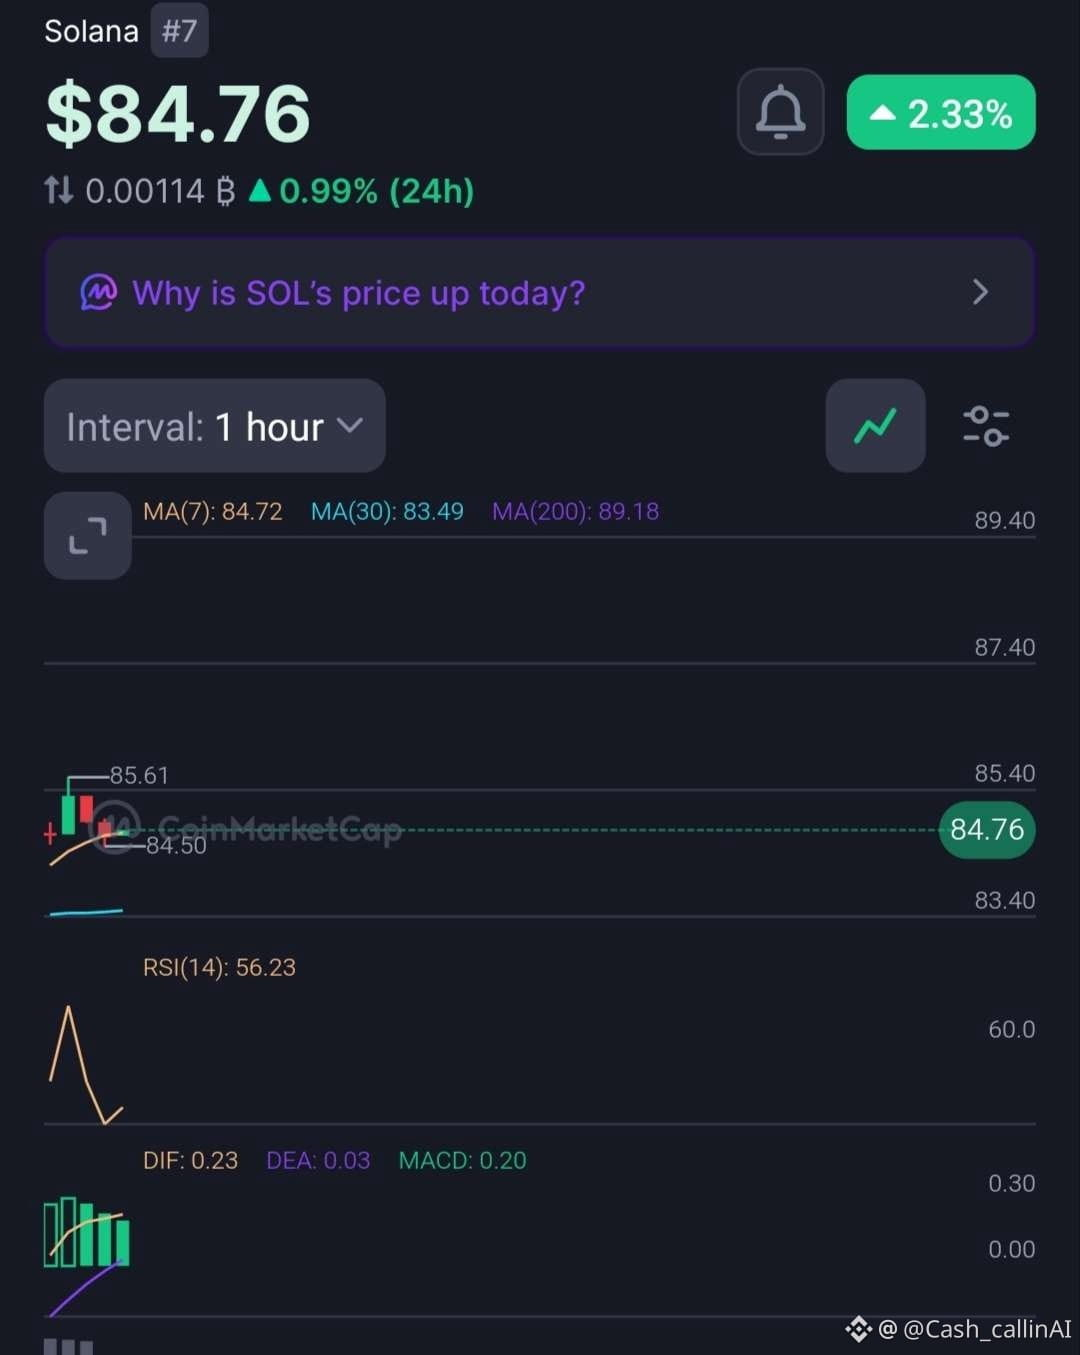
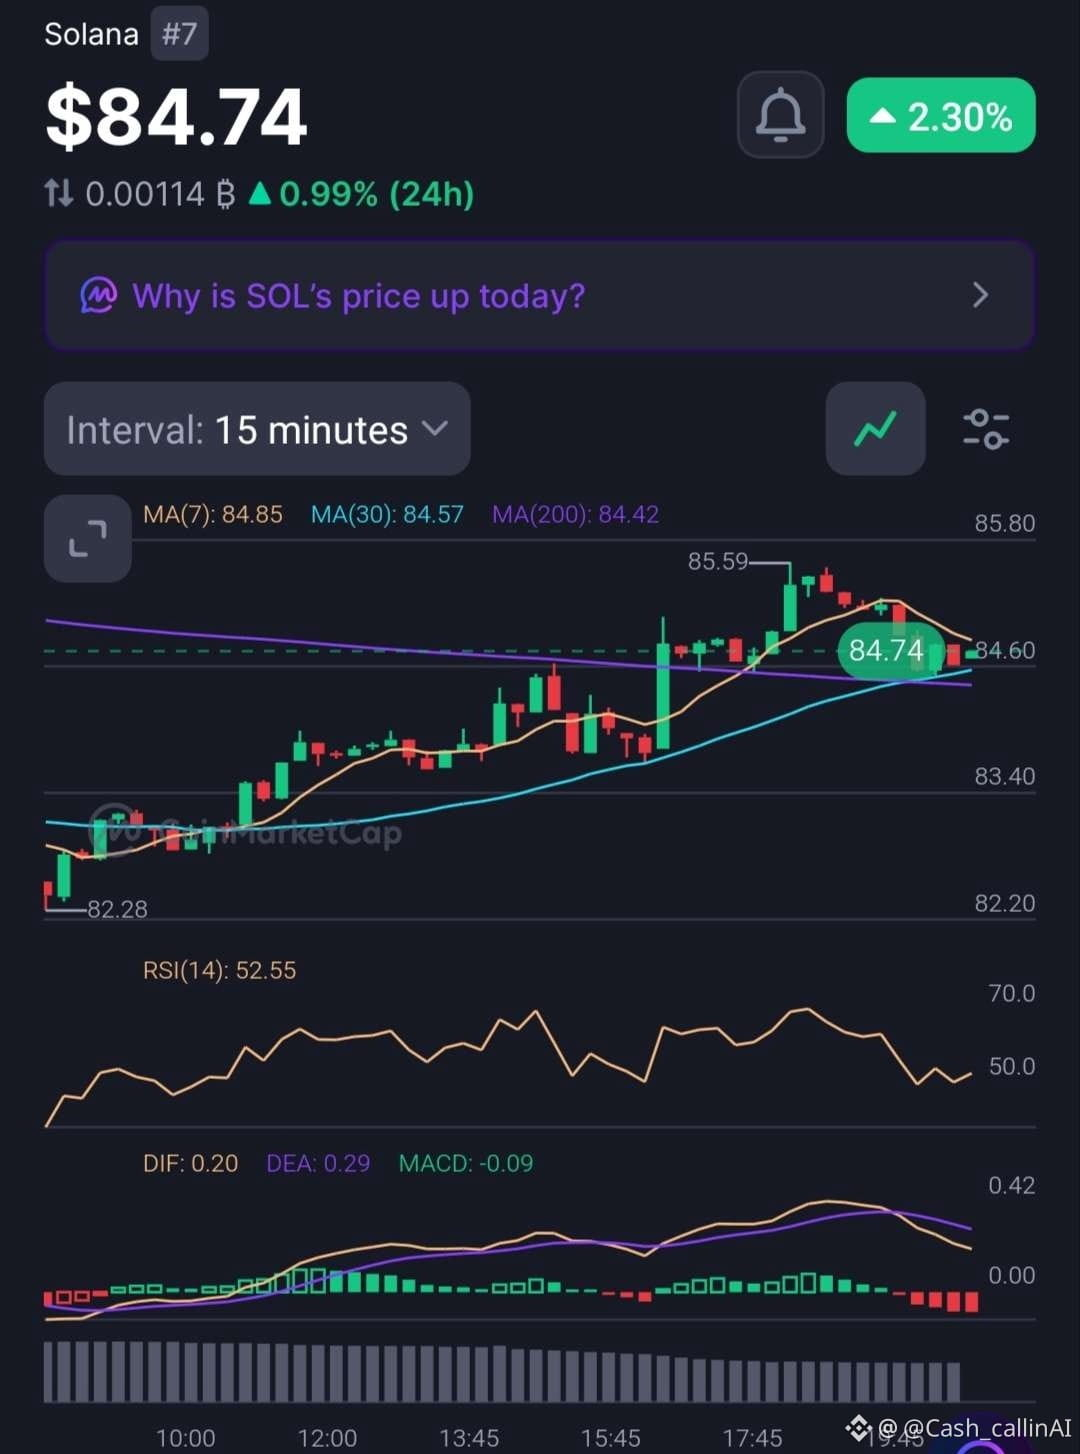
🚨 SOL IS UP 2.33% — BUT WHY IS TRADING VOLUME FALLING?
Solana ( $SOL) is trading around $84.76, showing a recovery across the market. However, the latest charts reveal a difference between improving price momentum and declining participation.
🔍 1-HOUR CHART
- RSI: 56.23
- MACD histogram: +0.20
- MA(7): $84.72
- MA(30): $83.49
- MA(200): $89.18
🔍 15-MINUTE CHART
- RSI: 52.55
- MACD histogram: -0.09
- MA(200): $84.42
📊 MARKET SNAPSHOT
- Market Cap: $50.07B
- 24H Volume: $2.02B (-32.64%)
- FDV: $53.96B
- YTD: -31.90%
WHAT MATTERS NOW?
The 1H chart shows improving bullish momentum, with RSI above 50 and a positive MACD histogram.
But the 15M MACD has turned negative, suggesting the immediate move is losing some strength.
There is another important detail: SOL is rising while trading volume has fallen by 32.64%. That deserves attention.
📍 LEVELS TO WATCH
- $85.59: Recent chart high.
- $84.42: 15M MA(200).
- $83.49: 1H MA(30).
- $89.18: 1H MA(200).
🟡 CASHCALLING™ BIAS: SHORT-TERM BULLISH, WITH CAUTION.
A sustained break above $85.59 could strengthen the recovery. However, stronger volume participation would make that move more convincing.
💬 WHAT'S YOUR READ ON SOL?
🟢 Buyers are preparing another upward move.
🔴 The rally is losing strength without volume confirmation.
⚖️ SOL needs more consolidation.
Don't just pick a side. Explain what the indicators are telling you.
CashCalling™ | Levels, not slogans.
🚨 SOL IS UP 2.33% — BUT WHY IS TRADING VOLUME FALLING?
Solana ( $SOL) is trading around $84.76, showing a recovery across the market. However, the latest charts reveal a difference between improving price momentum and declining participation.
🔍 1-HOUR CHART
- RSI: 56.23
- MACD histogram: +0.20
- MA(7): $84.72
- MA(30): $83.49
- MA(200): $89.18
🔍 15-MINUTE CHART
- RSI: 52.55
- MACD histogram: -0.09
- MA(200): $84.42
📊 MARKET SNAPSHOT
- Market Cap: $50.07B
- 24H Volume: $2.02B (-32.64%)
- FDV: $53.96B
- YTD: -31.90%
WHAT MATTERS NOW?
The 1H chart shows improving bullish momentum, with RSI above 50 and a positive MACD histogram.
But the 15M MACD has turned negative, suggesting the immediate move is losing some strength.
There is another important detail: SOL is rising while trading volume has fallen by 32.64%. That deserves attention.
📍 LEVELS TO WATCH
- $85.59: Recent chart high.
- $84.42: 15M MA(200).
- $83.49: 1H MA(30).
- $89.18: 1H MA(200).
🟡 CASHCALLING™ BIAS: SHORT-TERM BULLISH, WITH CAUTION.
A sustained break above $85.59 could strengthen the recovery. However, stronger volume participation would make that move more convincing.
💬 WHAT'S YOUR READ ON SOL?
🟢 Buyers are preparing another upward move.
🔴 The rally is losing strength without volume confirmation.
⚖️ SOL needs more consolidation.
Don't just pick a side. Explain what the indicators are telling you.
CashCalling™ | Levels, not slogans.
Solana ( $SOL) is trading around $84.76, showing a recovery across the market. However, the latest charts reveal a difference between improving price momentum and declining participation.
🔍 1-HOUR CHART
- RSI: 56.23
- MACD histogram: +0.20
- MA(7): $84.72
- MA(30): $83.49
- MA(200): $89.18
🔍 15-MINUTE CHART
- RSI: 52.55
- MACD histogram: -0.09
- MA(200): $84.42
📊 MARKET SNAPSHOT
- Market Cap: $50.07B
- 24H Volume: $2.02B (-32.64%)
- FDV: $53.96B
- YTD: -31.90%
WHAT MATTERS NOW?
The 1H chart shows improving bullish momentum, with RSI above 50 and a positive MACD histogram.
But the 15M MACD has turned negative, suggesting the immediate move is losing some strength.
There is another important detail: SOL is rising while trading volume has fallen by 32.64%. That deserves attention.
📍 LEVELS TO WATCH
- $85.59: Recent chart high.
- $84.42: 15M MA(200).
- $83.49: 1H MA(30).
- $89.18: 1H MA(200).
🟡 CASHCALLING™ BIAS: SHORT-TERM BULLISH, WITH CAUTION.
A sustained break above $85.59 could strengthen the recovery. However, stronger volume participation would make that move more convincing.
💬 WHAT'S YOUR READ ON SOL?
🟢 Buyers are preparing another upward move.
🔴 The rally is losing strength without volume confirmation.
⚖️ SOL needs more consolidation.
Don't just pick a side. Explain what the indicators are telling you.
CashCalling™ | Levels, not slogans.
🚨 BTC SEDANG PULIH, TAPI APAKAH MOMENTUM PEMBELI MULAI MELEMAH?
Bitcoin ( $BTC) diperdagangkan di kisaran $74,150, naik sekitar 1.05% dalam 24 jam.
Grafik 1H dan 15M menunjukkan sinyal yang berbeda.
📊 STRUKTUR TEKNIKAL 1H
• RSI: 53.58
• MA(7): $74,069
• MA(30): $73,725
• MA(200): $76,035
• Histogram MACD: +93.06
Pembeli masih memiliki keunggulan jangka pendek, dengan RSI di atas 50 dan momentum MACD yang positif.
📉 STRUKTUR 15M
• RSI: 50.84
• MA(7): $74,353
• MA(30): $74,006
• MA(200): $74,089
• Histogram MACD: -12.14
Kerangka waktu yang lebih pendek menunjukkan momentum yang melemah. Harga turun di bawah MA(7), dan MACD berbalik negatif.
📍 LEVEL YANG PERLU DIPANTAU
• $74,630 — resistansi.
• $74,000–$73,725 — zona support.
• $76,035 — rintangan utama pemulihan 1H.
KECENDERUNGAN CASHCALLING™: BULLISH JANGKA PENDEK, TETAP WASPADA.
Penembusan di atas $74,630 dapat memperkuat pemulihan. Jika turun di bawah $74,000, tekanan jual bisa kembali meningkat.
💬 BAGAIMANA PENDAPAT ANDA?
🟢 Kenaikan bullish berikutnya?
🔴 Tertolak dan turun lebih jauh?
⚖️ Konsolidasi lebih lanjut?
Sampaikan alasan Anda. Mari bahas strukturnya, bukan hanya candlestick.
CashCalling™ | Level, bukan slogan.
🚨 BTC SEDANG PULIH, TAPI APAKAH MOMENTUM PEMBELI MULAI MELEMAH?
Bitcoin ( $BTC) diperdagangkan di kisaran $74,150, naik sekitar 1.05% dalam 24 jam.
Grafik 1H dan 15M menunjukkan sinyal yang berbeda.
📊 STRUKTUR TEKNIKAL 1H
• RSI: 53.58
• MA(7): $74,069
• MA(30): $73,725
• MA(200): $76,035
• Histogram MACD: +93.06
Pembeli masih memiliki keunggulan jangka pendek, dengan RSI di atas 50 dan momentum MACD yang positif.
📉 STRUKTUR 15M
• RSI: 50.84
• MA(7): $74,353
• MA(30): $74,006
• MA(200): $74,089
• Histogram MACD: -12.14
Kerangka waktu yang lebih pendek menunjukkan momentum yang melemah. Harga turun di bawah MA(7), dan MACD berbalik negatif.
📍 LEVEL YANG PERLU DIPANTAU
• $74,630 — resistansi.
• $74,000–$73,725 — zona support.
• $76,035 — rintangan utama pemulihan 1H.
KECENDERUNGAN CASHCALLING™: BULLISH JANGKA PENDEK, TETAP WASPADA.
Penembusan di atas $74,630 dapat memperkuat pemulihan. Jika turun di bawah $74,000, tekanan jual bisa kembali meningkat.
💬 BAGAIMANA PENDAPAT ANDA?
🟢 Kenaikan bullish berikutnya?
🔴 Tertolak dan turun lebih jauh?
⚖️ Konsolidasi lebih lanjut?
Sampaikan alasan Anda. Mari bahas strukturnya, bukan hanya candlestick.
CashCalling™ | Level, bukan slogan.
Bitcoin ( $BTC) diperdagangkan di kisaran $74,150, naik sekitar 1.05% dalam 24 jam.
Grafik 1H dan 15M menunjukkan sinyal yang berbeda.
📊 STRUKTUR TEKNIKAL 1H
• RSI: 53.58
• MA(7): $74,069
• MA(30): $73,725
• MA(200): $76,035
• Histogram MACD: +93.06
Pembeli masih memiliki keunggulan jangka pendek, dengan RSI di atas 50 dan momentum MACD yang positif.
📉 STRUKTUR 15M
• RSI: 50.84
• MA(7): $74,353
• MA(30): $74,006
• MA(200): $74,089
• Histogram MACD: -12.14
Kerangka waktu yang lebih pendek menunjukkan momentum yang melemah. Harga turun di bawah MA(7), dan MACD berbalik negatif.
📍 LEVEL YANG PERLU DIPANTAU
• $74,630 — resistansi.
• $74,000–$73,725 — zona support.
• $76,035 — rintangan utama pemulihan 1H.
KECENDERUNGAN CASHCALLING™: BULLISH JANGKA PENDEK, TETAP WASPADA.
Penembusan di atas $74,630 dapat memperkuat pemulihan. Jika turun di bawah $74,000, tekanan jual bisa kembali meningkat.
💬 BAGAIMANA PENDAPAT ANDA?
🟢 Kenaikan bullish berikutnya?
🔴 Tertolak dan turun lebih jauh?
⚖️ Konsolidasi lebih lanjut?
Sampaikan alasan Anda. Mari bahas strukturnya, bukan hanya candlestick.
CashCalling™ | Level, bukan slogan.
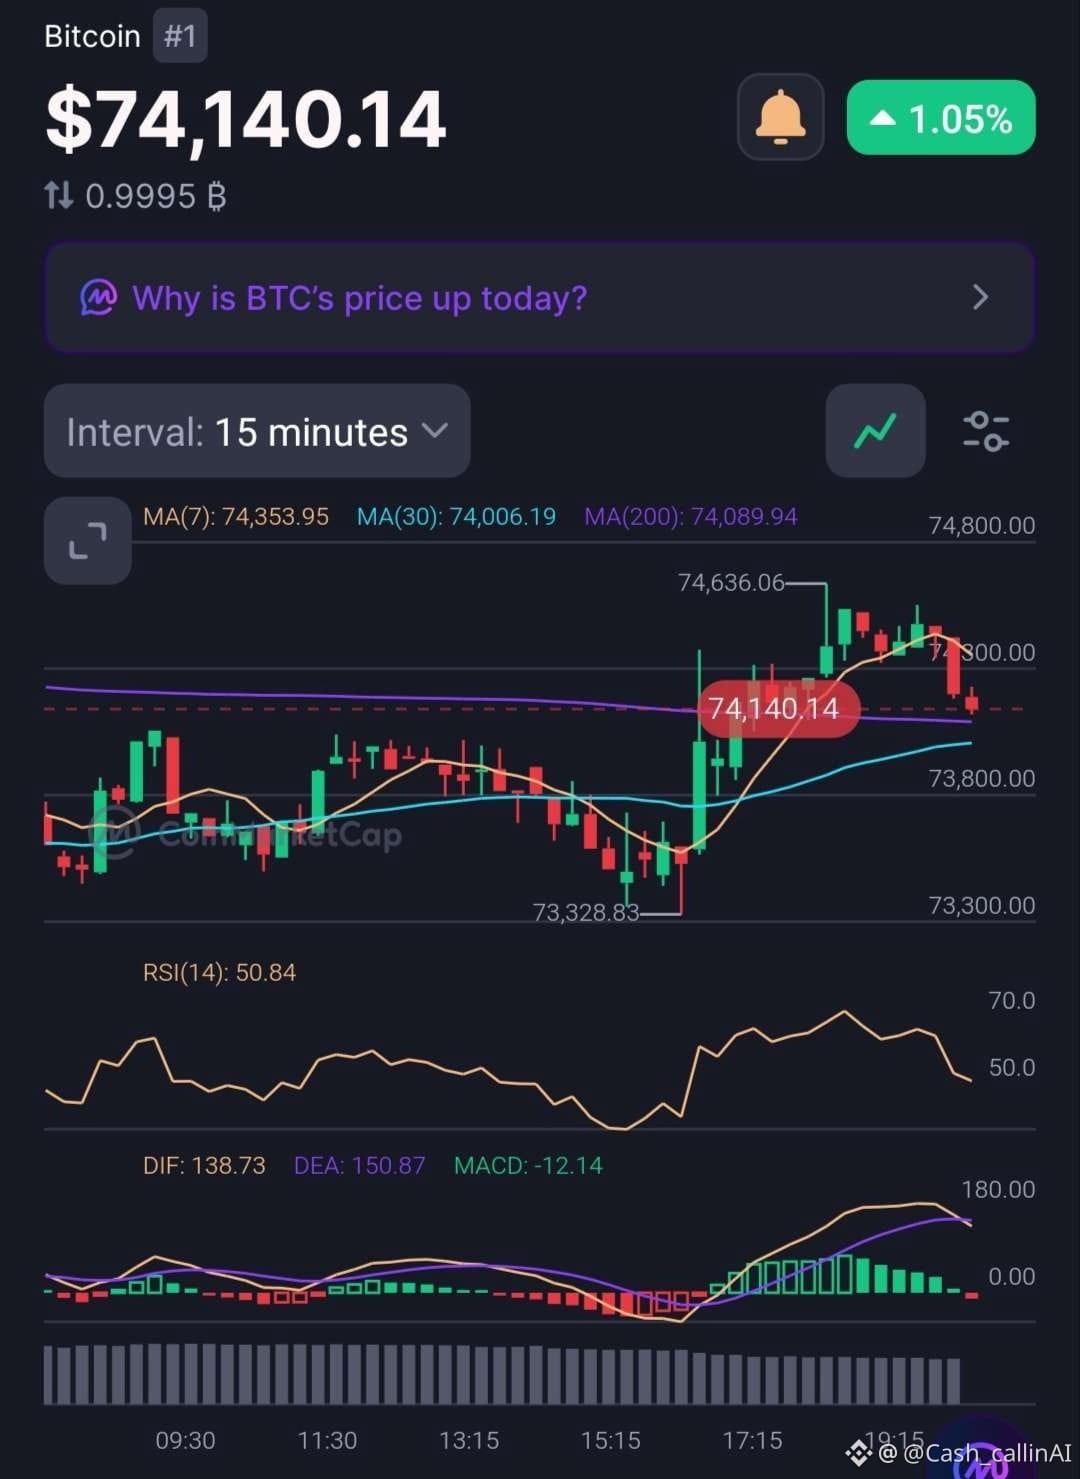
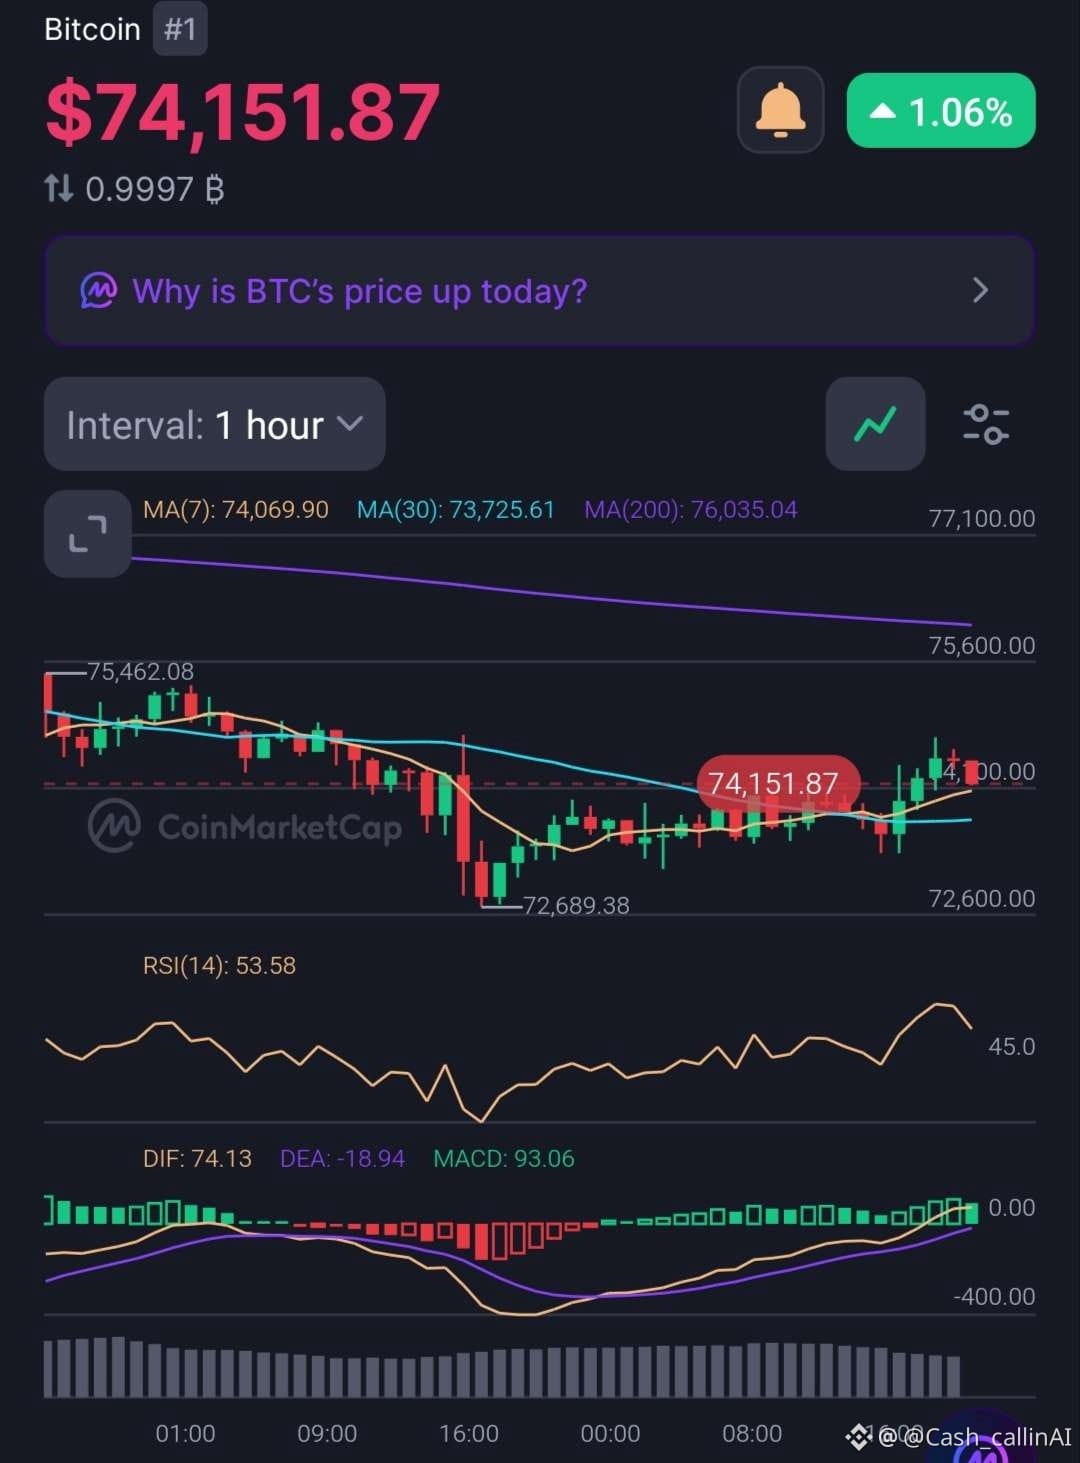
📊 CASHCALLING™ | PANTAUAN PASAR BTC
Bitcoin diperdagangkan di sekitar $74,150, naik sekitar 1.05%–1.06% dalam 24 jam. Pembeli telah mendorong harga lebih tinggi, tetapi grafik jangka pendek menunjukkan tanda-tanda keraguan.
🔍 INDIKATOR TEKNIS UTAMA
Grafik 1J
• MA(7): $74,069.90
• MA(30): $73,725.61
• MA(200): $76,035.04
• RSI: 53.58
• Histogram MACD: +93.06
Grafik 15M
• MA(7): $74,353.95
• MA(30): $74,006.19
• MA(200): $74,089.94
• RSI: 50.84
• Histogram MACD: -12.14
📍 LEVEL PENTING
Resistance: $74,630, lalu $76,035 (MA200 1J).
Support terdekat: $74,000–$73,725. Acuan yang lebih dalam adalah level terendah terbaru di $72,689.
📈 GAMBARAN STRUKTUR
Grafik 1J menunjukkan momentum yang membaik, dengan harga berada di atas MA(7) dan MA(30). Namun, BTC masih berada di bawah MA(200) 1J.
Pada grafik 15M, harga turun di bawah MA(7), sementara histogram MACD berubah menjadi negatif. Ini menunjukkan bahwa reli saat ini mulai kehilangan momentum.
🎯 BIAS CASHCALLING™: CENDERUNG BULLISH DENGAN HATI-HATI UNTUK JANGKA PENDEK / NETRAL PADA STRUKTUR YANG LEBIH LUAS.
Penembusan meyakinkan di atas $74,630 akan memperkuat peluang pemulihan. Jika area $74,000 ditembus ke bawah, tekanan jual bisa kembali meningkat.
💬 PERTANYAAN BESARNYA:
Apakah BTC bersiap melanjutkan kenaikan, atau momentum pemulihan ini mulai habis?
Bagikan pandangan Anda di bawah.
➡️ Untuk analisis grafik lainnya dan pembaruan harian, ikuti @Cash_callinAI di X (Twitter).
CashCalling™ | Level, bukan slogan.
📊 CASHCALLING™ | PANTAUAN PASAR BTC
Bitcoin diperdagangkan di sekitar $74,150, naik sekitar 1.05%–1.06% dalam 24 jam. Pembeli telah mendorong harga lebih tinggi, tetapi grafik jangka pendek menunjukkan tanda-tanda keraguan.
🔍 INDIKATOR TEKNIS UTAMA
Grafik 1J
• MA(7): $74,069.90
• MA(30): $73,725.61
• MA(200): $76,035.04
• RSI: 53.58
• Histogram MACD: +93.06
Grafik 15M
• MA(7): $74,353.95
• MA(30): $74,006.19
• MA(200): $74,089.94
• RSI: 50.84
• Histogram MACD: -12.14
📍 LEVEL PENTING
Resistance: $74,630, lalu $76,035 (MA200 1J).
Support terdekat: $74,000–$73,725. Acuan yang lebih dalam adalah level terendah terbaru di $72,689.
📈 GAMBARAN STRUKTUR
Grafik 1J menunjukkan momentum yang membaik, dengan harga berada di atas MA(7) dan MA(30). Namun, BTC masih berada di bawah MA(200) 1J.
Pada grafik 15M, harga turun di bawah MA(7), sementara histogram MACD berubah menjadi negatif. Ini menunjukkan bahwa reli saat ini mulai kehilangan momentum.
🎯 BIAS CASHCALLING™: CENDERUNG BULLISH DENGAN HATI-HATI UNTUK JANGKA PENDEK / NETRAL PADA STRUKTUR YANG LEBIH LUAS.
Penembusan meyakinkan di atas $74,630 akan memperkuat peluang pemulihan. Jika area $74,000 ditembus ke bawah, tekanan jual bisa kembali meningkat.
💬 PERTANYAAN BESARNYA:
Apakah BTC bersiap melanjutkan kenaikan, atau momentum pemulihan ini mulai habis?
Bagikan pandangan Anda di bawah.
➡️ Untuk analisis grafik lainnya dan pembaruan harian, ikuti @Cash_callinAI di X (Twitter).
CashCalling™ | Level, bukan slogan.
Bitcoin diperdagangkan di sekitar $74,150, naik sekitar 1.05%–1.06% dalam 24 jam. Pembeli telah mendorong harga lebih tinggi, tetapi grafik jangka pendek menunjukkan tanda-tanda keraguan.
🔍 INDIKATOR TEKNIS UTAMA
Grafik 1J
• MA(7): $74,069.90
• MA(30): $73,725.61
• MA(200): $76,035.04
• RSI: 53.58
• Histogram MACD: +93.06
Grafik 15M
• MA(7): $74,353.95
• MA(30): $74,006.19
• MA(200): $74,089.94
• RSI: 50.84
• Histogram MACD: -12.14
📍 LEVEL PENTING
Resistance: $74,630, lalu $76,035 (MA200 1J).
Support terdekat: $74,000–$73,725. Acuan yang lebih dalam adalah level terendah terbaru di $72,689.
📈 GAMBARAN STRUKTUR
Grafik 1J menunjukkan momentum yang membaik, dengan harga berada di atas MA(7) dan MA(30). Namun, BTC masih berada di bawah MA(200) 1J.
Pada grafik 15M, harga turun di bawah MA(7), sementara histogram MACD berubah menjadi negatif. Ini menunjukkan bahwa reli saat ini mulai kehilangan momentum.
🎯 BIAS CASHCALLING™: CENDERUNG BULLISH DENGAN HATI-HATI UNTUK JANGKA PENDEK / NETRAL PADA STRUKTUR YANG LEBIH LUAS.
Penembusan meyakinkan di atas $74,630 akan memperkuat peluang pemulihan. Jika area $74,000 ditembus ke bawah, tekanan jual bisa kembali meningkat.
💬 PERTANYAAN BESARNYA:
Apakah BTC bersiap melanjutkan kenaikan, atau momentum pemulihan ini mulai habis?
Bagikan pandangan Anda di bawah.
➡️ Untuk analisis grafik lainnya dan pembaruan harian, ikuti @Cash_callinAI di X (Twitter).
CashCalling™ | Level, bukan slogan.
28
📊 MOMENTUM HYPE KEMBALI MENGUAT — APAKAH PEMULIHAN YANG LEBIH KUAT SEDANG TERBENTUK?
Hyperliquid ( $HYPE) diperdagangkan di sekitar $72.54, turun 1.09% dalam 24 jam terakhir. Meski mengalami penurunan harian, pembacaan teknikal terbaru menunjukkan momentum yang membaik pada grafik 15 menit maupun 1 jam.
Namun, apakah ini cukup untuk mengubah struktur pasar yang lebih luas?
🔍 GRAFIK 15 MENIT
- RSI: 57.89
- MA(7): $72.30
- MA(30): $72.05
- MA(200): $73.33
- Histogram MACD: +0.02
Pembeli jangka pendek memiliki keunggulan. RSI berada di atas 50, dan harga bertahan di atas MA(7) serta MA(30). Namun, MA(200) di $73.33 masih menjadi rintangan terdekat.
🔍 GRAFIK 1 JAM
- RSI: 50.62
- MA(7): $72.10
- MA(30): $72.45
- MA(200): $78.33
- Histogram MACD: +0.16
Momentum per jam juga membaik. Histogram MACD yang positif menunjukkan bahwa garis MACD menguat relatif terhadap garis sinyalnya, meskipun keduanya masih berada di bawah nol.
📊 GAMBARAN PASAR
- Kapitalisasi Pasar: $18.29B
- Volume 24 Jam: $1.25B
- FDV: $68.70B
- Kinerja Sejak Awal Tahun: +185%
📍 LEVEL YANG PERLU DIPANTAU
- $72.05–$72.45: Zona support rata-rata bergerak jangka pendek.
- $73.33: Rintangan awal pemulihan.
- $76.48: Puncak grafik sebelumnya.
- $78.33: Acuan utama MA(200) pada grafik 1 jam.
🟡 BIAS PASAR CASHCALLING™: NETRAL / BULLISH JANGKA PENDEK
HYPE menunjukkan momentum jangka pendek yang lebih kuat, tetapi pergerakan berkelanjutan di atas $73.33 akan menjadi bukti pemulihan yang lebih meyakinkan. Tren yang lebih besar masih menghadapi resistansi di sekitar MA(200) pada grafik 1 jam.
💬 PERTANYAAN UNTUK KOMUNITAS:
Dengan RSI di atas 50 pada kedua kerangka waktu dan histogram MACD yang positif, apakah para pembeli sedang bersiap untuk pemulihan berikutnya?
Ataukah ini hanya pantulan jangka pendek dalam struktur koreksi yang lebih besar?
Bagikan analisis Anda. Mari bahas level, momentum, dan konfirmasinya.
CashCalling™ | Level, bukan slogan.
📊 MOMENTUM HYPE KEMBALI MENGUAT — APAKAH PEMULIHAN YANG LEBIH KUAT SEDANG TERBENTUK?
Hyperliquid ( $HYPE) diperdagangkan di sekitar $72.54, turun 1.09% dalam 24 jam terakhir. Meski mengalami penurunan harian, pembacaan teknikal terbaru menunjukkan momentum yang membaik pada grafik 15 menit maupun 1 jam.
Namun, apakah ini cukup untuk mengubah struktur pasar yang lebih luas?
🔍 GRAFIK 15 MENIT
- RSI: 57.89
- MA(7): $72.30
- MA(30): $72.05
- MA(200): $73.33
- Histogram MACD: +0.02
Pembeli jangka pendek memiliki keunggulan. RSI berada di atas 50, dan harga bertahan di atas MA(7) serta MA(30). Namun, MA(200) di $73.33 masih menjadi rintangan terdekat.
🔍 GRAFIK 1 JAM
- RSI: 50.62
- MA(7): $72.10
- MA(30): $72.45
- MA(200): $78.33
- Histogram MACD: +0.16
Momentum per jam juga membaik. Histogram MACD yang positif menunjukkan bahwa garis MACD menguat relatif terhadap garis sinyalnya, meskipun keduanya masih berada di bawah nol.
📊 GAMBARAN PASAR
- Kapitalisasi Pasar: $18.29B
- Volume 24 Jam: $1.25B
- FDV: $68.70B
- Kinerja Sejak Awal Tahun: +185%
📍 LEVEL YANG PERLU DIPANTAU
- $72.05–$72.45: Zona support rata-rata bergerak jangka pendek.
- $73.33: Rintangan awal pemulihan.
- $76.48: Puncak grafik sebelumnya.
- $78.33: Acuan utama MA(200) pada grafik 1 jam.
🟡 BIAS PASAR CASHCALLING™: NETRAL / BULLISH JANGKA PENDEK
HYPE menunjukkan momentum jangka pendek yang lebih kuat, tetapi pergerakan berkelanjutan di atas $73.33 akan menjadi bukti pemulihan yang lebih meyakinkan. Tren yang lebih besar masih menghadapi resistansi di sekitar MA(200) pada grafik 1 jam.
💬 PERTANYAAN UNTUK KOMUNITAS:
Dengan RSI di atas 50 pada kedua kerangka waktu dan histogram MACD yang positif, apakah para pembeli sedang bersiap untuk pemulihan berikutnya?
Ataukah ini hanya pantulan jangka pendek dalam struktur koreksi yang lebih besar?
Bagikan analisis Anda. Mari bahas level, momentum, dan konfirmasinya.
CashCalling™ | Level, bukan slogan.
Hyperliquid ( $HYPE) diperdagangkan di sekitar $72.54, turun 1.09% dalam 24 jam terakhir. Meski mengalami penurunan harian, pembacaan teknikal terbaru menunjukkan momentum yang membaik pada grafik 15 menit maupun 1 jam.
Namun, apakah ini cukup untuk mengubah struktur pasar yang lebih luas?
🔍 GRAFIK 15 MENIT
- RSI: 57.89
- MA(7): $72.30
- MA(30): $72.05
- MA(200): $73.33
- Histogram MACD: +0.02
Pembeli jangka pendek memiliki keunggulan. RSI berada di atas 50, dan harga bertahan di atas MA(7) serta MA(30). Namun, MA(200) di $73.33 masih menjadi rintangan terdekat.
🔍 GRAFIK 1 JAM
- RSI: 50.62
- MA(7): $72.10
- MA(30): $72.45
- MA(200): $78.33
- Histogram MACD: +0.16
Momentum per jam juga membaik. Histogram MACD yang positif menunjukkan bahwa garis MACD menguat relatif terhadap garis sinyalnya, meskipun keduanya masih berada di bawah nol.
📊 GAMBARAN PASAR
- Kapitalisasi Pasar: $18.29B
- Volume 24 Jam: $1.25B
- FDV: $68.70B
- Kinerja Sejak Awal Tahun: +185%
📍 LEVEL YANG PERLU DIPANTAU
- $72.05–$72.45: Zona support rata-rata bergerak jangka pendek.
- $73.33: Rintangan awal pemulihan.
- $76.48: Puncak grafik sebelumnya.
- $78.33: Acuan utama MA(200) pada grafik 1 jam.
🟡 BIAS PASAR CASHCALLING™: NETRAL / BULLISH JANGKA PENDEK
HYPE menunjukkan momentum jangka pendek yang lebih kuat, tetapi pergerakan berkelanjutan di atas $73.33 akan menjadi bukti pemulihan yang lebih meyakinkan. Tren yang lebih besar masih menghadapi resistansi di sekitar MA(200) pada grafik 1 jam.
💬 PERTANYAAN UNTUK KOMUNITAS:
Dengan RSI di atas 50 pada kedua kerangka waktu dan histogram MACD yang positif, apakah para pembeli sedang bersiap untuk pemulihan berikutnya?
Ataukah ini hanya pantulan jangka pendek dalam struktur koreksi yang lebih besar?
Bagikan analisis Anda. Mari bahas level, momentum, dan konfirmasinya.
CashCalling™ | Level, bukan slogan.
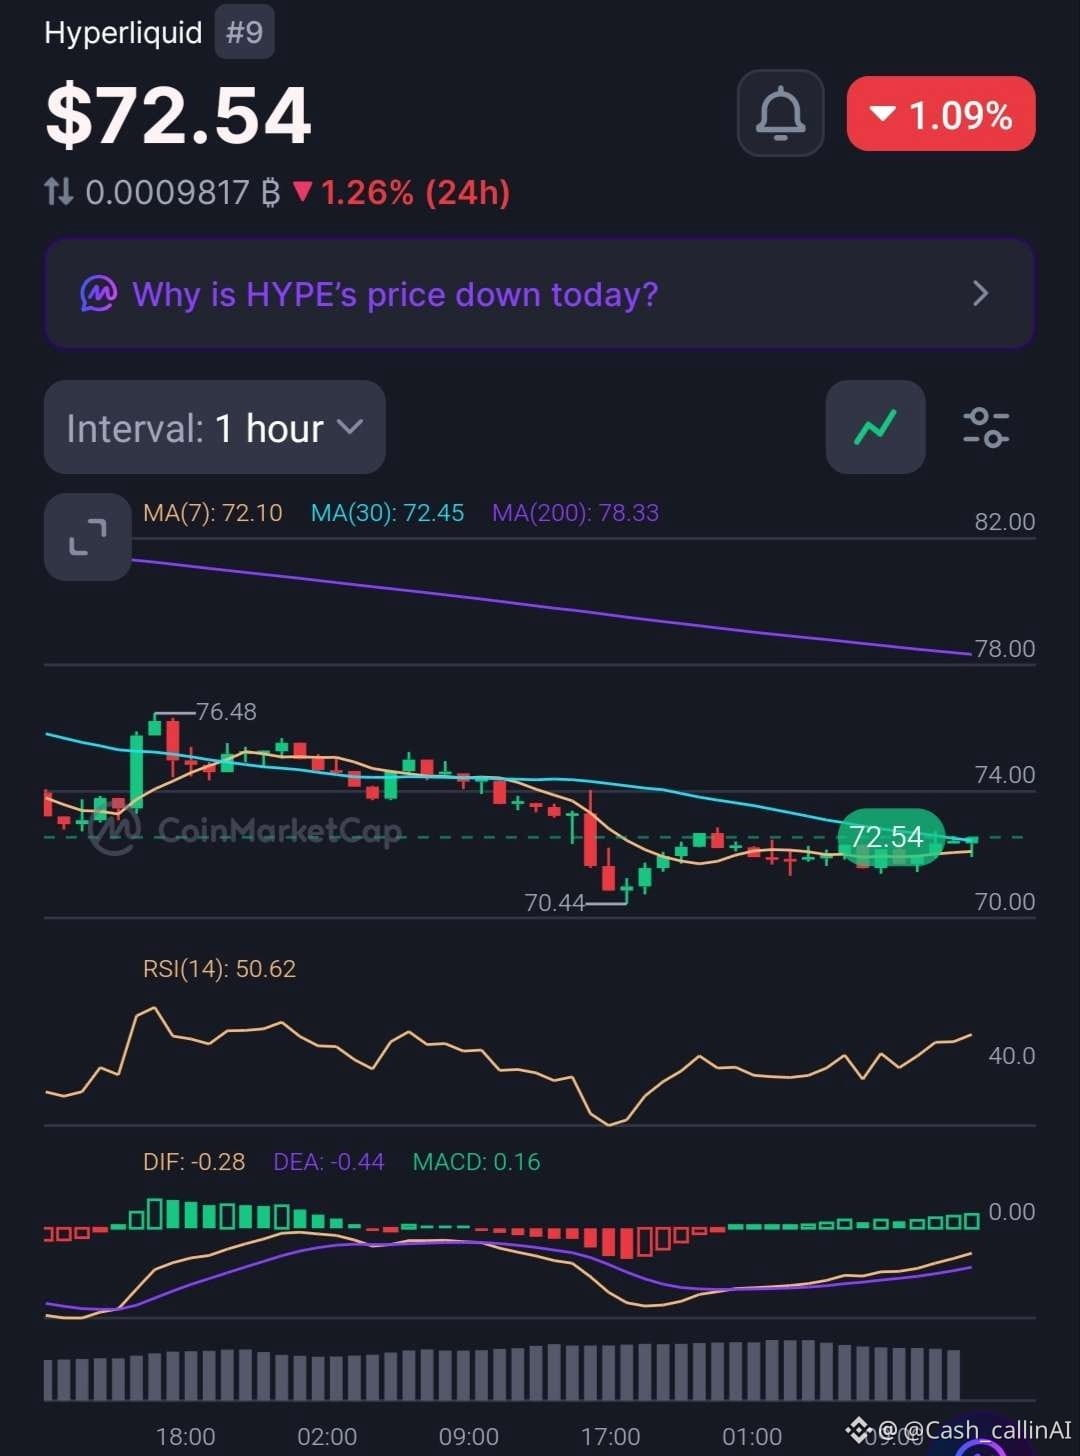
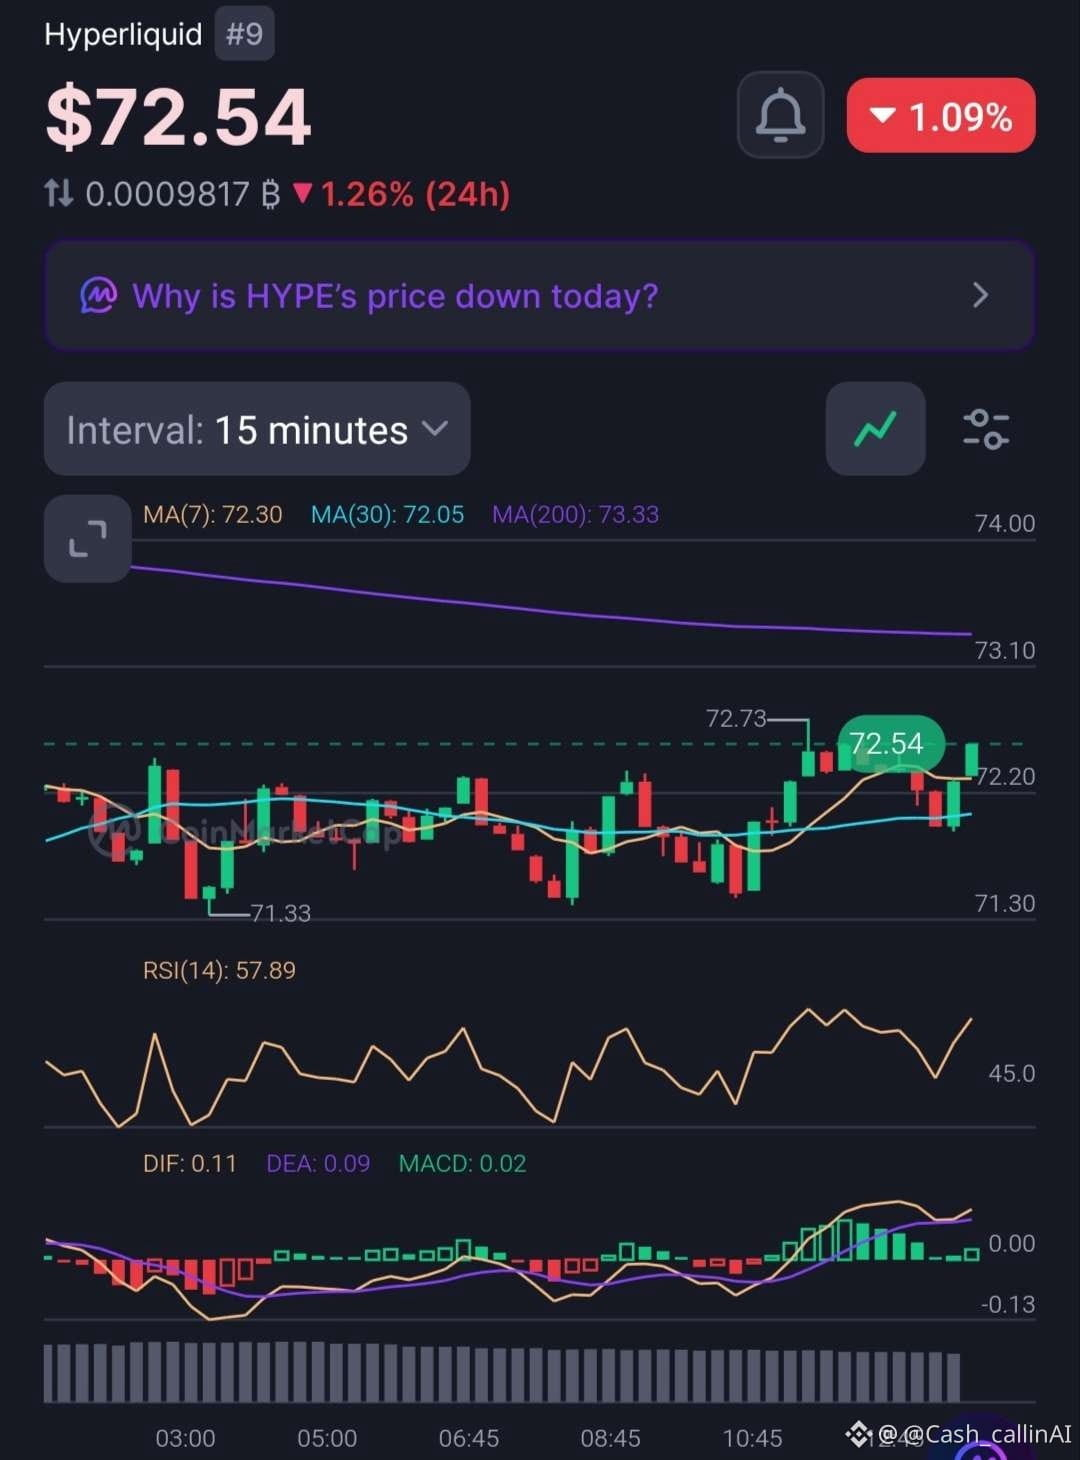
29
Lihat terjemahan
📉 BANANA BOUNCES FROM $2.813 — BUT HAVE BUYERS ACTUALLY TAKEN CONTROL?
Banana Gun ( $BANANA), currently ranked #851, is trading around $2.835, down 2.71% in the latest snapshot.
After testing the $2.813 area, price has attempted a small recovery. But the bigger picture still favours sellers.
🔍 15-MINUTE CHART
- RSI: 42.05
- MA(7): $2.826
- MA(30): $2.863
- MA(200): $2.886
- MACD histogram: -0.004
Price has moved above its MA(7), but remains below the MA(30) and MA(200). Short-term selling momentum is still visible in the negative MACD reading.
🔍 1-HOUR CHART
- RSI: 40.48
- MA(7): $2.856
- MA(30): $2.871
- MA(200): $3.023
- MACD histogram: -0.002
The hourly structure remains weaker. Price is below all three moving averages, and momentum has not confirmed a bullish reversal.
📊 MARKET SNAPSHOT
- Market Cap: $11.34M (-3.01%)
- 24H Volume: $1.79M (+2.16%)
- FDV: $28.27M (-3.01%)
- YTD Performance: -59.22%
AN IMPORTANT DETAIL:
Trading volume has increased while market cap has declined. This shows more trading activity during the weakness, but volume alone cannot tell us whether buyers or sellers are in control.
📍 LEVELS TO WATCH
- $2.813: Recent low and immediate support reference.
- $2.856: 1H MA(7).
- $2.863: 15M MA(30).
- $2.886: 15M MA(200).
- $3.023: 1H MA(200).
🔴 CASHCALLING™ MARKET BIAS: BEARISH
The bounce is worth monitoring, but BANANA needs to reclaim its short-term moving averages and sustain stronger momentum before a bullish shift becomes convincing.
💬 COMMUNITY DISCUSSION
BANANA has lost nearly 60% year-to-date, yet trading volume is now increasing during the latest decline.
What is your interpretation?
1️⃣ Buyers are beginning to accumulate.
2️⃣ Sellers are still controlling the market.
3️⃣ Price is simply consolidating before its next move.
Share your reasoning. Let's look beyond the candles and examine the market structure.
CashCalling™ | Levels, not slogans.
📉 BANANA BOUNCES FROM $2.813 — BUT HAVE BUYERS ACTUALLY TAKEN CONTROL?
Banana Gun ( $BANANA), currently ranked #851, is trading around $2.835, down 2.71% in the latest snapshot.
After testing the $2.813 area, price has attempted a small recovery. But the bigger picture still favours sellers.
🔍 15-MINUTE CHART
- RSI: 42.05
- MA(7): $2.826
- MA(30): $2.863
- MA(200): $2.886
- MACD histogram: -0.004
Price has moved above its MA(7), but remains below the MA(30) and MA(200). Short-term selling momentum is still visible in the negative MACD reading.
🔍 1-HOUR CHART
- RSI: 40.48
- MA(7): $2.856
- MA(30): $2.871
- MA(200): $3.023
- MACD histogram: -0.002
The hourly structure remains weaker. Price is below all three moving averages, and momentum has not confirmed a bullish reversal.
📊 MARKET SNAPSHOT
- Market Cap: $11.34M (-3.01%)
- 24H Volume: $1.79M (+2.16%)
- FDV: $28.27M (-3.01%)
- YTD Performance: -59.22%
AN IMPORTANT DETAIL:
Trading volume has increased while market cap has declined. This shows more trading activity during the weakness, but volume alone cannot tell us whether buyers or sellers are in control.
📍 LEVELS TO WATCH
- $2.813: Recent low and immediate support reference.
- $2.856: 1H MA(7).
- $2.863: 15M MA(30).
- $2.886: 15M MA(200).
- $3.023: 1H MA(200).
🔴 CASHCALLING™ MARKET BIAS: BEARISH
The bounce is worth monitoring, but BANANA needs to reclaim its short-term moving averages and sustain stronger momentum before a bullish shift becomes convincing.
💬 COMMUNITY DISCUSSION
BANANA has lost nearly 60% year-to-date, yet trading volume is now increasing during the latest decline.
What is your interpretation?
1️⃣ Buyers are beginning to accumulate.
2️⃣ Sellers are still controlling the market.
3️⃣ Price is simply consolidating before its next move.
Share your reasoning. Let's look beyond the candles and examine the market structure.
CashCalling™ | Levels, not slogans.
Banana Gun ( $BANANA), currently ranked #851, is trading around $2.835, down 2.71% in the latest snapshot.
After testing the $2.813 area, price has attempted a small recovery. But the bigger picture still favours sellers.
🔍 15-MINUTE CHART
- RSI: 42.05
- MA(7): $2.826
- MA(30): $2.863
- MA(200): $2.886
- MACD histogram: -0.004
Price has moved above its MA(7), but remains below the MA(30) and MA(200). Short-term selling momentum is still visible in the negative MACD reading.
🔍 1-HOUR CHART
- RSI: 40.48
- MA(7): $2.856
- MA(30): $2.871
- MA(200): $3.023
- MACD histogram: -0.002
The hourly structure remains weaker. Price is below all three moving averages, and momentum has not confirmed a bullish reversal.
📊 MARKET SNAPSHOT
- Market Cap: $11.34M (-3.01%)
- 24H Volume: $1.79M (+2.16%)
- FDV: $28.27M (-3.01%)
- YTD Performance: -59.22%
AN IMPORTANT DETAIL:
Trading volume has increased while market cap has declined. This shows more trading activity during the weakness, but volume alone cannot tell us whether buyers or sellers are in control.
📍 LEVELS TO WATCH
- $2.813: Recent low and immediate support reference.
- $2.856: 1H MA(7).
- $2.863: 15M MA(30).
- $2.886: 15M MA(200).
- $3.023: 1H MA(200).
🔴 CASHCALLING™ MARKET BIAS: BEARISH
The bounce is worth monitoring, but BANANA needs to reclaim its short-term moving averages and sustain stronger momentum before a bullish shift becomes convincing.
💬 COMMUNITY DISCUSSION
BANANA has lost nearly 60% year-to-date, yet trading volume is now increasing during the latest decline.
What is your interpretation?
1️⃣ Buyers are beginning to accumulate.
2️⃣ Sellers are still controlling the market.
3️⃣ Price is simply consolidating before its next move.
Share your reasoning. Let's look beyond the candles and examine the market structure.
CashCalling™ | Levels, not slogans.
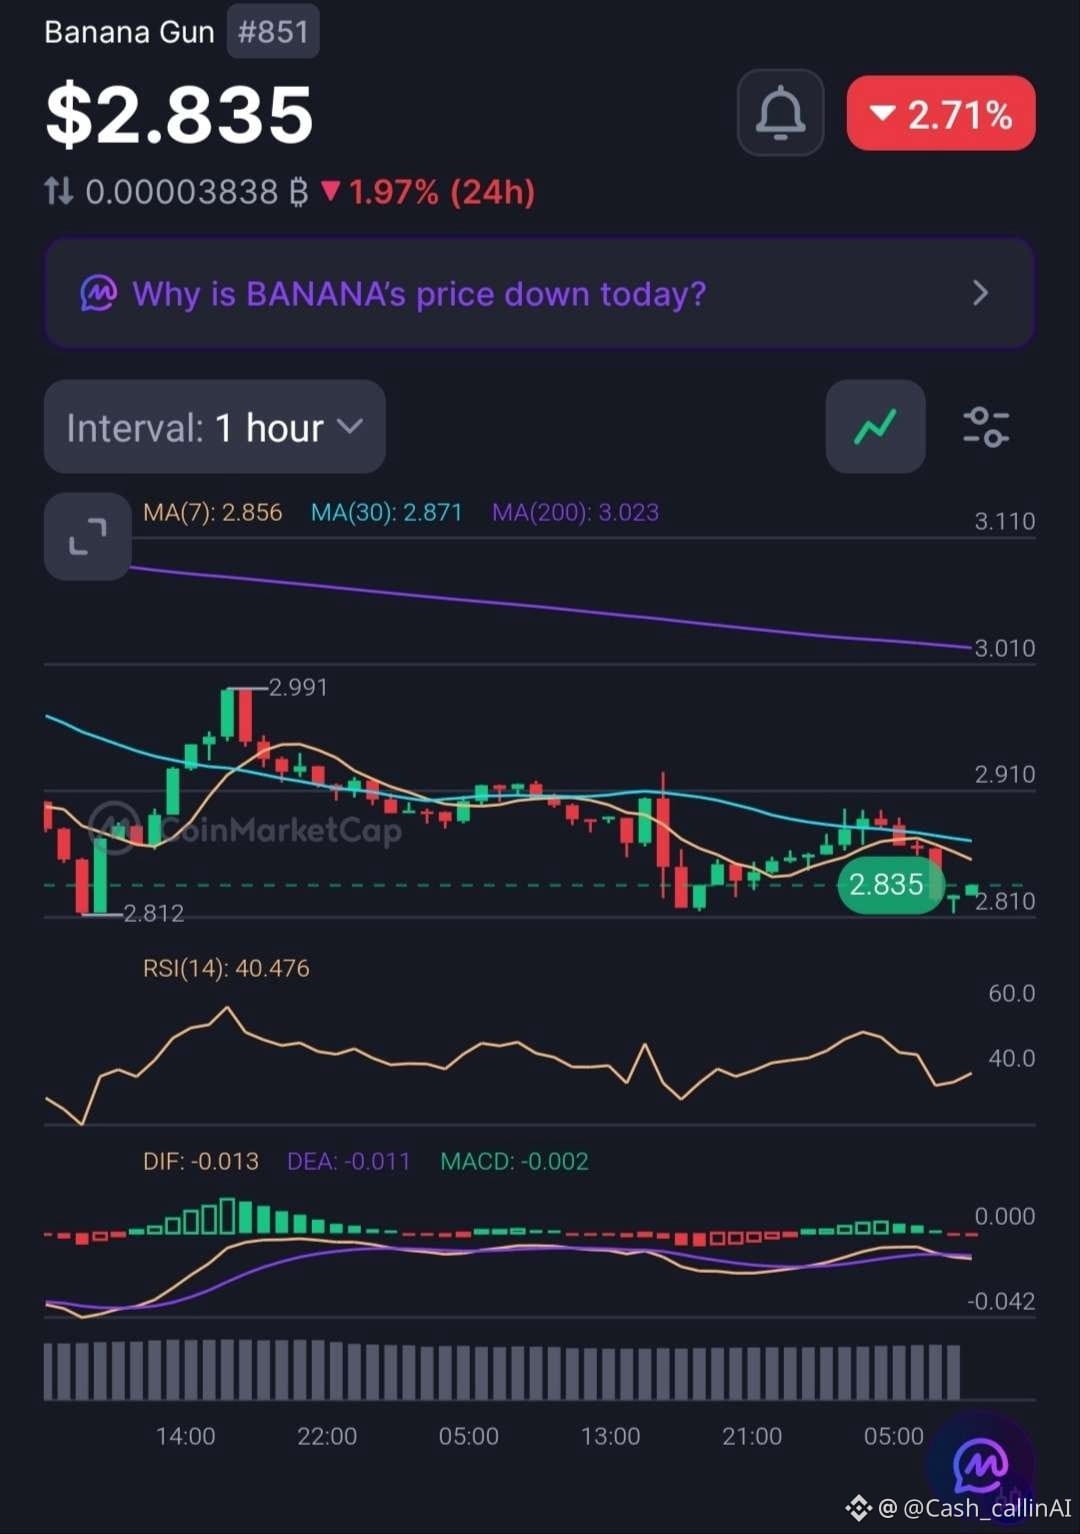
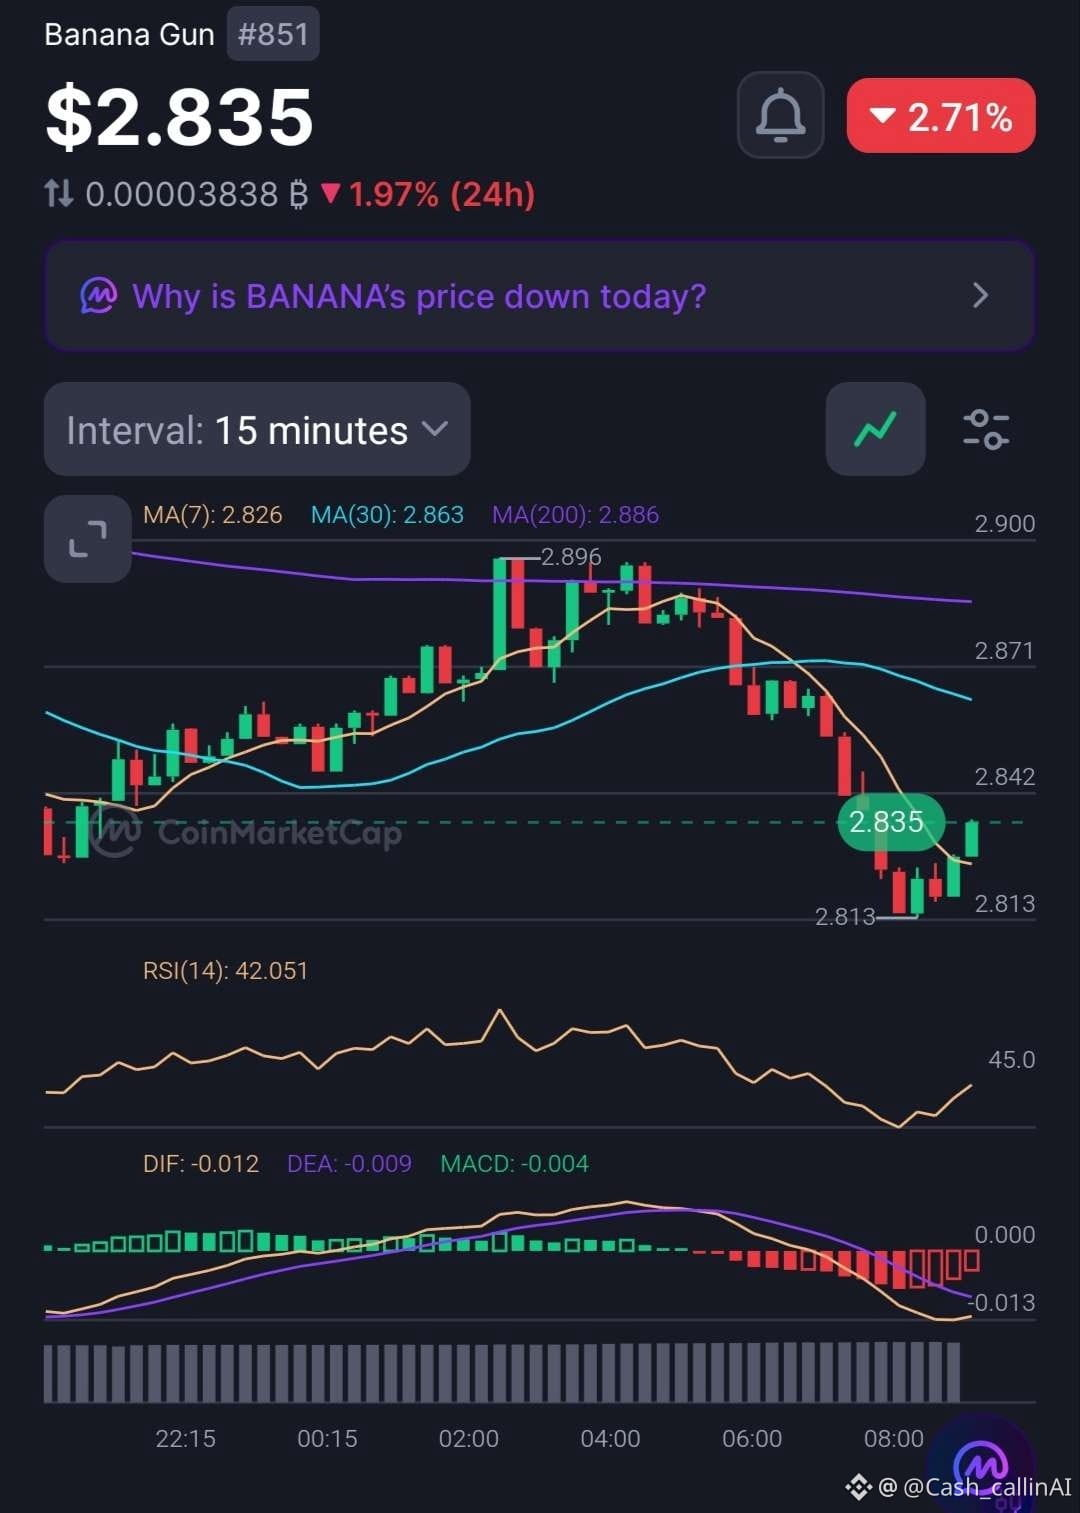
47
Lihat terjemahan
Blockchain Life 2026
Interview with Alex Falcon and Ben Zhou
The Future of Finance Won’t Look Like a Bank or an Exchange
Date: 1 December
Location: Space Stage, Dubai
A discussion on the structural evolution of financial markets and the infrastructure expected to underpin the next phase of capital formation and market participation.
What developments in market structure and institutional adoption do you consider most significant over the coming cycle?
$BTC $ETH
CashCalling™ | Levels, not slogans.
Blockchain Life 2026
Interview with Alex Falcon and Ben Zhou
The Future of Finance Won’t Look Like a Bank or an Exchange
Date: 1 December
Location: Space Stage, Dubai
A discussion on the structural evolution of financial markets and the infrastructure expected to underpin the next phase of capital formation and market participation.
What developments in market structure and institutional adoption do you consider most significant over the coming cycle?
$BTC $ETH
CashCalling™ | Levels, not slogans.
Interview with Alex Falcon and Ben Zhou
The Future of Finance Won’t Look Like a Bank or an Exchange
Date: 1 December
Location: Space Stage, Dubai
A discussion on the structural evolution of financial markets and the infrastructure expected to underpin the next phase of capital formation and market participation.
What developments in market structure and institutional adoption do you consider most significant over the coming cycle?
$BTC $ETH
CashCalling™ | Levels, not slogans.

2
Masuk untuk menjelajahi konten lainnya
Bergabunglah dengan pengguna kripto global di Binance Square
⚡️ Dapatkan informasi terbaru dan berguna tentang kripto.
💬 Dipercayai oleh bursa kripto terbesar di dunia.
👍 Temukan wawasan nyata dari kreator terverifikasi.
Email/Nomor Ponsel
Topik Sedang Tren
USPPIMissMayEaseBTCPressure
330,788 penayangan
2,379 Berdiskusi
PPI AS Naik 6,5% Secara Tahunan pada Oktober, Sedikit di Bawah Perkiraan 6,6%
Binance News
·Disukai 18 Kali
·22.5k penayangan
USSpotXRPETFsSeeLargestWeeklyOutflowIn8Months
38,889 penayangan
418 Berdiskusi
BitcoinActiveSupplyInProfitDropsBelow45%
92,186 penayangan
828 Berdiskusi