

TEKT0NIC 1
1.2k Posting

TEKT0NIC 1
Laporkan
Blokir Pengguna
Passionate about crypto and blockchain | Crypto Enthusiastic | Technical Analysis | Fundamental News
0 Mengikuti
9 Pengikut
39 Disukai
Posting
·
--
Lihat terjemahan
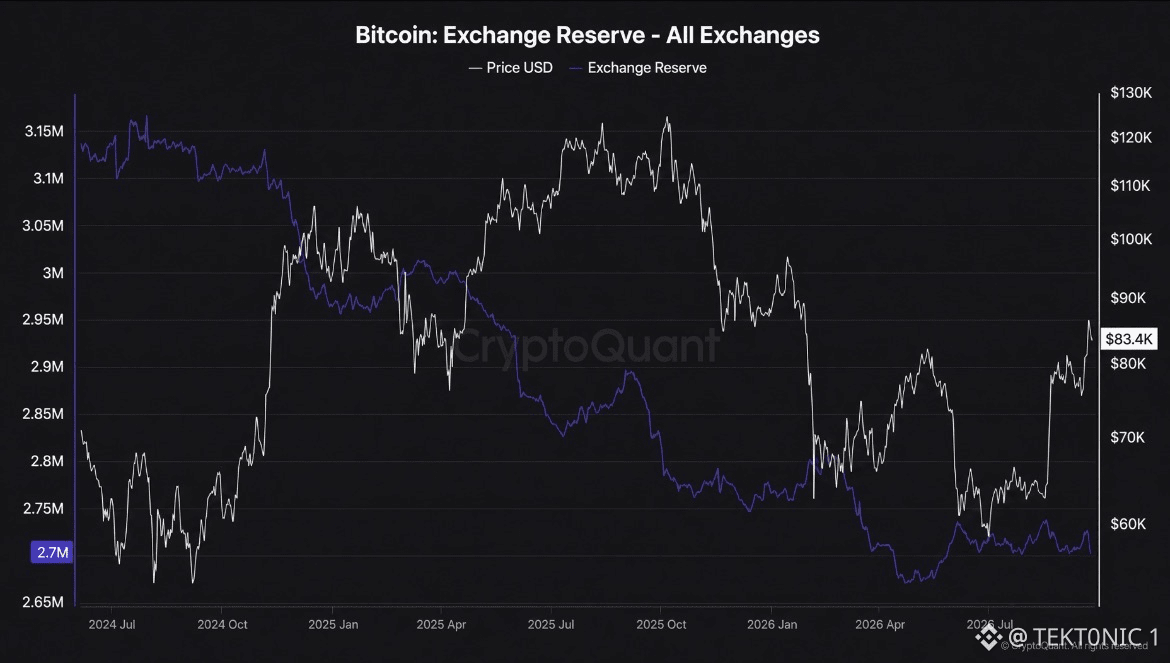
$BTC reserves on exchanges are sitting near multi-year lows. CryptoQuant’s all-exchange series is about 2.7 million BTC, down from roughly 3.15 million in mid-2024. the drop has been steady. Reserves fell through the 2024 rally, kept falling into the 2025 high near $126,000, and made a low around 2.67 million in April 2026. They have barely rebuilt since. Price on the chart is about $83,400, so the supply on exchanges did not snap back with the Q3 bounce. less Bitcoin on exchanges means less inventory sitting where a market sell can hit immediately. Some of that coin moved to cold storage. Some of it sits with ETF custodians, which this series does not count as exchange inventory. A lower reserve is tighter spot supply. It is not a guarantee that holders will not sell. price already fell from $126,000 to the low $60,000s while this reserve was declining. Scarcity did not stop that drawdown. now the focus is whether 2.7 million keeps grinding lower as price holds $86,000. a fresh drop under the April low would tighten supply again. A rebuild toward 2.8 million would mean coins are coming back to exchanges. The low is real. It still needs a bid. #BTC Price Analysis# #Bitcoin Price Prediction: What is Bitcoins next move?# $BTC $XRP #Macro Insights#
$BTC reserves on exchanges are sitting near multi-year lows. CryptoQuant’s all-exchange series is about 2.7 million BTC, down from roughly 3.15 million in mid-2024. the drop has been steady. Reserves fell through the 2024 rally, kept falling into the 2025 high near $126,000, and made a low around 2.67 million in April 2026. They have barely rebuilt since. Price on the chart is about $83,400, so the supply on exchanges did not snap back with the Q3 bounce. less Bitcoin on exchanges means less inventory sitting where a market sell can hit immediately. Some of that coin moved to cold storage. Some of it sits with ETF custodians, which this series does not count as exchange inventory. A lower reserve is tighter spot supply. It is not a guarantee that holders will not sell. price already fell from $126,000 to the low $60,000s while this reserve was declining. Scarcity did not stop that drawdown. now the focus is whether 2.7 million keeps grinding lower as price holds $86,000. a fresh drop under the April low would tighten supply again. A rebuild toward 2.8 million would mean coins are coming back to exchanges. The low is real. It still needs a bid. #BTC Price Analysis# #Bitcoin Price Prediction: What is Bitcoins next move?# $BTC $XRP #Macro Insights#
·
--
Lihat terjemahan
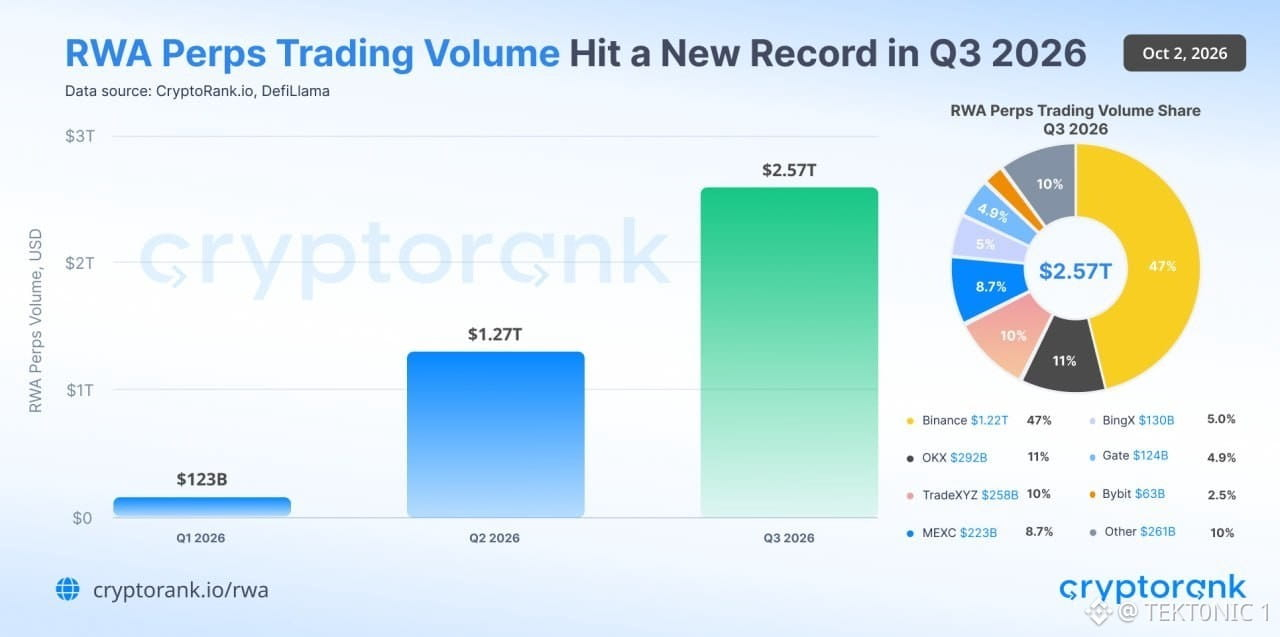
RWA perps just printed a record quarter. according to CryptoRank, trading volume reached $2.57 trillion in Q3 2026, more than double the $1.27 trillion in Q2. August alone was $957 billion. Binance led with $1.22 trillion, nearly half the market. Centralized exchanges took more than 80%. Perp DEXs did $365 billion, up 32% from the prior quarter. these are contracts on tokenized equities, commodities, and indices, not coins moving into custody. A perp can turn over the same exposure many times in a day. Weekend volume in the segment was already near $28 billion by mid-August, which is demand showing up when U.S. cash markets are closed. volume is not assets under management. Tokenized RWAs were about $34 billion in AUM by mid-September. The derivatives number is the larger one because traders are taking price exposure, not delivery. now the focus is whether Q4 holds the pace after an August spike that large. a second quarter above $2 trillion would show the market has settled at this size. One record quarter can still be a peak.
#BTC Price Analysis# #Bitcoin Price Prediction: What is Bitcoins next move?# $BTC $ETH #Bullish
RWA perps just printed a record quarter. according to CryptoRank, trading volume reached $2.57 trillion in Q3 2026, more than double the $1.27 trillion in Q2. August alone was $957 billion. Binance led with $1.22 trillion, nearly half the market. Centralized exchanges took more than 80%. Perp DEXs did $365 billion, up 32% from the prior quarter. these are contracts on tokenized equities, commodities, and indices, not coins moving into custody. A perp can turn over the same exposure many times in a day. Weekend volume in the segment was already near $28 billion by mid-August, which is demand showing up when U.S. cash markets are closed. volume is not assets under management. Tokenized RWAs were about $34 billion in AUM by mid-September. The derivatives number is the larger one because traders are taking price exposure, not delivery. now the focus is whether Q4 holds the pace after an August spike that large. a second quarter above $2 trillion would show the market has settled at this size. One record quarter can still be a peak.
#BTC Price Analysis# #Bitcoin Price Prediction: What is Bitcoins next move?# $BTC $ETH #Bullish
#BTC Price Analysis# #Bitcoin Price Prediction: What is Bitcoins next move?# $BTC $ETH #Bullish
·
--
Lihat terjemahan
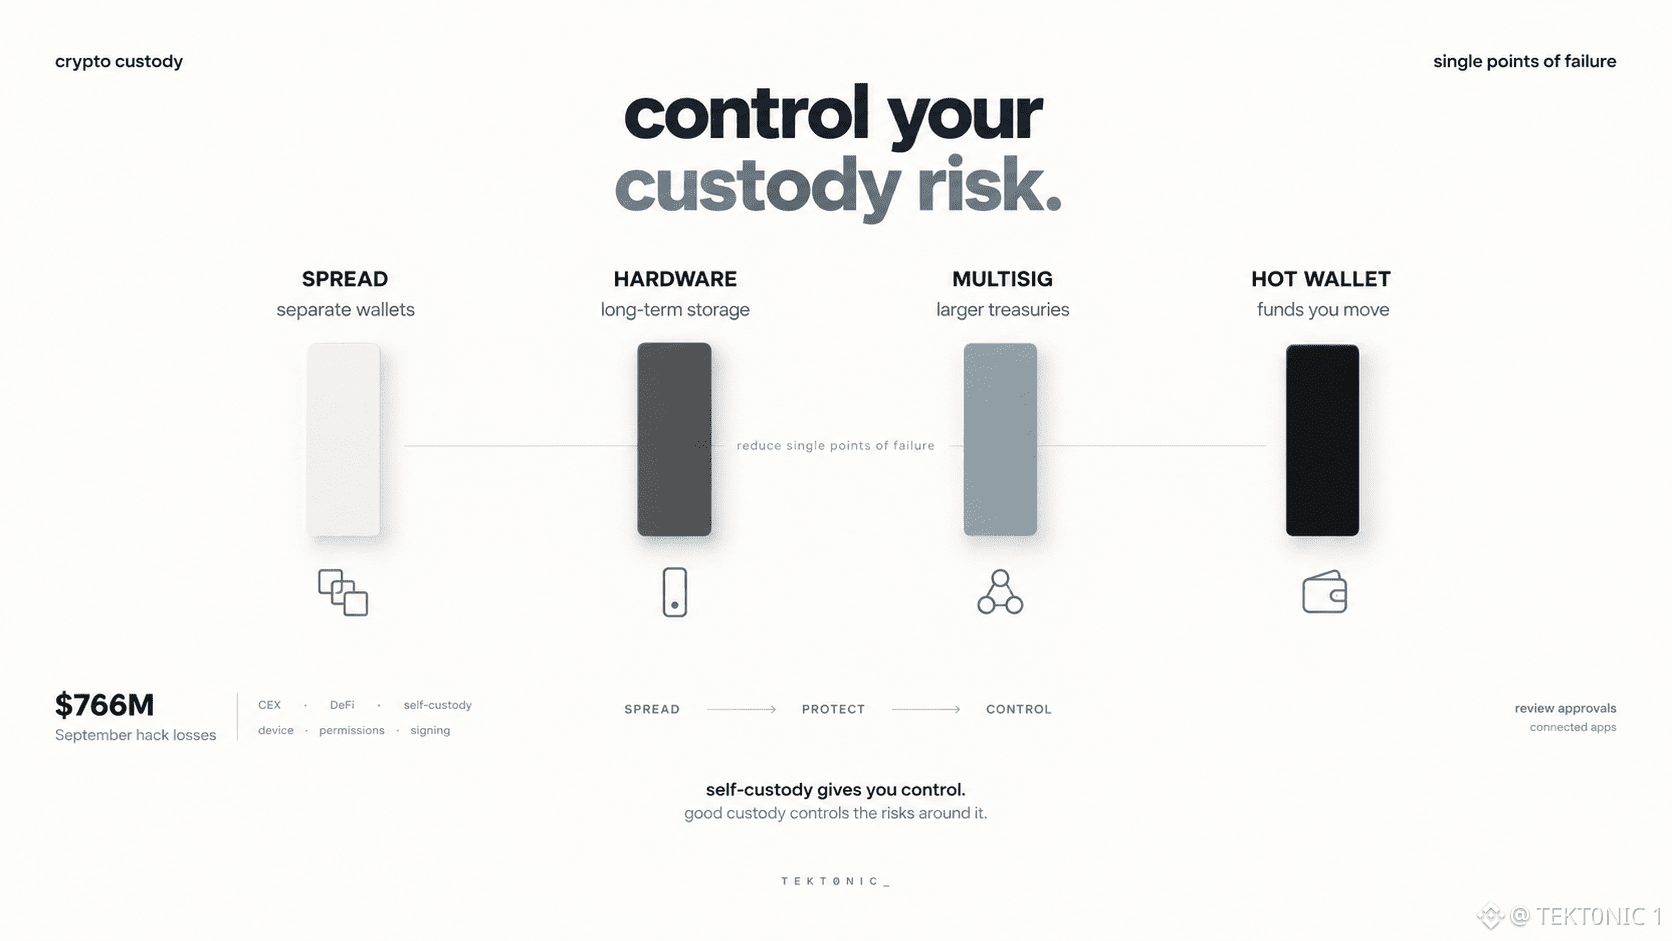
crypto custody is getting harder to think about as a simple “where do i keep my funds?” question. CEXs can be hacked. DeFi protocols can be exploited. even self-custody can introduce new risks if the device, permissions or signing setup is compromised. September alone saw around $766M in crypto hack losses, according to CertiK’s tracking. and the problem isn’t limited to one type of platform. the answer isn’t finding one “perfect” wallet. it’s reducing single points of failure. → spread larger holdings across separate wallets → use hardware wallets for long-term storage → use multisig for larger treasuries → keep hot wallets for funds you actually need to move → review approvals and connected apps regularly self-custody gives you control. but good custody is about controlling the risks around that control. #BTC Price Analysis# #Bitcoin Price Prediction: What is Bitcoins next move?# $BTC $XRP #Macro Insights#
crypto custody is getting harder to think about as a simple “where do i keep my funds?” question. CEXs can be hacked. DeFi protocols can be exploited. even self-custody can introduce new risks if the device, permissions or signing setup is compromised. September alone saw around $766M in crypto hack losses, according to CertiK’s tracking. and the problem isn’t limited to one type of platform. the answer isn’t finding one “perfect” wallet. it’s reducing single points of failure. → spread larger holdings across separate wallets → use hardware wallets for long-term storage → use multisig for larger treasuries → keep hot wallets for funds you actually need to move → review approvals and connected apps regularly self-custody gives you control. but good custody is about controlling the risks around that control. #BTC Price Analysis# #Bitcoin Price Prediction: What is Bitcoins next move?# $BTC $XRP #Macro Insights#
·
--
Lihat terjemahan
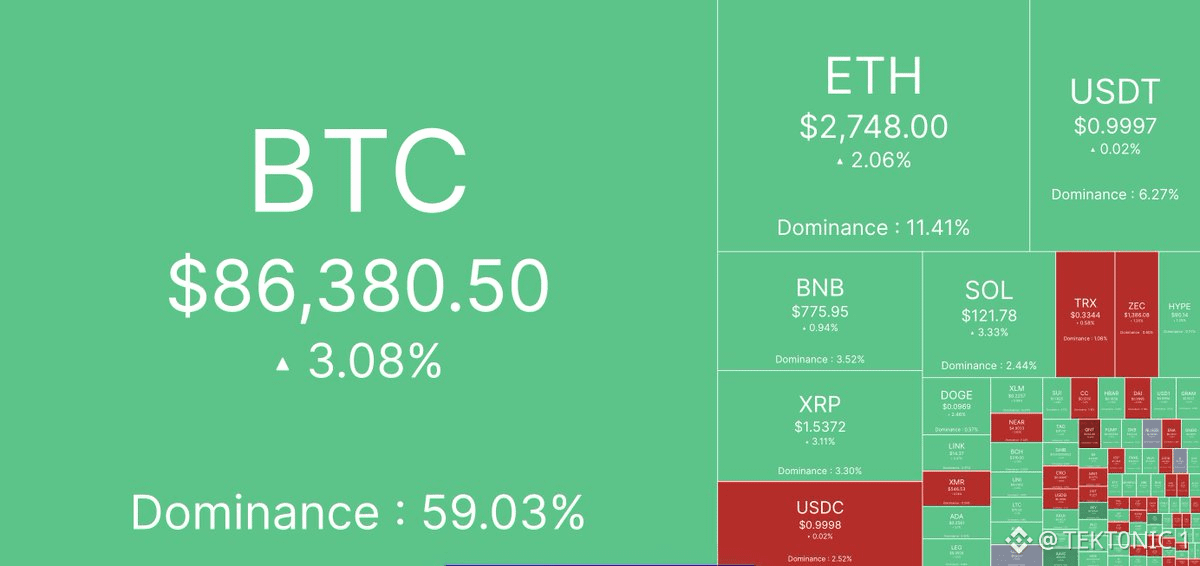
Bitcoin Is Back at $86,381 as About $244 Million of Shorts Were Closed in 24 Hours. $ETH is $2,748 and Solana is $121.78. $BTC still holds most of the board. According to the market map, Bitcoin is leading the bounce and dominance is still near 59%. The 24-hour short liquidations landed with that rebound, after the softer PCE reading and the move back through $85,000. Alts are green with it, not ahead of it. Key Details: > Bitcoin: $86,380.50, +3.08%, dominance 59.03%. > Ether: $2,748, +2.06%, dominance 11.41%. > Solana: $121.78, +3.33%, dominance 2.44%. > XRP: $1.5372, +3.31%. > 24-hour short liquidations: about $244 million. $87,000 is the recent high. Hold $85,000 and this rebound stays intact. Lose it and the short covering was only a one-day bid. $BTC $86,381, $ETH $2,748, SOL $122. $244M Shorts Closed in 24 Hours. Do you add on this $86,000 reclaim, or wait for a daily close above $87,000? #BTC Price Analysis# #Bitcoin Price Prediction: What is Bitcoins next move?# #Altcoin Season#
Bitcoin Is Back at $86,381 as About $244 Million of Shorts Were Closed in 24 Hours. $ETH is $2,748 and Solana is $121.78. $BTC still holds most of the board. According to the market map, Bitcoin is leading the bounce and dominance is still near 59%. The 24-hour short liquidations landed with that rebound, after the softer PCE reading and the move back through $85,000. Alts are green with it, not ahead of it. Key Details: > Bitcoin: $86,380.50, +3.08%, dominance 59.03%. > Ether: $2,748, +2.06%, dominance 11.41%. > Solana: $121.78, +3.33%, dominance 2.44%. > XRP: $1.5372, +3.31%. > 24-hour short liquidations: about $244 million. $87,000 is the recent high. Hold $85,000 and this rebound stays intact. Lose it and the short covering was only a one-day bid. $BTC $86,381, $ETH $2,748, SOL $122. $244M Shorts Closed in 24 Hours. Do you add on this $86,000 reclaim, or wait for a daily close above $87,000? #BTC Price Analysis# #Bitcoin Price Prediction: What is Bitcoins next move?# #Altcoin Season#
·
--
Lihat terjemahan
Strategy Just Passed Saudi National Bank to Rank 385th Among Public Companies. $BTC Treasuries put the Bitcoin treasury name ahead of the Saudi lender. According to that ranking, the jump follows the equity rebound that took market value from $39.3 billion on June 22 to $70.9 billion on September 21, while Bitcoin traded back through $85,000. Rank is market value, not earnings. It still puts a Bitcoin balance sheet next to a major bank. Key Details: > New rank: 385th-largest public company. > Passed: Saudi National Bank. > Source: BTC Treasuries. > Holdings: 845,100 BTC. Passing a national bank is a size milestone. It is still a Bitcoin mark. If $85,000 holds, the rank can stay. If Bitcoin loses $84,000, that place in the table can slip back. Strategy: 385th-Largest Public Company, Ahead of Saudi National Bank. Does a bank-sized rank change how you view Strategy, or do you still only watch the 845,100 $BTC stack? #BTC Price Analysis# #Bitcoin Price Prediction: What is Bitcoins next move?# $ETH #Macro Insights#
Strategy Just Passed Saudi National Bank to Rank 385th Among Public Companies. $BTC Treasuries put the Bitcoin treasury name ahead of the Saudi lender. According to that ranking, the jump follows the equity rebound that took market value from $39.3 billion on June 22 to $70.9 billion on September 21, while Bitcoin traded back through $85,000. Rank is market value, not earnings. It still puts a Bitcoin balance sheet next to a major bank. Key Details: > New rank: 385th-largest public company. > Passed: Saudi National Bank. > Source: BTC Treasuries. > Holdings: 845,100 BTC. Passing a national bank is a size milestone. It is still a Bitcoin mark. If $85,000 holds, the rank can stay. If Bitcoin loses $84,000, that place in the table can slip back. Strategy: 385th-Largest Public Company, Ahead of Saudi National Bank. Does a bank-sized rank change how you view Strategy, or do you still only watch the 845,100 $BTC stack? #BTC Price Analysis# #Bitcoin Price Prediction: What is Bitcoins next move?# $ETH #Macro Insights#

·
--
Lihat terjemahan
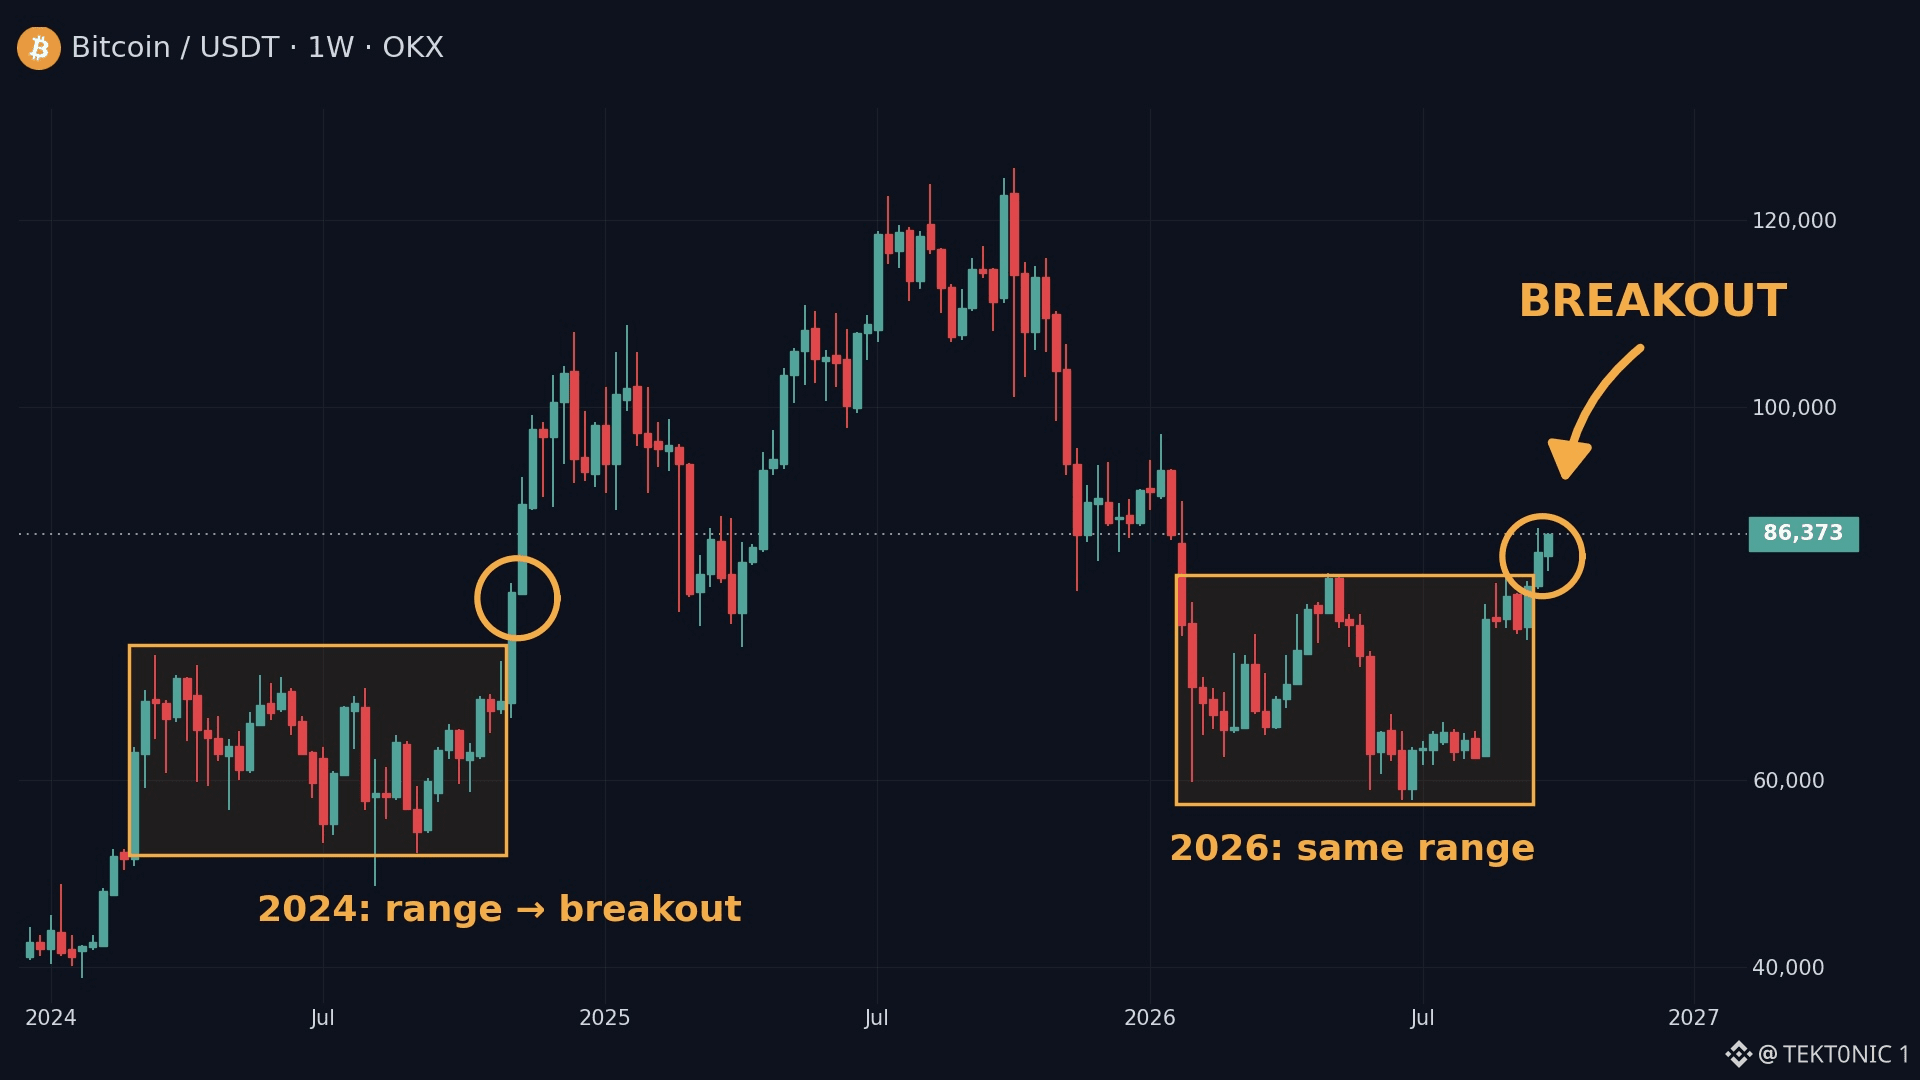
$BTC has broken out of the range that held it for about seven months. on the weekly chart, price is back through $86,373 after spending 2026 between the low-$60,000s and the mid-$80,000s. The same kind of range showed up in 2024. Once that one broke, Bitcoin reached $100,000 within about five weeks. That is the comparison the chart is drawing. this break is not the same market. In 2024 the range sat under a new high. This one sits under the 2025 peak near $126,000, after Q1 and Q2 losses and a 42.6% Q3. Spot ETFs took in about $6.3 billion last quarter. Kalshi still prices $100,000 by year-end near 40%. now the focus shifts to whether $86,000 holds. a clean retest of that former ceiling would give traders more confirmation that the range is actually broken. A slip back under it puts price inside the seven-month band again. breakout first. confirmation next on $BTC chart. #BTC Price Analysis# #Bitcoin Price Prediction: What is Bitcoins next move?# $ETH #Bullish
$BTC has broken out of the range that held it for about seven months. on the weekly chart, price is back through $86,373 after spending 2026 between the low-$60,000s and the mid-$80,000s. The same kind of range showed up in 2024. Once that one broke, Bitcoin reached $100,000 within about five weeks. That is the comparison the chart is drawing. this break is not the same market. In 2024 the range sat under a new high. This one sits under the 2025 peak near $126,000, after Q1 and Q2 losses and a 42.6% Q3. Spot ETFs took in about $6.3 billion last quarter. Kalshi still prices $100,000 by year-end near 40%. now the focus shifts to whether $86,000 holds. a clean retest of that former ceiling would give traders more confirmation that the range is actually broken. A slip back under it puts price inside the seven-month band again. breakout first. confirmation next on $BTC chart. #BTC Price Analysis# #Bitcoin Price Prediction: What is Bitcoins next move?# $ETH #Bullish
2
·
--
Lihat terjemahan
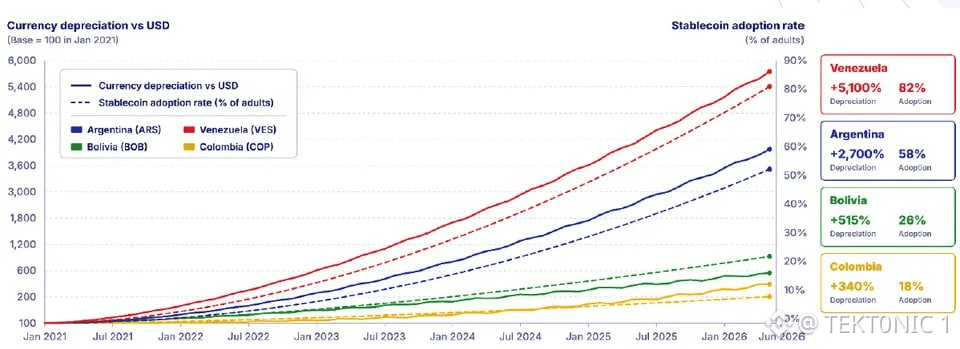
Stablecoin Use Is Highest Where Local Currencies Have Fallen the Hardest. Venezuela leads at 82% adult adoption. The on-ramp side is still small. According to the chart, adoption has risen in step with each currency’s drop versus the dollar since January 2021. The four countries with the steepest losses also have the highest stablecoin use. Demand is already there. Local liquidity is not: only 16 specialist providers sit across 494 companies in the region. Key Details: > Venezuela: +5,100% depreciation, 82% adoption. > Argentina: +2,700% depreciation, 58% adoption. > Bolivia: +515% depreciation, 28% adoption. > Colombia: +340% depreciation, 18% adoption. > Liquidity: 16 specialist providers across 494 companies. People are already using dollar stablecoins as a savings rail. The missing piece is local market makers and on-ramps, not more users. Sixteen providers is a narrow pipe for a region this large. LATAM Stablecoins: Venezuela 82%, Argentina 58%. Only 16 Specialist Providers. #BTC Price Analysis# #Bitcoin Price Prediction: What is Bitcoins next move?# #Stablecoins $BTC $XRP
Stablecoin Use Is Highest Where Local Currencies Have Fallen the Hardest. Venezuela leads at 82% adult adoption. The on-ramp side is still small. According to the chart, adoption has risen in step with each currency’s drop versus the dollar since January 2021. The four countries with the steepest losses also have the highest stablecoin use. Demand is already there. Local liquidity is not: only 16 specialist providers sit across 494 companies in the region. Key Details: > Venezuela: +5,100% depreciation, 82% adoption. > Argentina: +2,700% depreciation, 58% adoption. > Bolivia: +515% depreciation, 28% adoption. > Colombia: +340% depreciation, 18% adoption. > Liquidity: 16 specialist providers across 494 companies. People are already using dollar stablecoins as a savings rail. The missing piece is local market makers and on-ramps, not more users. Sixteen providers is a narrow pipe for a region this large. LATAM Stablecoins: Venezuela 82%, Argentina 58%. Only 16 Specialist Providers. #BTC Price Analysis# #Bitcoin Price Prediction: What is Bitcoins next move?# #Stablecoins $BTC $XRP
·
--
Lihat terjemahan
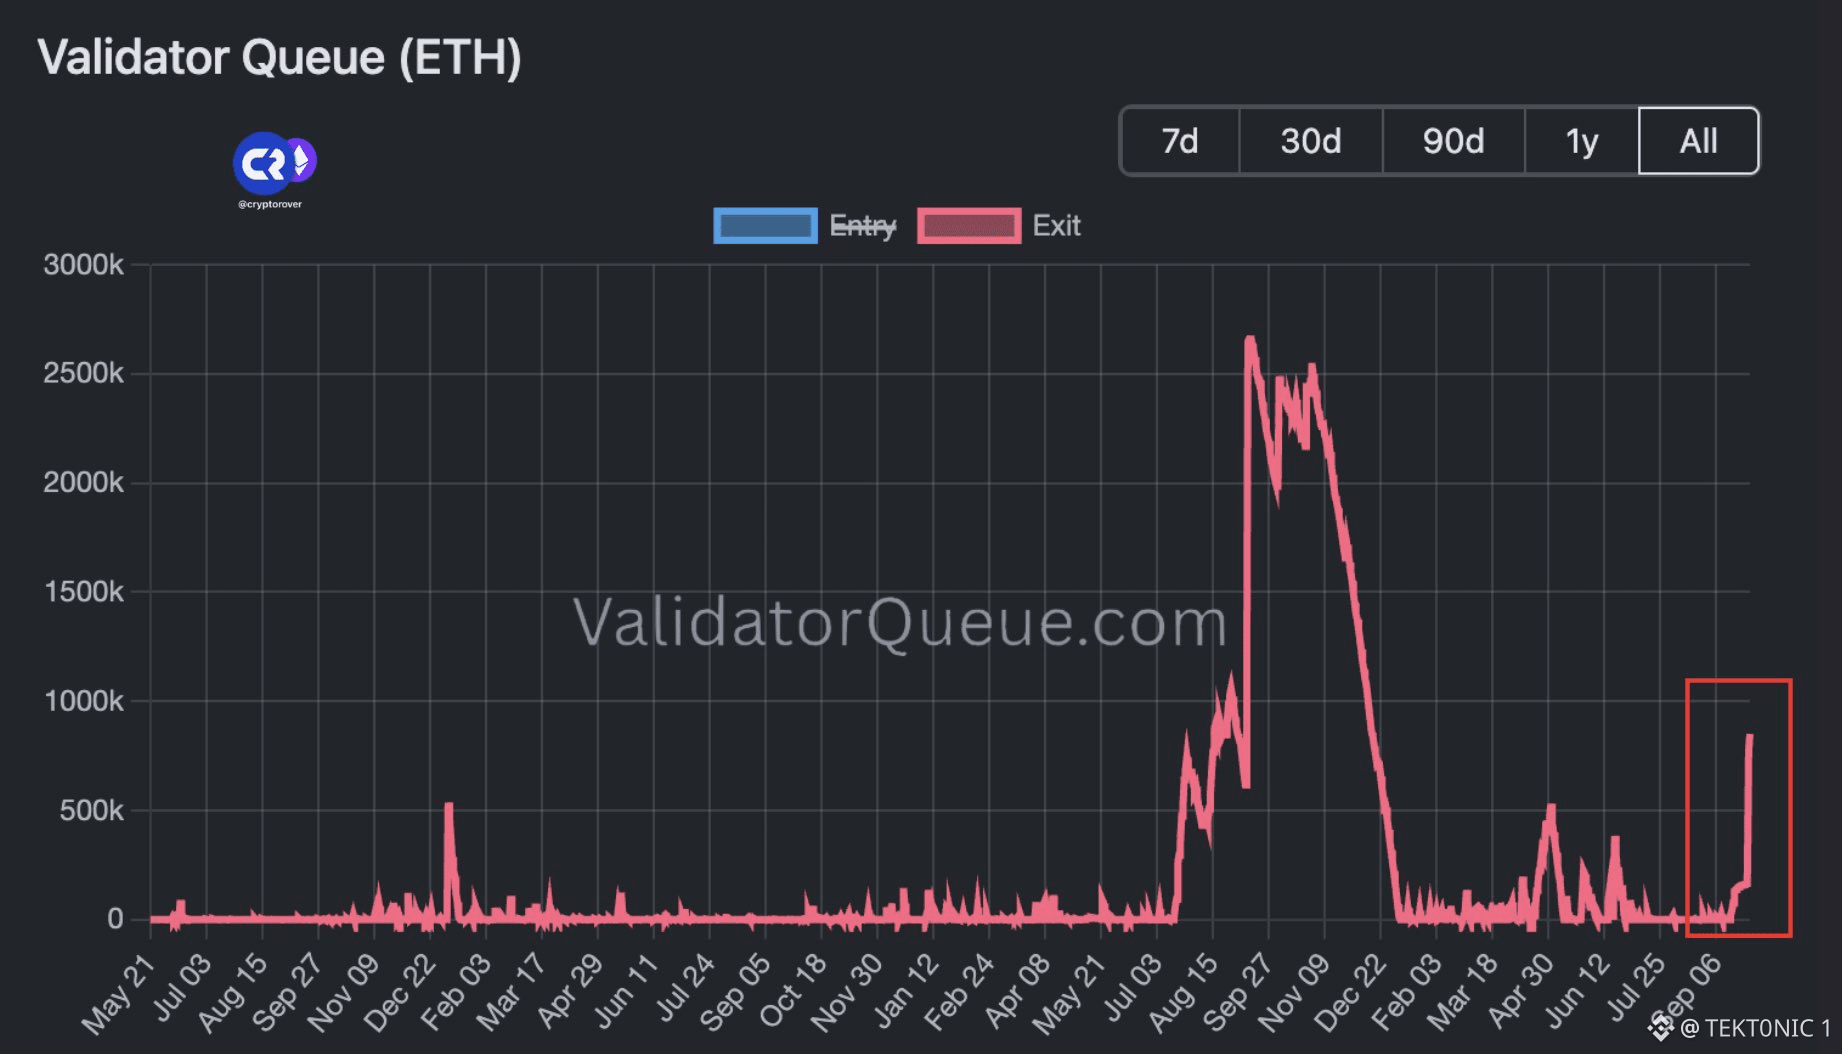
Validators are lining up to unstake $ETH again. the exit backlog just jumped from near zero to about 800,000 eth, the sharpest rise since the backlog cleared into year-end. The protocol only processes about 57,600 eth of exits a day, so this is roughly two weeks of withdrawals, not an instant sale. The August 2025 wave peaked near 2.6 million eth. This spike is about a third of that. an exit is a withdrawal request, not a market sell. Some of that ether gets restaked or moved to a custodian. Some of it can hit exchanges, and that is the short-term pressure while $ETH is still failing $2,750 to $2,800. the longer view is separate. A move toward $10,000 still needs the cycle, ETF demand, and the $ETH / $BTC monthly break to hold. This spike does not settle that. now the focus is whether the exit backlog keeps climbing past 1 million, or fades the way the smaller spikes did in the spring. a two-week withdrawal wait is pressure. It is not the cycle. #BTC Price Analysis# #Bitcoin Price Prediction: What is Bitcoins next move?# #Ethereum
Validators are lining up to unstake $ETH again. the exit backlog just jumped from near zero to about 800,000 eth, the sharpest rise since the backlog cleared into year-end. The protocol only processes about 57,600 eth of exits a day, so this is roughly two weeks of withdrawals, not an instant sale. The August 2025 wave peaked near 2.6 million eth. This spike is about a third of that. an exit is a withdrawal request, not a market sell. Some of that ether gets restaked or moved to a custodian. Some of it can hit exchanges, and that is the short-term pressure while $ETH is still failing $2,750 to $2,800. the longer view is separate. A move toward $10,000 still needs the cycle, ETF demand, and the $ETH / $BTC monthly break to hold. This spike does not settle that. now the focus is whether the exit backlog keeps climbing past 1 million, or fades the way the smaller spikes did in the spring. a two-week withdrawal wait is pressure. It is not the cycle. #BTC Price Analysis# #Bitcoin Price Prediction: What is Bitcoins next move?# #Ethereum
27
·
--
Pengangguran AS akan diumumkan pada pukul 08:30 pagi ET. Pasar dipatok pada 4,1%. Bulan lalu juga 4,1%. Prakiraannya tetap 4,1%. Berdasarkan posisi menjelang rilis pagi ini, angka di atas 4,1% adalah skenario tenaga kerja yang lebih lembut—hasil yang selama ini diperlakukan trader sebagai dorongan untuk mengambil risiko. Sementara angka di bawah 4,1% adalah skenario tenaga kerja yang lebih kuat yang dapat menaikkan imbal hasil dan menekan Bitcoin serta saham. Pengulangan di 4,1% menghasilkan reaksi yang bercampur. $BTC sedang pulih dengan kembali merebut $85.000 setelah pembacaan PCE yang lebih lunak, jadi angka ini adalah uji makro berikutnya untuk pantulan tersebut. Detail Utama: > Rilis: hari ini pukul 08:30 pagi ET. > Sebelumnya: 4,1%. > Prakiraan: 4,1%. > Di atas 4,1%: skenario tenaga kerja yang lebih lembut yang sedang dibeli trader. > Di bawah 4,1%: skenario tenaga kerja yang lebih kuat yang bisa menjual risiko. > Sama dengan 4,1%: tidak ada sinyal yang jelas. Angka ini tidak menggerakkan $BTC sendirian. Yang bergerak adalah jalur suku bunga, dan jalur suku bunga itulah yang masih bertahan di bawah $85.000. Pertahankan level itu selama rilis, dan bulan Oktober tetap mendukung. Jika $84.000 terlepas setelah pembacaan tenaga kerja yang kuat, pantulan PCE berisiko. Pengangguran pada pukul 08:30 pagi ET. Sebelumnya 4,1%. Prakiraan 4,1%. Apakah Anda sudah memposisikan diri untuk pembacaan yang lebih lembut di atas 4,1%, atau tetap netral sampai angka keluar? #Analisis Harga BTC# #Prediksi Harga Bitcoin: Apa langkah berikutnya Bitcoin?# #Wawasan Makro# $XRP
Pengangguran AS akan diumumkan pada pukul 08:30 pagi ET. Pasar dipatok pada 4,1%. Bulan lalu juga 4,1%. Prakiraannya tetap 4,1%. Berdasarkan posisi menjelang rilis pagi ini, angka di atas 4,1% adalah skenario tenaga kerja yang lebih lembut—hasil yang selama ini diperlakukan trader sebagai dorongan untuk mengambil risiko. Sementara angka di bawah 4,1% adalah skenario tenaga kerja yang lebih kuat yang dapat menaikkan imbal hasil dan menekan Bitcoin serta saham. Pengulangan di 4,1% menghasilkan reaksi yang bercampur. $BTC sedang pulih dengan kembali merebut $85.000 setelah pembacaan PCE yang lebih lunak, jadi angka ini adalah uji makro berikutnya untuk pantulan tersebut. Detail Utama: > Rilis: hari ini pukul 08:30 pagi ET. > Sebelumnya: 4,1%. > Prakiraan: 4,1%. > Di atas 4,1%: skenario tenaga kerja yang lebih lembut yang sedang dibeli trader. > Di bawah 4,1%: skenario tenaga kerja yang lebih kuat yang bisa menjual risiko. > Sama dengan 4,1%: tidak ada sinyal yang jelas. Angka ini tidak menggerakkan $BTC sendirian. Yang bergerak adalah jalur suku bunga, dan jalur suku bunga itulah yang masih bertahan di bawah $85.000. Pertahankan level itu selama rilis, dan bulan Oktober tetap mendukung. Jika $84.000 terlepas setelah pembacaan tenaga kerja yang kuat, pantulan PCE berisiko. Pengangguran pada pukul 08:30 pagi ET. Sebelumnya 4,1%. Prakiraan 4,1%. Apakah Anda sudah memposisikan diri untuk pembacaan yang lebih lembut di atas 4,1%, atau tetap netral sampai angka keluar? #Analisis Harga BTC# #Prediksi Harga Bitcoin: Apa langkah berikutnya Bitcoin?# #Wawasan Makro# $XRP
29
·
--
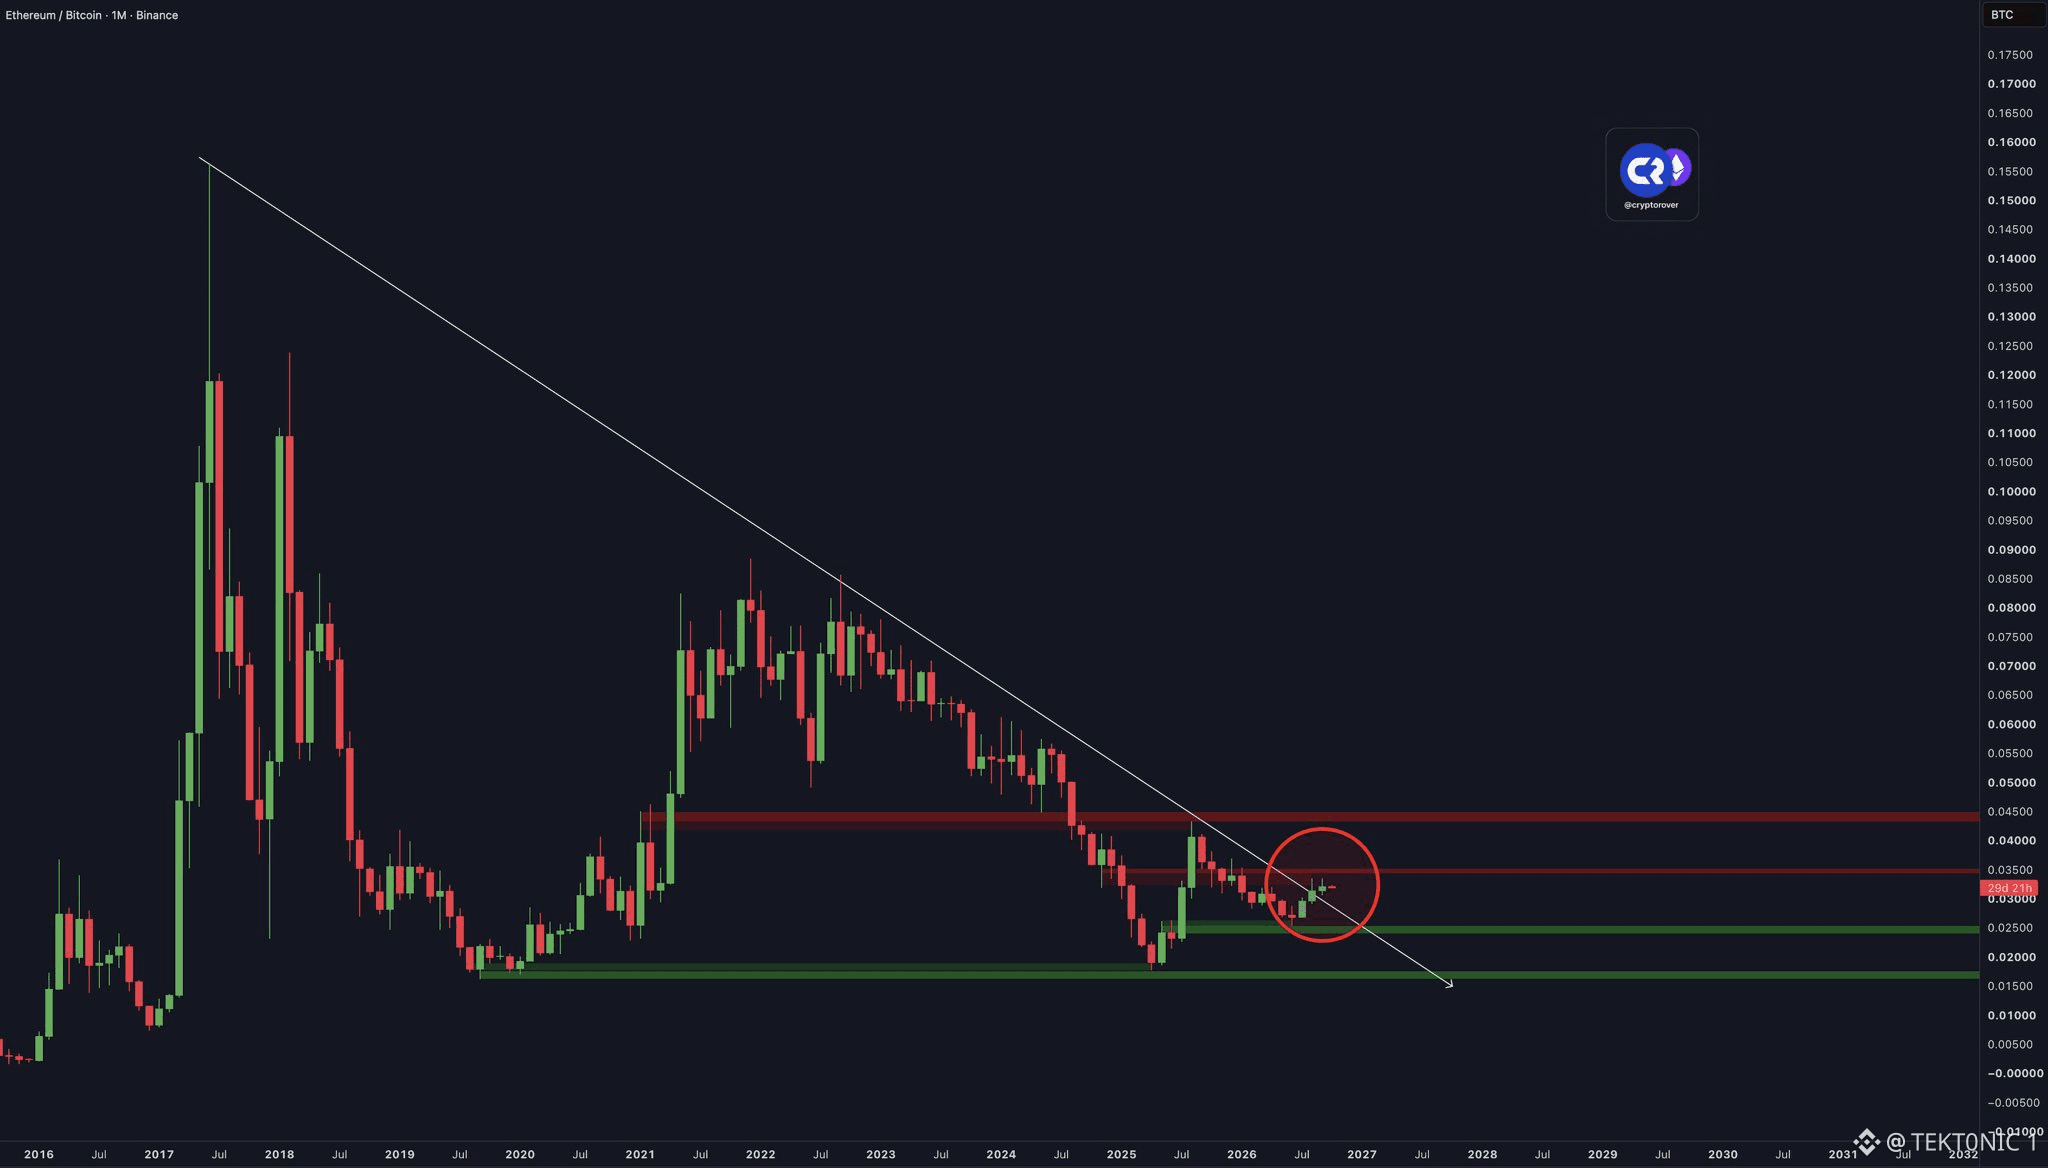
$ETH terhadap $BTC baru saja menembus garis tren menurun yang telah membatasi pasangan tersebut sejak 2017. Ini adalah terobosan bulanan sembilan tahun yang telah lama ditunggu para trader. Pasangan ini berada di dekat 0,032, setelah gagal bertahan di 0,0334 pada bulan Agustus dan lagi pada pertengahan September. Q3 sudah menunjukkan pergeseran itu. Ether menguat sekitar 67% hingga 71%. Bitcoin menguat 42,6%. ETF ether spot mencatat arus masuk sekitar $3 miliar pada kuartal tersebut setelah mengalami arus keluar pada Q2. Rasio lebih penting daripada salah satu grafik dalam dolar, karena pasangan $ETH /$BTC yang lebih tinggi adalah cara modal berputar keluar dari Bitcoin dan masuk ke Ether. harga dalam dolar belum mengikuti grafik tersebut. Ether masih berada di sekitar $2.700, dan $2.750 hingga $2.800 adalah area yang terus gagal dilampaui. Bitcoin berada di sekitar $86.000. Terobosan rasio bisa berlanjut selama kedua aset tetap bergerak dalam kisaran jika yang melemah adalah Bitcoin. penutupan bulanan di atas garis tren 2017, dan bertahan di atas 0,0334, adalah yang membuat terobosan ini tetap hidup. Jika garis tren itu hilang, itu hanya akan menjadi sumbu (wick). Jika dipertahankan, pasangan ini memiliki ruang yang belum dimilikinya sejak siklus terakhir. Itulah trading-nya. Grafiknya sudah ada.
$ETH terhadap $BTC baru saja menembus garis tren menurun yang telah membatasi pasangan tersebut sejak 2017. Ini adalah terobosan bulanan sembilan tahun yang telah lama ditunggu para trader. Pasangan ini berada di dekat 0,032, setelah gagal bertahan di 0,0334 pada bulan Agustus dan lagi pada pertengahan September. Q3 sudah menunjukkan pergeseran itu. Ether menguat sekitar 67% hingga 71%. Bitcoin menguat 42,6%. ETF ether spot mencatat arus masuk sekitar $3 miliar pada kuartal tersebut setelah mengalami arus keluar pada Q2. Rasio lebih penting daripada salah satu grafik dalam dolar, karena pasangan $ETH /$BTC yang lebih tinggi adalah cara modal berputar keluar dari Bitcoin dan masuk ke Ether. harga dalam dolar belum mengikuti grafik tersebut. Ether masih berada di sekitar $2.700, dan $2.750 hingga $2.800 adalah area yang terus gagal dilampaui. Bitcoin berada di sekitar $86.000. Terobosan rasio bisa berlanjut selama kedua aset tetap bergerak dalam kisaran jika yang melemah adalah Bitcoin. penutupan bulanan di atas garis tren 2017, dan bertahan di atas 0,0334, adalah yang membuat terobosan ini tetap hidup. Jika garis tren itu hilang, itu hanya akan menjadi sumbu (wick). Jika dipertahankan, pasangan ini memiliki ruang yang belum dimilikinya sejak siklus terakhir. Itulah trading-nya. Grafiknya sudah ada.
37
·
--
Lihat terjemahan
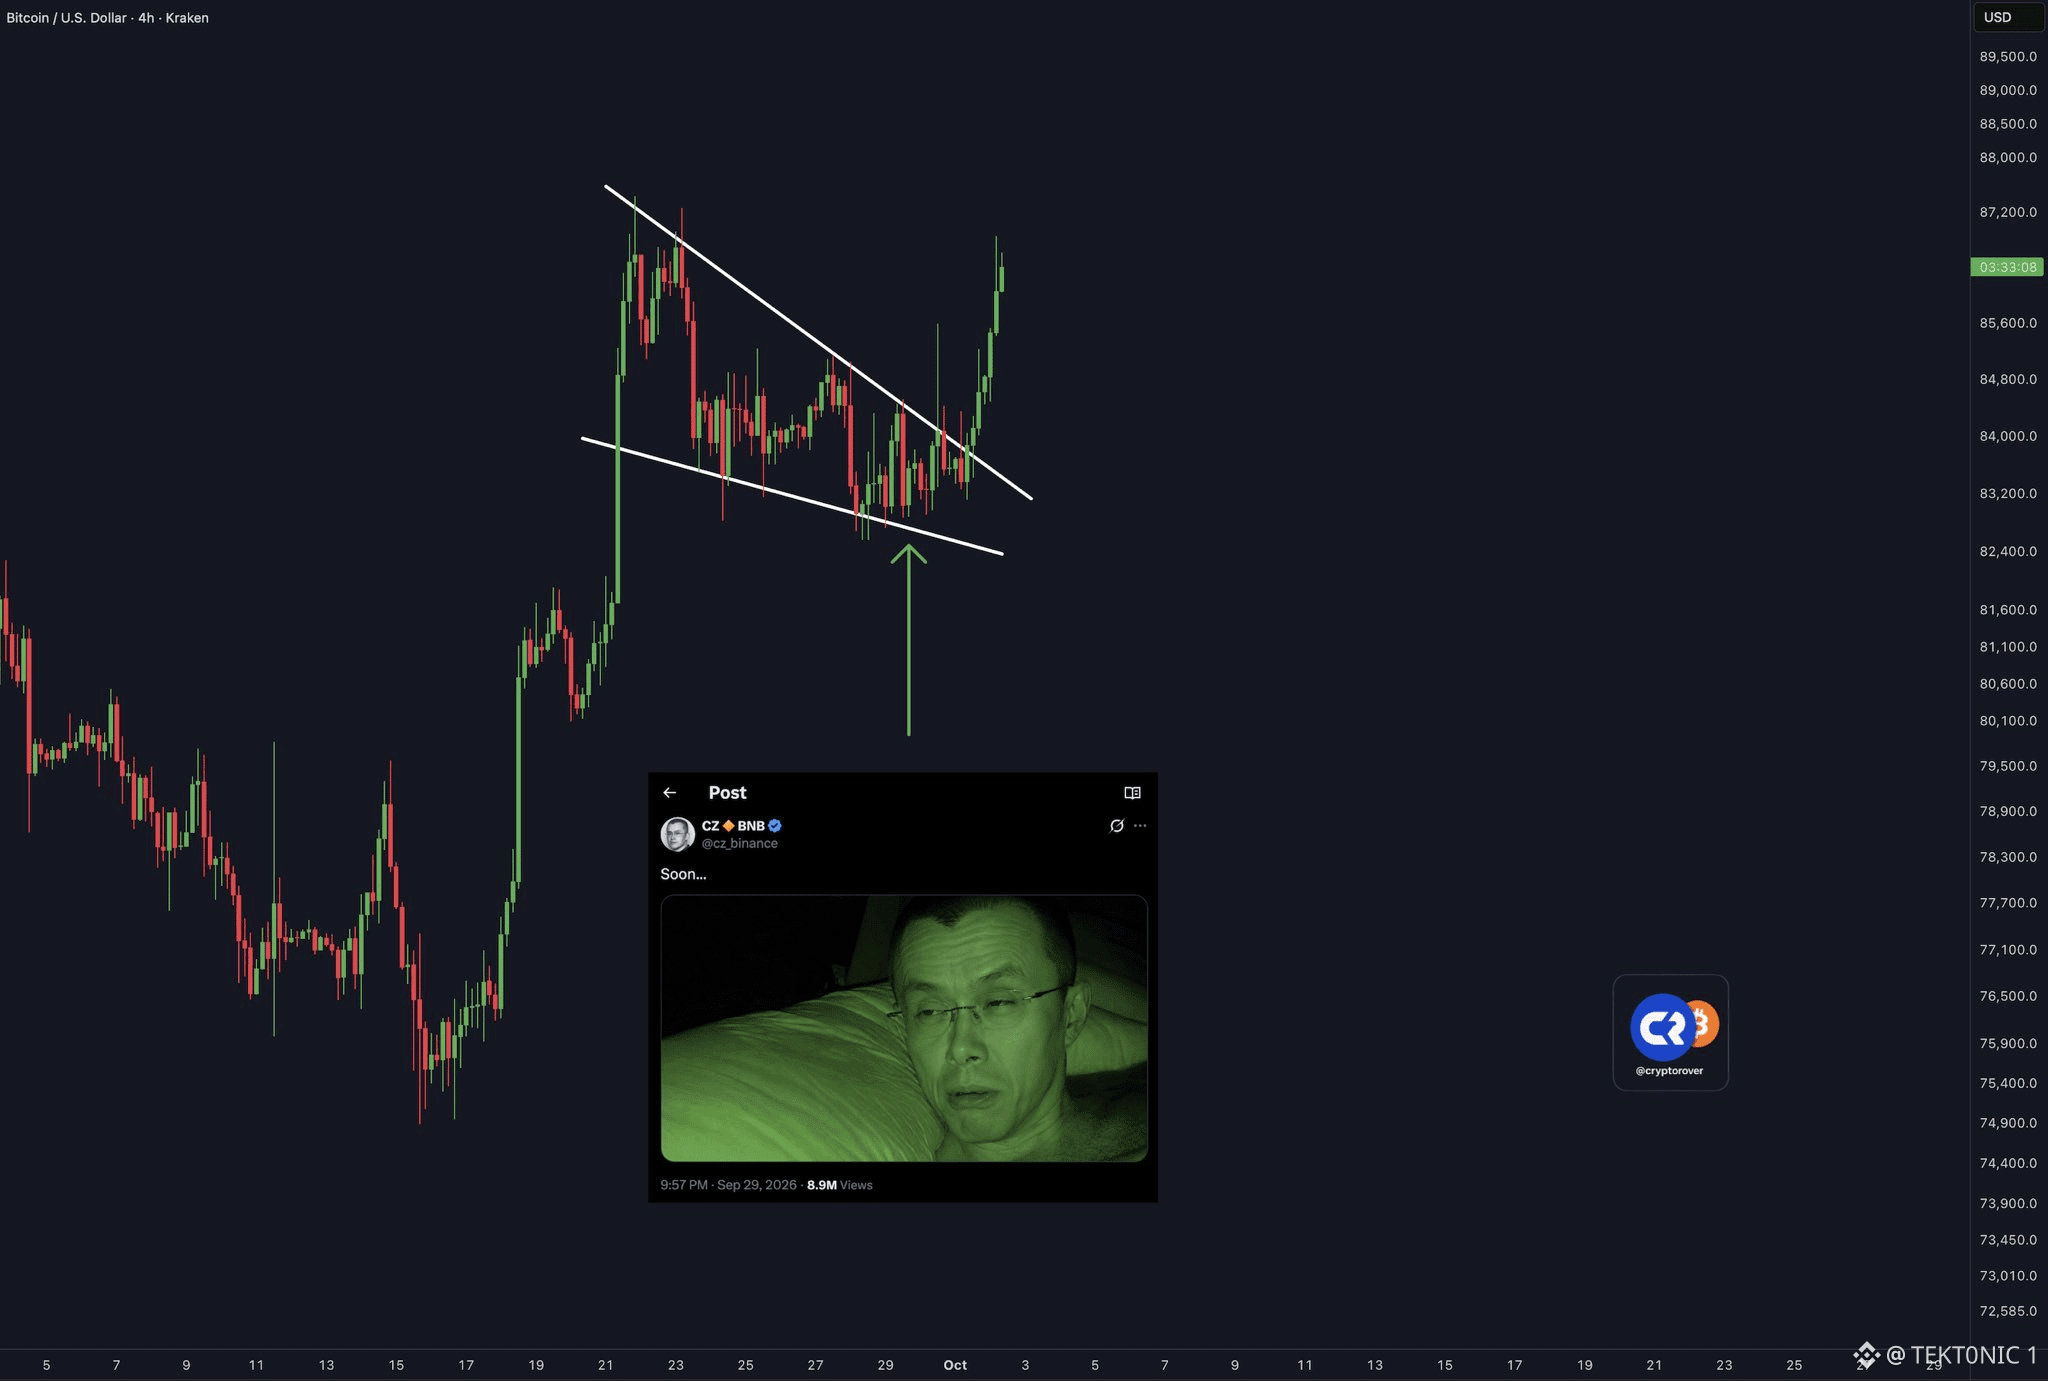
Bitcoin has finally broken out of the falling-wedge structure. $BTC briefly moved above $85K after entering October, although the move has not yet held firmly above that level. the falling wedge had been forming during the recent pullback, with traders watching the upper trendline for a confirmed breakout. CZ has also been calling for Bitcoin to break its traditional four-year cycle, arguing that stronger institutional adoption and broader crypto acceptance could change the historical pattern. now the key level is the breakout zone. a successful $BTC retest of former resistance would give traders stronger confirmation that the structure has actually shifted. breakout first. confirmation next. #BTC Price Analysis# #Bitcoin Price Prediction: What is Bitcoins next move?# $ETH #Bullish
Bitcoin has finally broken out of the falling-wedge structure. $BTC briefly moved above $85K after entering October, although the move has not yet held firmly above that level. the falling wedge had been forming during the recent pullback, with traders watching the upper trendline for a confirmed breakout. CZ has also been calling for Bitcoin to break its traditional four-year cycle, arguing that stronger institutional adoption and broader crypto acceptance could change the historical pattern. now the key level is the breakout zone. a successful $BTC retest of former resistance would give traders stronger confirmation that the structure has actually shifted. breakout first. confirmation next. #BTC Price Analysis# #Bitcoin Price Prediction: What is Bitcoins next move?# $ETH #Bullish
57
·
--
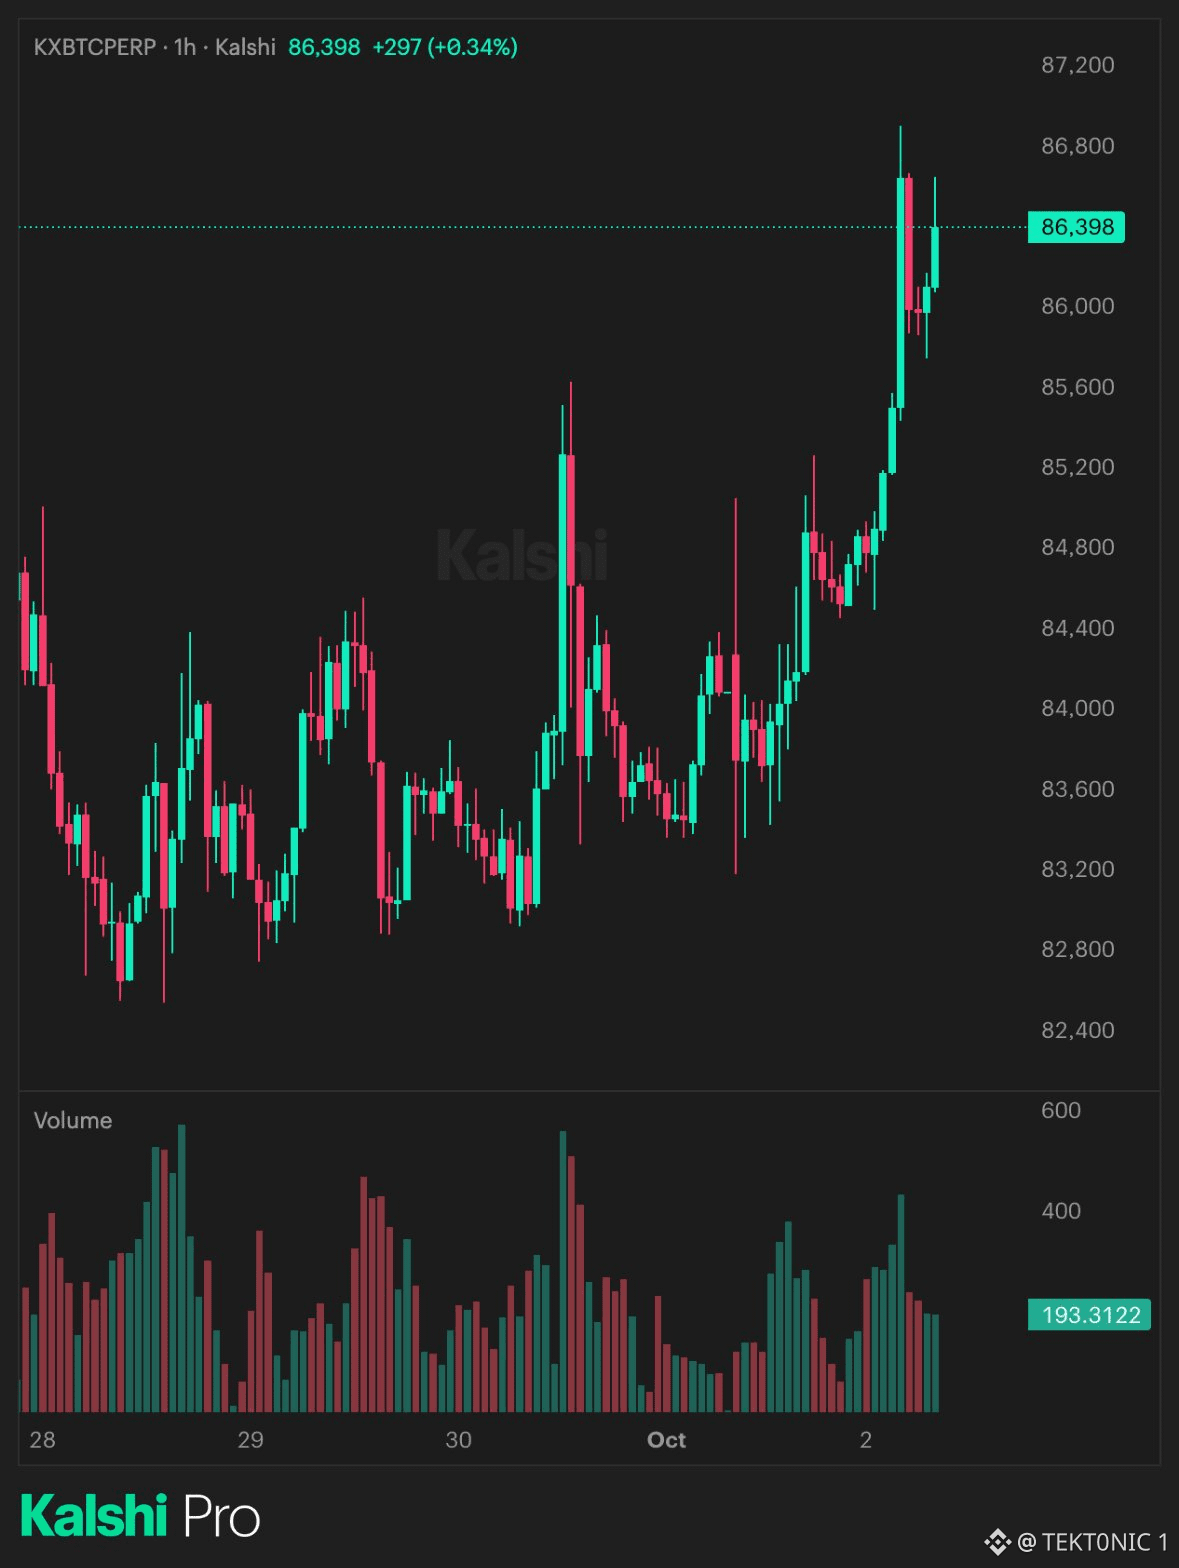
Bitcoin kembali ke level $86.000 di chart perp Kalshi, terakhir mendekati $86.398 setelah dorongan menuju $86.800. Ini adalah pemecahan bersih pertama dari level tersebut sejak pelemahan akhir September kembali di bawah $84.000. Trader Kalshi memperkirakan peluang sekitar 40% bahwa $BTC akan diperdagangkan di atas $100.000 sebelum akhir 2026. Kontrak itu berada di sekitar 17% pada 16 September, menyentuh pertengahan 40-an setelah squeeze di atas $86.000, lalu menetap kembali sekitar 34% hingga 40% menjelang pergantian bulan. Polymarket juga berada di kisaran yang sama. Harga kontrak adalah taruhan massa, bukan prediksi. Dari $86.400, $100.000 adalah sekitar pergerakan 16%. Q3 sudah terealisasi 42,6%, dan ETF spot mengumpulkan sekitar $6,3 miliar pada kuartal itu. Puncak Oktober 2025 di kisaran $126.000 masih jauh di atas. Pasar yang sama mematok pergerakan menembus $110.000 jauh lebih rendah, sekitar 20%. $86.000 adalah perebutan kembali (reclaim) pada chart per jam yang tipis. Itu belum menjadi penahanan (hold) juga. Pantau $BTC apakah penutupan harian tetap berada di atasnya, dan apakah kontrak $100.000 bertahan di 40% jika harga kembali turun di bawah $85.000. Probabilitas bergerak seiring reli. Probabilitas itu bisa bergerak kembali dengan cepat juga. #BTC Price Analysis# #Bitcoin Price Prediction: What is Bitcoins next move?# $XRP #Bullish
Bitcoin kembali ke level $86.000 di chart perp Kalshi, terakhir mendekati $86.398 setelah dorongan menuju $86.800. Ini adalah pemecahan bersih pertama dari level tersebut sejak pelemahan akhir September kembali di bawah $84.000. Trader Kalshi memperkirakan peluang sekitar 40% bahwa $BTC akan diperdagangkan di atas $100.000 sebelum akhir 2026. Kontrak itu berada di sekitar 17% pada 16 September, menyentuh pertengahan 40-an setelah squeeze di atas $86.000, lalu menetap kembali sekitar 34% hingga 40% menjelang pergantian bulan. Polymarket juga berada di kisaran yang sama. Harga kontrak adalah taruhan massa, bukan prediksi. Dari $86.400, $100.000 adalah sekitar pergerakan 16%. Q3 sudah terealisasi 42,6%, dan ETF spot mengumpulkan sekitar $6,3 miliar pada kuartal itu. Puncak Oktober 2025 di kisaran $126.000 masih jauh di atas. Pasar yang sama mematok pergerakan menembus $110.000 jauh lebih rendah, sekitar 20%. $86.000 adalah perebutan kembali (reclaim) pada chart per jam yang tipis. Itu belum menjadi penahanan (hold) juga. Pantau $BTC apakah penutupan harian tetap berada di atasnya, dan apakah kontrak $100.000 bertahan di 40% jika harga kembali turun di bawah $85.000. Probabilitas bergerak seiring reli. Probabilitas itu bisa bergerak kembali dengan cepat juga. #BTC Price Analysis# #Bitcoin Price Prediction: What is Bitcoins next move?# $XRP #Bullish
68
·
--
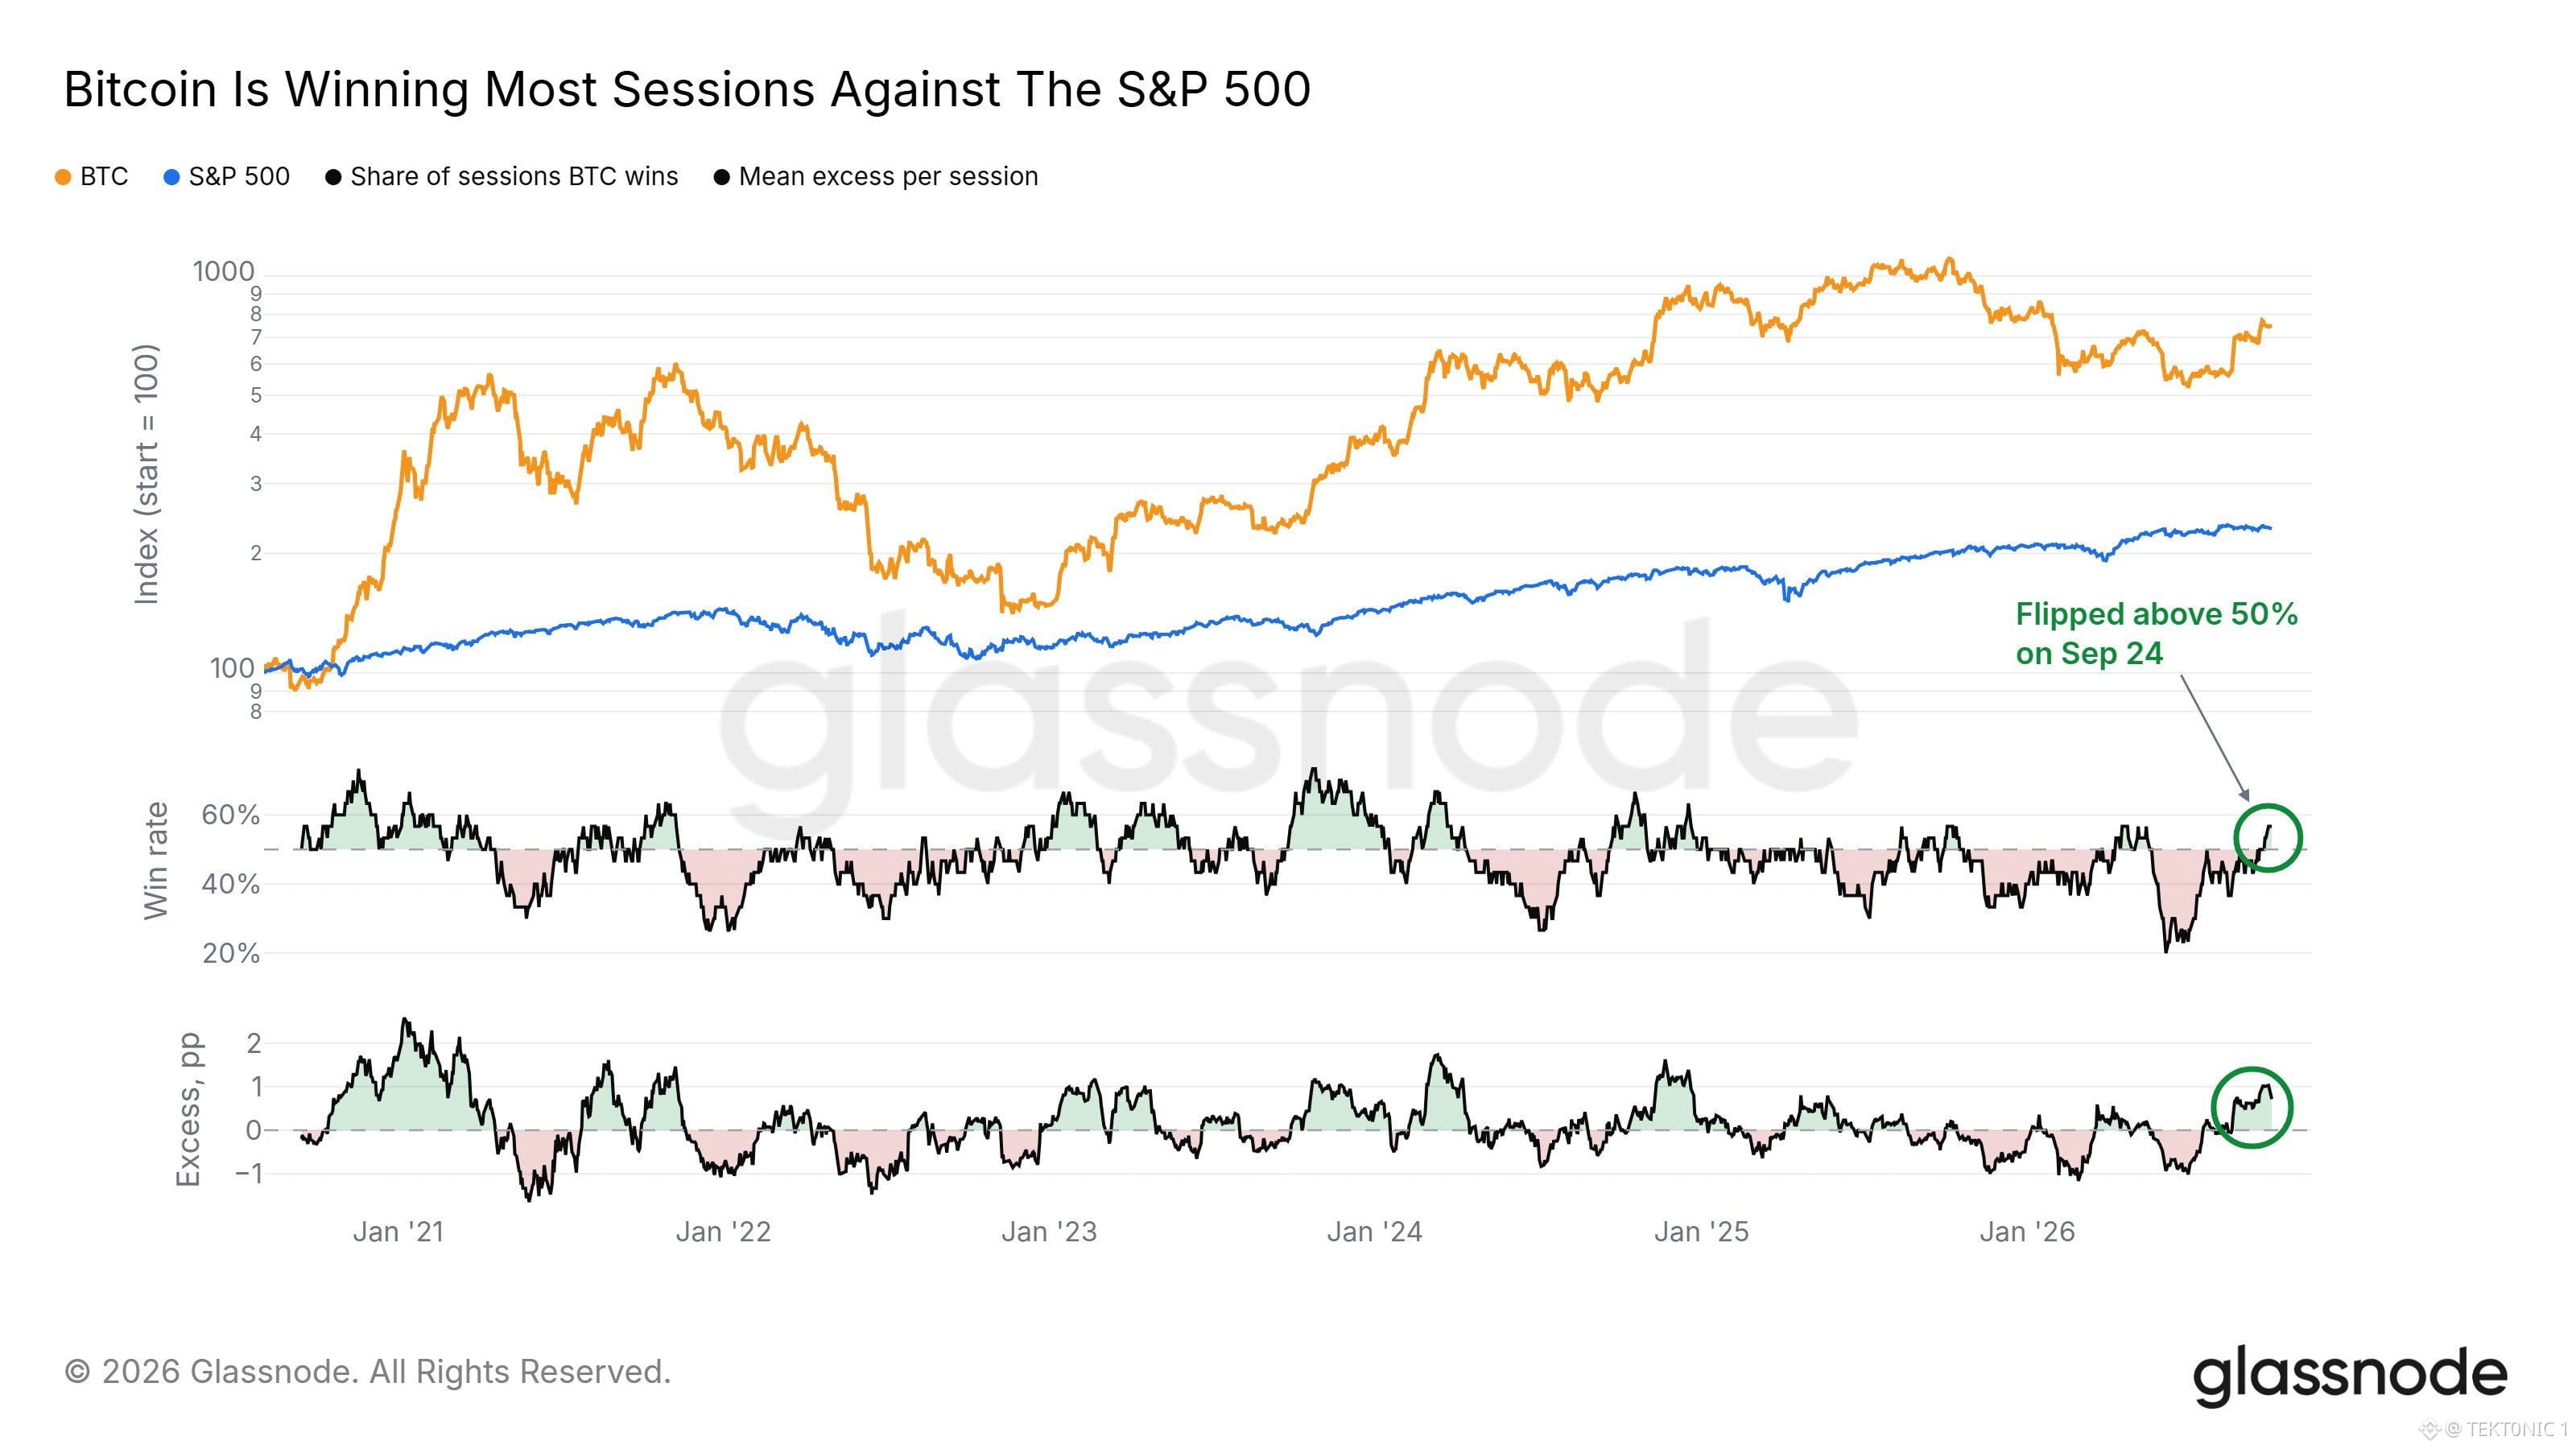
Bitcoin kembali memenangkan sebagian besar sesi melawan S&P 500. Pada grafik Glassnode, porsi hari ketika Bitcoin mengalahkan indeks kembali melompat di atas 50% pada 24 September. Pada bulan Juni, porsi itu sekitar satu dari lima sesi—bacaan terlemah pada grafik ini dalam enam tahun. Rata-rata imbal hasil berlebih per sesi saat itu negatif. Kedua garis kini berwarna hijau lagi. Tingkat kemenangan kembali di atas 50%, dan rata-rata sesi bernilai positif dibanding saham. Panel atas adalah perbandingan yang lebih panjang. Bitcoin, yang diindeks ke 100, masih jauh di depan S&P 500 sepanjang seri. S&P telah naik dengan jalur yang stabil. Bitcoin sempat kehilangan posisi pada paruh pertama, lalu pulih di kuartal ke-3. Saham hampir tidak banyak bergerak sementara tingkat kemenangan itu berbalik. Satu perbedaan penting: tingkat kemenangan adalah berapa hari Bitcoin finis di depan, bukan seberapa besar ia bertambah. Beberapa hari turun yang besar masih bisa menghapus rangkaian kemenangan kecil. 24 September adalah titik balik dalam hitungan, bukan siklus baru dengan sendirinya. Perhatikan apakah porsi tersebut tetap di atas 50% hingga Oktober, dan apakah garis kelebihan (excess) tetap hijau jika S&P mulai menunjukkan tren. Bid yang bersifat spesifik muncul ketika Bitcoin terus menang pada hari-hari saat saham tidak. Satu minggu di atas garis belum cukup untuk menyebutnya demikian. #Analisis Harga BTC# #Prediksi Harga Bitcoin: Apa Langkah Selanjutnya Bitcoin?# $BTC $XRP #Bullish
Bitcoin kembali memenangkan sebagian besar sesi melawan S&P 500. Pada grafik Glassnode, porsi hari ketika Bitcoin mengalahkan indeks kembali melompat di atas 50% pada 24 September. Pada bulan Juni, porsi itu sekitar satu dari lima sesi—bacaan terlemah pada grafik ini dalam enam tahun. Rata-rata imbal hasil berlebih per sesi saat itu negatif. Kedua garis kini berwarna hijau lagi. Tingkat kemenangan kembali di atas 50%, dan rata-rata sesi bernilai positif dibanding saham. Panel atas adalah perbandingan yang lebih panjang. Bitcoin, yang diindeks ke 100, masih jauh di depan S&P 500 sepanjang seri. S&P telah naik dengan jalur yang stabil. Bitcoin sempat kehilangan posisi pada paruh pertama, lalu pulih di kuartal ke-3. Saham hampir tidak banyak bergerak sementara tingkat kemenangan itu berbalik. Satu perbedaan penting: tingkat kemenangan adalah berapa hari Bitcoin finis di depan, bukan seberapa besar ia bertambah. Beberapa hari turun yang besar masih bisa menghapus rangkaian kemenangan kecil. 24 September adalah titik balik dalam hitungan, bukan siklus baru dengan sendirinya. Perhatikan apakah porsi tersebut tetap di atas 50% hingga Oktober, dan apakah garis kelebihan (excess) tetap hijau jika S&P mulai menunjukkan tren. Bid yang bersifat spesifik muncul ketika Bitcoin terus menang pada hari-hari saat saham tidak. Satu minggu di atas garis belum cukup untuk menyebutnya demikian. #Analisis Harga BTC# #Prediksi Harga Bitcoin: Apa Langkah Selanjutnya Bitcoin?# $BTC $XRP #Bullish
·
--
Lihat terjemahan
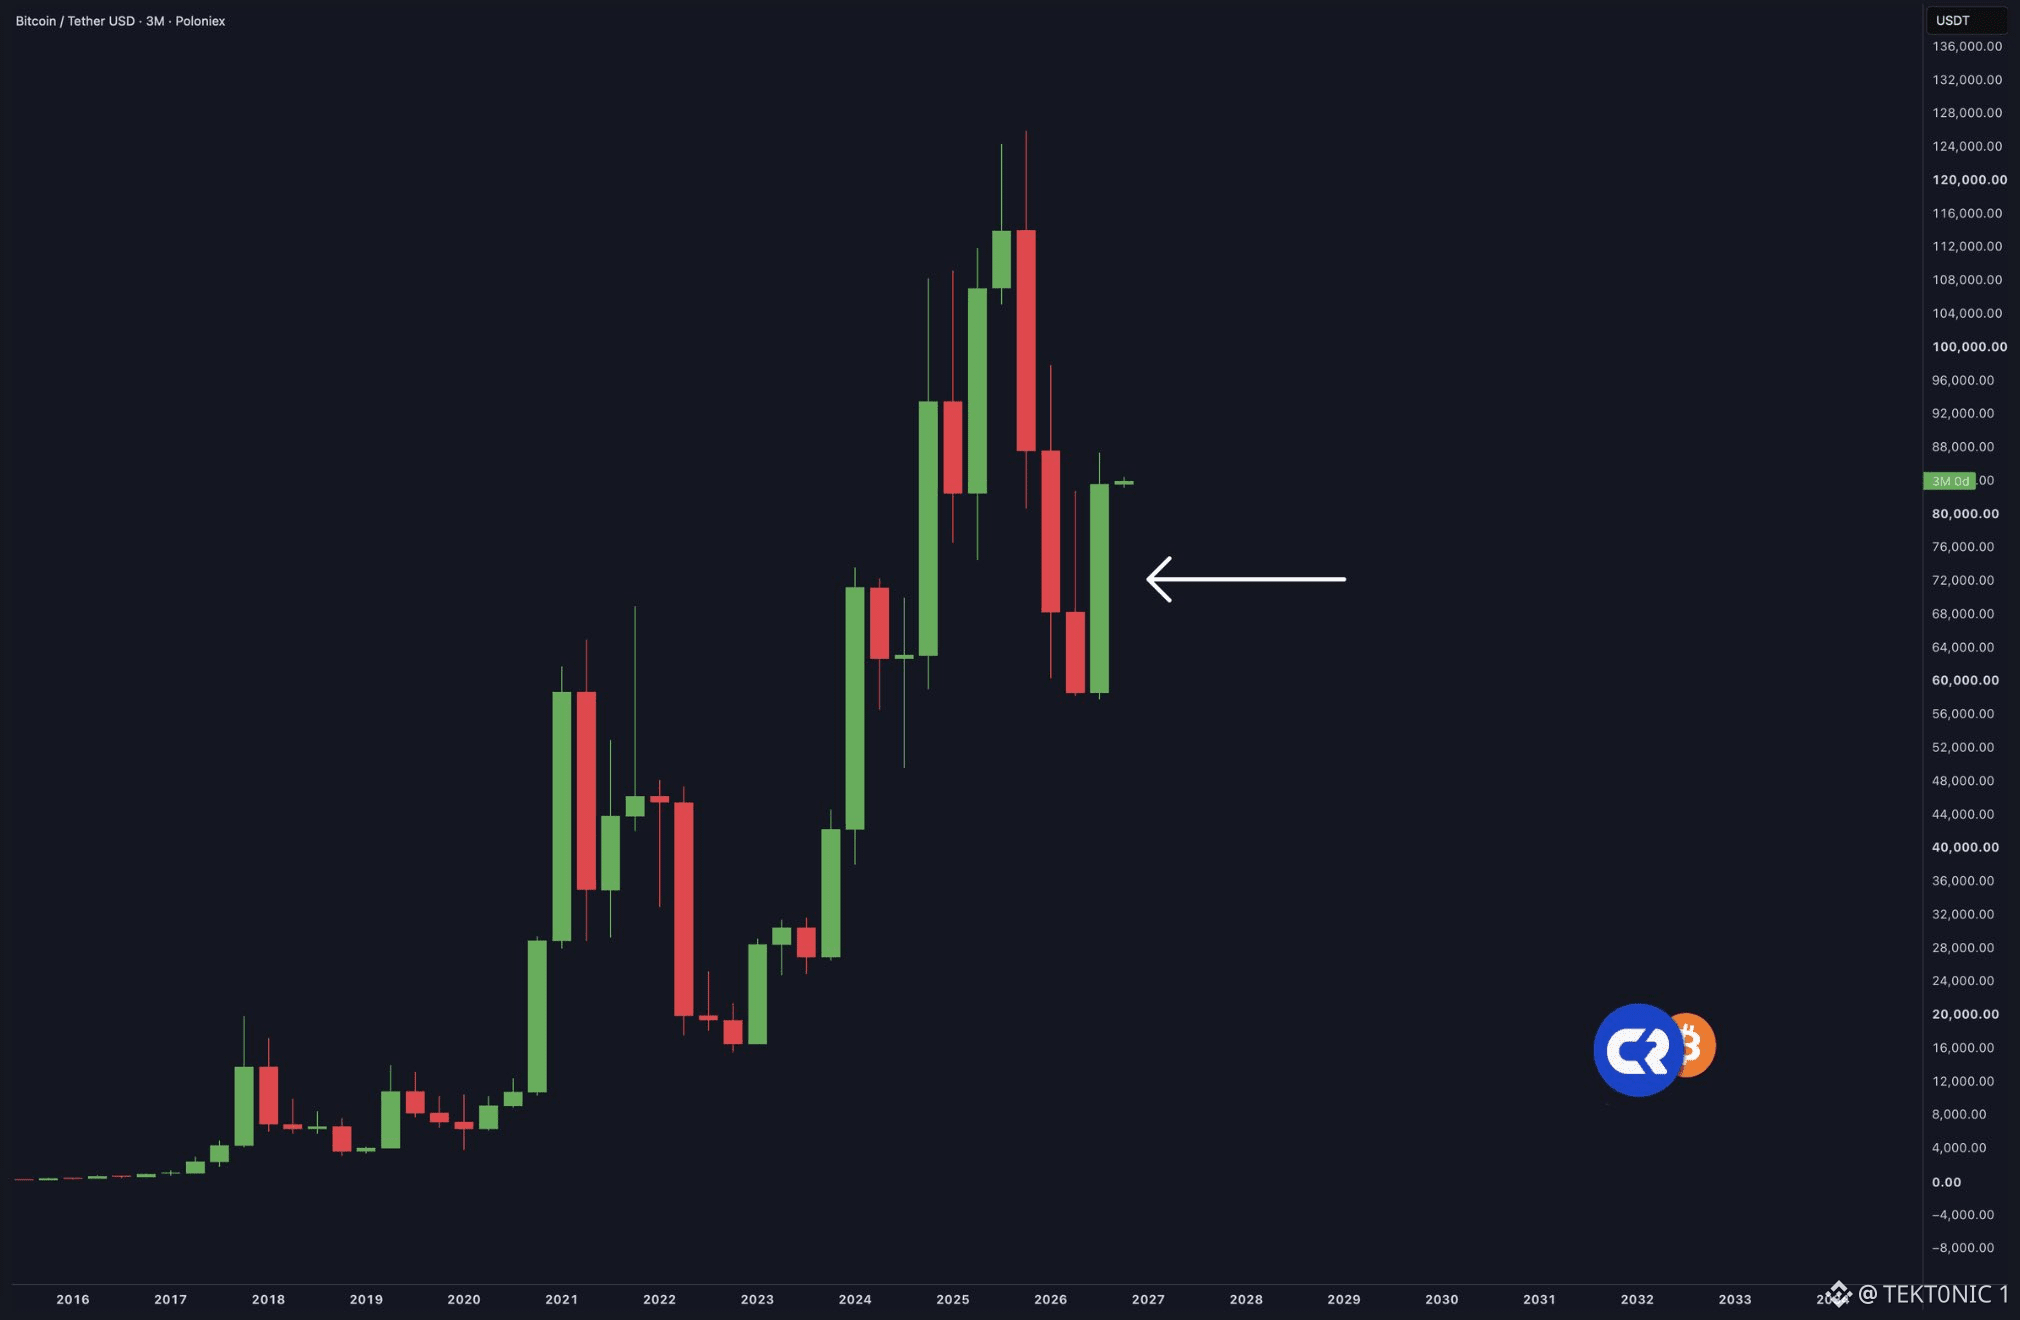
$BTC just closed a quarter that took back most of the prior six months. On the 3-month chart, the latest candle is green after two red ones. Q1 was −22.1%. Q2 was −14.1%. Together that was about a 33% hole from the start of the year to the end of June, with price near $58,600. Q3 then gained 42.6%, the best third quarter since 2017, and price finished near $84,000. That is the candle the arrow is pointing at. the recovery is real. It is not a full reset. A 33% drop needs about a 50% rebound to get back to the same price. 42.6% does not clear that. The year is still slightly red. The 2025 high near $126,000 is still well above this candle. a 3-month $BTC candle hides the path. August did most of the work. September only added about 6%. Spot ETFs took in about $6.3 billion in the quarter, then the nine-day inflow streak broke on the last session. a green quarter after two red ones is a repair, not a new high. Watch whether October holds $84,000 and whether the next 3-month candle builds on this one. The pain of the first half is mostly retraced. It is not erased. #BTC Price Analysis# #Bitcoin Price Prediction: What is Bitcoins next move?# $XRP #Bullish
$BTC just closed a quarter that took back most of the prior six months. On the 3-month chart, the latest candle is green after two red ones. Q1 was −22.1%. Q2 was −14.1%. Together that was about a 33% hole from the start of the year to the end of June, with price near $58,600. Q3 then gained 42.6%, the best third quarter since 2017, and price finished near $84,000. That is the candle the arrow is pointing at. the recovery is real. It is not a full reset. A 33% drop needs about a 50% rebound to get back to the same price. 42.6% does not clear that. The year is still slightly red. The 2025 high near $126,000 is still well above this candle. a 3-month $BTC candle hides the path. August did most of the work. September only added about 6%. Spot ETFs took in about $6.3 billion in the quarter, then the nine-day inflow streak broke on the last session. a green quarter after two red ones is a repair, not a new high. Watch whether October holds $84,000 and whether the next 3-month candle builds on this one. The pain of the first half is mostly retraced. It is not erased. #BTC Price Analysis# #Bitcoin Price Prediction: What is Bitcoins next move?# $XRP #Bullish
30
·
--
Lihat terjemahan
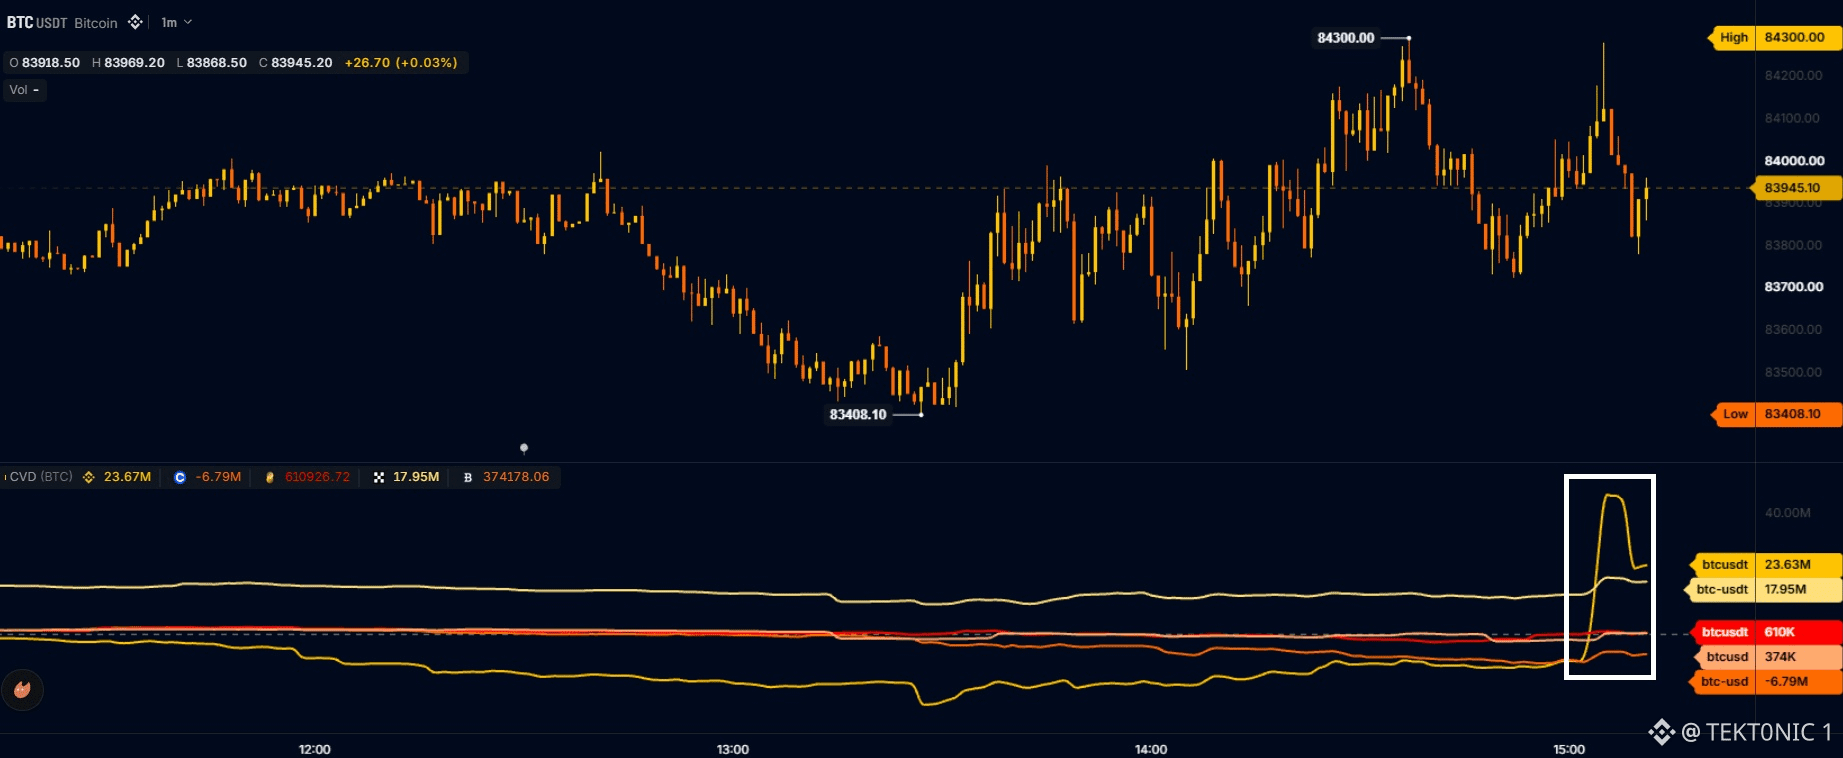
Bitcoin’s Binance CVD just spiked on the one-minute chart. The yellow $BTC line jumped toward $40 million around 15:00, then eased, while price tagged $84,300 and slipped back to about $83,945. CVD is cumulative volume delta, buy volume minus sell volume. A vertical jump means aggressive buyers lifted offers on that market. Traders are reading the spike as a large Binance buyer, the kind of flow a TWAP can leave when it hits the book in size. A one-minute burst is not proof of a scheduled program. It can also be one market order. the rest of the panel did not follow. Coinbase USD is still about −$6.8 million on the session. The other $BTC lines stayed flat. Price made a $84,300 high and gave most of it back. The buy showed up. It did not hold the high. one distinction: this is one venue’s delta, not net demand across every exchange. Watch whether the Binance line keeps stepping higher after 15:00, or whether this was a single clip that already faded. A real program leaves a series of steps. One spike does not. #Bitcoin Price Prediction: What is Bitcoins next move?# #BTC Price Analysis# $XRP
Bitcoin’s Binance CVD just spiked on the one-minute chart. The yellow $BTC line jumped toward $40 million around 15:00, then eased, while price tagged $84,300 and slipped back to about $83,945. CVD is cumulative volume delta, buy volume minus sell volume. A vertical jump means aggressive buyers lifted offers on that market. Traders are reading the spike as a large Binance buyer, the kind of flow a TWAP can leave when it hits the book in size. A one-minute burst is not proof of a scheduled program. It can also be one market order. the rest of the panel did not follow. Coinbase USD is still about −$6.8 million on the session. The other $BTC lines stayed flat. Price made a $84,300 high and gave most of it back. The buy showed up. It did not hold the high. one distinction: this is one venue’s delta, not net demand across every exchange. Watch whether the Binance line keeps stepping higher after 15:00, or whether this was a single clip that already faded. A real program leaves a series of steps. One spike does not. #Bitcoin Price Prediction: What is Bitcoins next move?# #BTC Price Analysis# $XRP
23
·
--
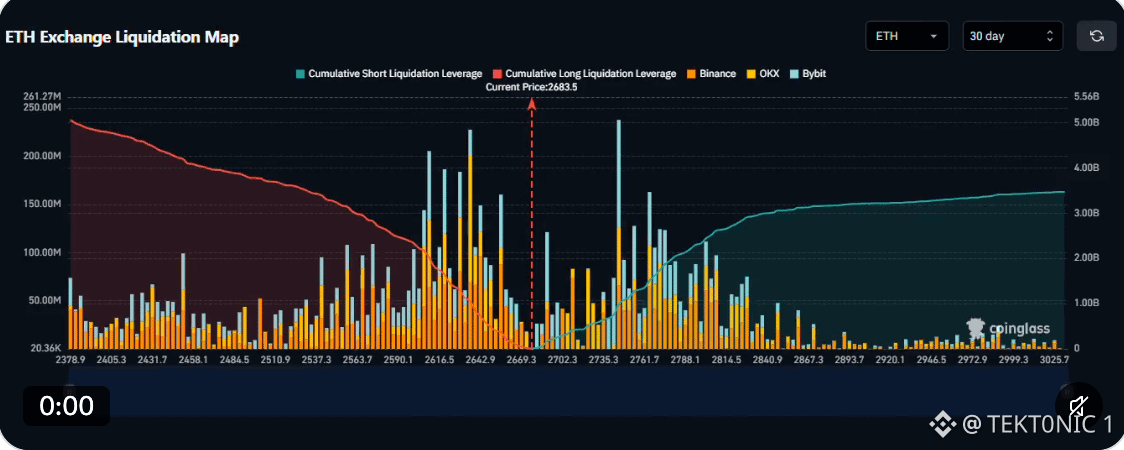
$ETH sedang diperdagangkan di antara dua klaster likuidasi di peta Coinglass. Harga saat ini sekitar $2.683. Likuidasi short terkumpul sekitar $2.735 hingga $2.760, dengan batang yang lebih rapat di dekat $2.750. Likuidasi long berada lebih rendah, dengan batang yang lebih berat sekitar $2.600 hingga $2.620. Binance, OKX, dan Bybit menyumbang sebagian besar ukuran. garis kumulatifnya cocok dengan batang. Leverage likuidasi short meningkat saat harga bergerak lebih tinggi. Leverage likuidasi long sudah besar di bawah pasar dan menipis hingga $2.683. satu perbedaan penting: ini adalah posisi leveraged yang diperkirakan, bukan order yang menunggu. Harga tidak harus menyentuh salah satu level itu, dan ia bisa menembus satu sisi lalu berbalik sebelum sisi lainnya tersentuh. $2.750 dan $2.600 berjarak sekitar 2,5% dan 3%. namun, kedua klaster itu cukup dekat untuk berdampak. Dorongan melewati $2.750 akan membersihkan sisi short terdekat. Penurunan menembus $2.600 akan membersihkan sisi long terdekat. Mengambil keduanya dalam satu gerakan membutuhkan rentang yang lebih lebar daripada yang ditunjukkan peta ini. #BTC Price Analysis# #Altcoin Season# $BTC $ETH #Ethereum
$ETH sedang diperdagangkan di antara dua klaster likuidasi di peta Coinglass. Harga saat ini sekitar $2.683. Likuidasi short terkumpul sekitar $2.735 hingga $2.760, dengan batang yang lebih rapat di dekat $2.750. Likuidasi long berada lebih rendah, dengan batang yang lebih berat sekitar $2.600 hingga $2.620. Binance, OKX, dan Bybit menyumbang sebagian besar ukuran. garis kumulatifnya cocok dengan batang. Leverage likuidasi short meningkat saat harga bergerak lebih tinggi. Leverage likuidasi long sudah besar di bawah pasar dan menipis hingga $2.683. satu perbedaan penting: ini adalah posisi leveraged yang diperkirakan, bukan order yang menunggu. Harga tidak harus menyentuh salah satu level itu, dan ia bisa menembus satu sisi lalu berbalik sebelum sisi lainnya tersentuh. $2.750 dan $2.600 berjarak sekitar 2,5% dan 3%. namun, kedua klaster itu cukup dekat untuk berdampak. Dorongan melewati $2.750 akan membersihkan sisi short terdekat. Penurunan menembus $2.600 akan membersihkan sisi long terdekat. Mengambil keduanya dalam satu gerakan membutuhkan rentang yang lebih lebar daripada yang ditunjukkan peta ini. #BTC Price Analysis# #Altcoin Season# $BTC $ETH #Ethereum
42
·
--
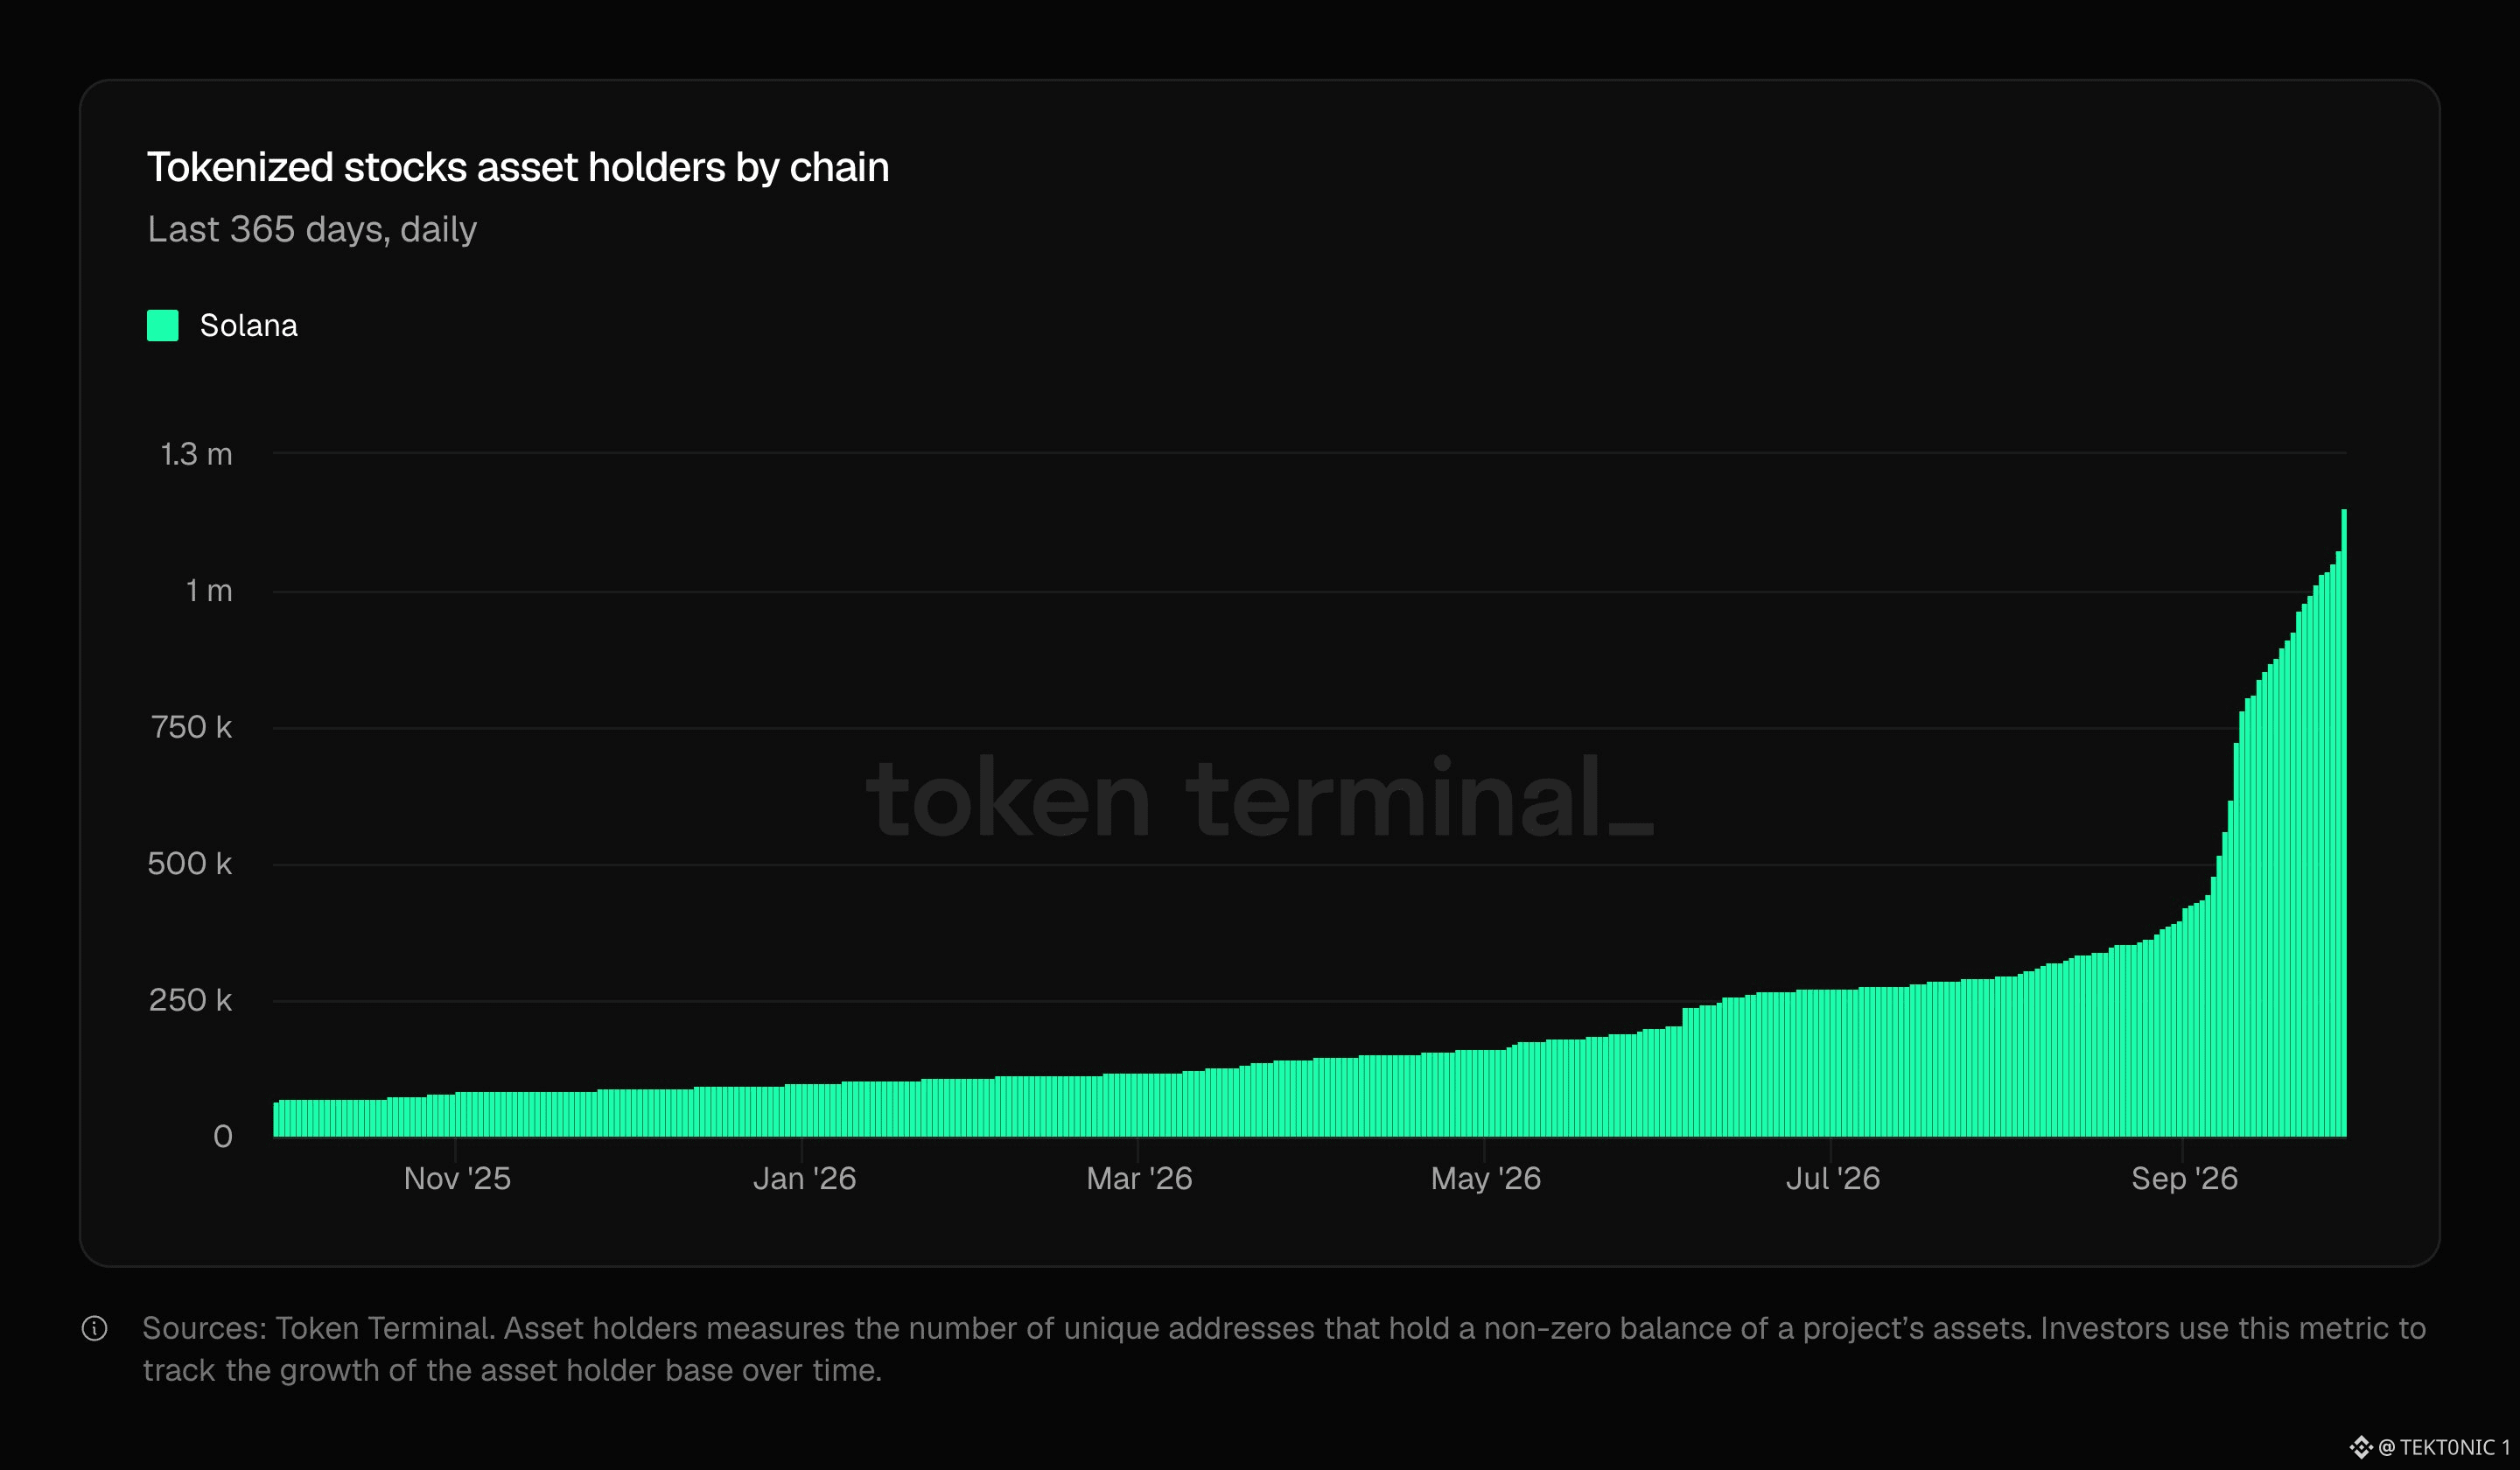
Solana mengalami pertumbuhan pesat pada ekuitas tokenized. Data terbaru menunjukkan sekitar 1,2M pemegang saham tokenized di $SOL, sebagai rekor baru. Ini merupakan peningkatan besar dibanding 278.784 pemegang pada 1 Juli, sehingga pertumbuhan pemegang mencapai lebih dari 4x dalam kurun waktu kurang lebih tiga bulan. Pertumbuhan ini datang dari beberapa penerbit. xStocks memiliki lebih dari 626K pemegang, sementara Backpack telah tumbuh menjadi lebih dari 271K. PreStocks juga telah melewati 100K. Pada saat yang sama, kapitalisasi pasar ekuitas tokenized Solana naik 43% pada Q3 menjadi $514,8M, sementara volume DEX mencapai $5,76B. Ekuitas tokenized kini melampaui kasus penggunaan yang bersifat niche. 1,2M pemegang adalah tonggak penting bagi ekuitas onchain di ekosistem $SOL. #BTC Price Analysis# #Macro Insights# #Altcoin Season# $BTC
Solana mengalami pertumbuhan pesat pada ekuitas tokenized. Data terbaru menunjukkan sekitar 1,2M pemegang saham tokenized di $SOL, sebagai rekor baru. Ini merupakan peningkatan besar dibanding 278.784 pemegang pada 1 Juli, sehingga pertumbuhan pemegang mencapai lebih dari 4x dalam kurun waktu kurang lebih tiga bulan. Pertumbuhan ini datang dari beberapa penerbit. xStocks memiliki lebih dari 626K pemegang, sementara Backpack telah tumbuh menjadi lebih dari 271K. PreStocks juga telah melewati 100K. Pada saat yang sama, kapitalisasi pasar ekuitas tokenized Solana naik 43% pada Q3 menjadi $514,8M, sementara volume DEX mencapai $5,76B. Ekuitas tokenized kini melampaui kasus penggunaan yang bersifat niche. 1,2M pemegang adalah tonggak penting bagi ekuitas onchain di ekosistem $SOL. #BTC Price Analysis# #Macro Insights# #Altcoin Season# $BTC
57
·
--
Lihat terjemahan
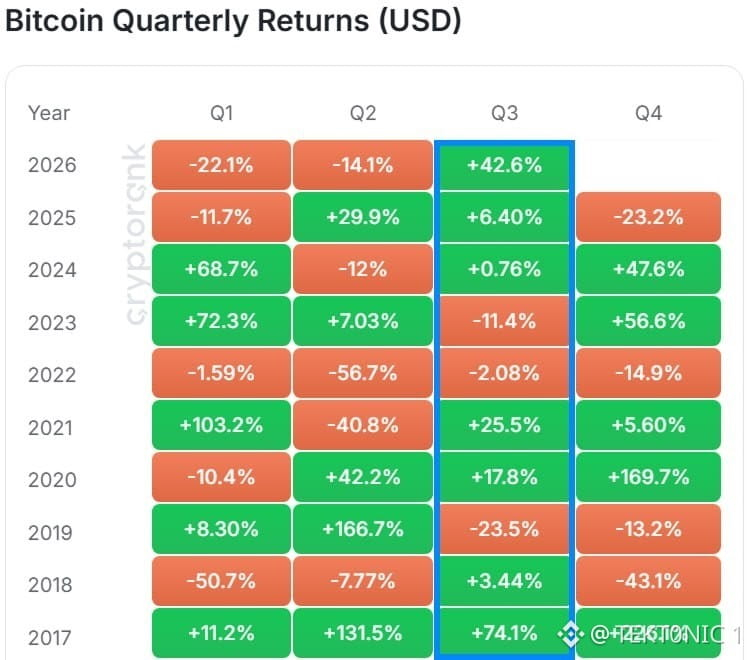
according to cryptorank, $BTC gained 42.6% in q3 2026. that is the strongest third quarter on this chart since 2017, when q3 was +74.1%. the next best recent q3 was 2021 at +25.5%. 2020 was +17.8%. 2025 was only +6.4%. a 42% quarter is the outlier. the first half is why the bounce looks so large. q1 was −22.1%. q2 was −14.1%. two red quarters, then one green quarter that recovered most of the hole. price went from about $58,600 at the start of july to about $84,000. the year is still slightly red. the october 2025 high near $126,000 is still well above. a hot q3 does not lock q4. on this same chart, 2024 q3 was flat at +0.76% and q4 was +47.6%. 2025 q3 was +6.4% and q4 was −23.2%. 2017 q3 was +74.1% and q4 was +226%. the next cell can go either way. spot etfs took in about $6.3 billion in the quarter. that demand helped. it does not price october. watch whether $BTC weekly closes hold the 50-week average near $79,000, and whether etf flows stay green after the nine-day streak broke on the last session of september. the quarter is closed. q4 is empty on this chart. #Bitcoin Price Prediction: What is Bitcoins next move?# #BTC Price Analysis# $XRP #Bullish
according to cryptorank, $BTC gained 42.6% in q3 2026. that is the strongest third quarter on this chart since 2017, when q3 was +74.1%. the next best recent q3 was 2021 at +25.5%. 2020 was +17.8%. 2025 was only +6.4%. a 42% quarter is the outlier. the first half is why the bounce looks so large. q1 was −22.1%. q2 was −14.1%. two red quarters, then one green quarter that recovered most of the hole. price went from about $58,600 at the start of july to about $84,000. the year is still slightly red. the october 2025 high near $126,000 is still well above. a hot q3 does not lock q4. on this same chart, 2024 q3 was flat at +0.76% and q4 was +47.6%. 2025 q3 was +6.4% and q4 was −23.2%. 2017 q3 was +74.1% and q4 was +226%. the next cell can go either way. spot etfs took in about $6.3 billion in the quarter. that demand helped. it does not price october. watch whether $BTC weekly closes hold the 50-week average near $79,000, and whether etf flows stay green after the nine-day streak broke on the last session of september. the quarter is closed. q4 is empty on this chart. #Bitcoin Price Prediction: What is Bitcoins next move?# #BTC Price Analysis# $XRP #Bullish
79
·
--
Semua orang ingin menjadi Warren Buffett berikutnya. Artinya semua orang ingin membangun jenis kekayaan yang dibangun Buffett. Tapi hampir tidak ada yang mau meniru bagian yang sebenarnya memakan waktu puluhan tahun. Buffett membeli Coca-Cola pada 1988 dan mengatakan bahwa periode kepemilikan favoritnya adalah selamanya. Berkshire masih memegang posisi itu sampai hari ini. Sekarang bayangkan menerapkan pola pikir itu pada $BTC. Kebanyakan trader kesulitan bertahan saat mengalami penurunan 20–30%, apalagi melewati beberapa siklus pasar. Keunggulan Buffett bukanlah menemukan peluang perdagangan setiap minggu. Keunggulannya adalah memiliki aset yang ia pahami, tetap sabar, dan membiarkan compounding bekerja. Semua orang ingin menjadi kaya dengan cepat. Buffett membangun kekayaan secara perlahan, sabar, dan selama puluhan tahun. Bagian itu jauh lebih sulit untuk ditiru. #Analisis Harga #BTC# #Prediksi Harga Bitcoin: Apa langkah berikutnya Bitcoin?# $BTC $XRP #Bullish
Semua orang ingin menjadi Warren Buffett berikutnya. Artinya semua orang ingin membangun jenis kekayaan yang dibangun Buffett. Tapi hampir tidak ada yang mau meniru bagian yang sebenarnya memakan waktu puluhan tahun. Buffett membeli Coca-Cola pada 1988 dan mengatakan bahwa periode kepemilikan favoritnya adalah selamanya. Berkshire masih memegang posisi itu sampai hari ini. Sekarang bayangkan menerapkan pola pikir itu pada $BTC. Kebanyakan trader kesulitan bertahan saat mengalami penurunan 20–30%, apalagi melewati beberapa siklus pasar. Keunggulan Buffett bukanlah menemukan peluang perdagangan setiap minggu. Keunggulannya adalah memiliki aset yang ia pahami, tetap sabar, dan membiarkan compounding bekerja. Semua orang ingin menjadi kaya dengan cepat. Buffett membangun kekayaan secara perlahan, sabar, dan selama puluhan tahun. Bagian itu jauh lebih sulit untuk ditiru. #Analisis Harga #BTC# #Prediksi Harga Bitcoin: Apa langkah berikutnya Bitcoin?# $BTC $XRP #Bullish
·
--
Lihat terjemahan
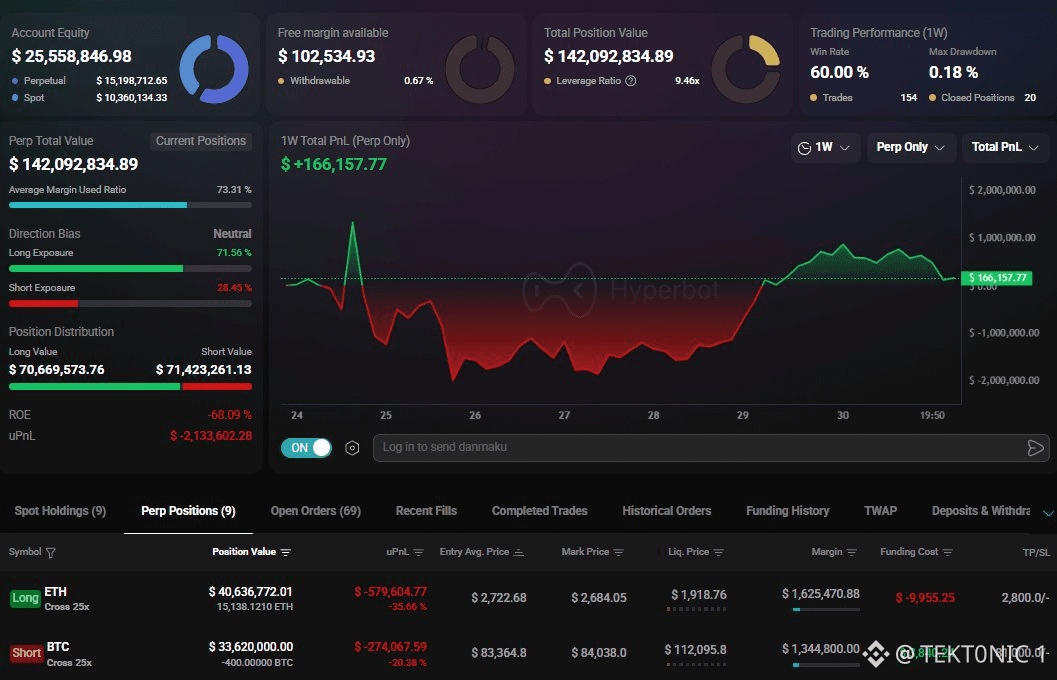
a whale is going long on $ETH and shorting $BTC at the same time. the ether position is $40.64 million, 15,138 ETH at 25x, entry $2,722.68. the bitcoin position is $33.62 million, 400 BTC short at 25x, entry $83,365. both sides are red. ether is about −$580,000. bitcoin is about −$274,000. equity behind the positions is $25.6 million. perp exposure is $142 million. leverage is 9.5 times. free margin is $102,500, or 0.67%. long value is $70.67 million. short value is $71.42 million. direction is tagged neutral. nine perps are open. we only see these two. ether did outperform bitcoin this quarter. ETH is up about 67–71% in q3. bitcoin is up about 43%. $ETH / $BTC sits near 0.032, still under the mid-september high near 0.0334. spot bitcoin etfs still took the larger bid. long ether versus short bitcoin is how you express that gap without a net dollar bet. it is not a lock that the gap keeps running. 25 times on both sides with almost no free margin means the next $1,000 move forces the issue. watch whether those two sizes stay on after funding, and whether the other seven perps stay balanced. the pair is only the part that is visible. #BTC Price Analysis# #Bitcoin Price Prediction: What is Bitcoins next move?# #Ethereum #Macro Insights#
a whale is going long on $ETH and shorting $BTC at the same time. the ether position is $40.64 million, 15,138 ETH at 25x, entry $2,722.68. the bitcoin position is $33.62 million, 400 BTC short at 25x, entry $83,365. both sides are red. ether is about −$580,000. bitcoin is about −$274,000. equity behind the positions is $25.6 million. perp exposure is $142 million. leverage is 9.5 times. free margin is $102,500, or 0.67%. long value is $70.67 million. short value is $71.42 million. direction is tagged neutral. nine perps are open. we only see these two. ether did outperform bitcoin this quarter. ETH is up about 67–71% in q3. bitcoin is up about 43%. $ETH / $BTC sits near 0.032, still under the mid-september high near 0.0334. spot bitcoin etfs still took the larger bid. long ether versus short bitcoin is how you express that gap without a net dollar bet. it is not a lock that the gap keeps running. 25 times on both sides with almost no free margin means the next $1,000 move forces the issue. watch whether those two sizes stay on after funding, and whether the other seven perps stay balanced. the pair is only the part that is visible. #BTC Price Analysis# #Bitcoin Price Prediction: What is Bitcoins next move?# #Ethereum #Macro Insights#
Masuk untuk menjelajahi konten lainnya
Bergabunglah dengan pengguna kripto global di Binance Square
⚡️ Dapatkan informasi terbaru dan berguna tentang kripto.
💬 Dipercayai oleh bursa kripto terbesar di dunia.
👍 Temukan wawasan nyata dari kreator terverifikasi.
Email/Nomor Ponsel
Topik Sedang Tren
SECProposesCryptoCustodyRules
901 penayangan
60 Berdiskusi
#secproposescryptocustodyrules
SEC akhirnya mengendur! 🧘♂️ Di bawah Ketua Paul Atkins, mereka baru saja merilis proposal baru di bawah "Project Crypto" yang memungkinkan manajer aset dan penasihat investasi untuk melakukan self-custody atau menggunakan trust yang berizin negara, alih-alih memaksa semua orang masuk ke bank tradisional.
Apakah ini melindungi trader?
Tentu saja! Ini menjaga modal institusional tetap aman tanpa belenggu perbankan tradisional, sehingga likuiditas pasar jauh lebih besar. Bagi trader harian, ini menghadirkan keamanan tanpa mematikan inovasi. Gary Gensler mungkin sedang menangis di suatu tempat. 😢
Apa yang sebaiknya dilakukan trader?
Tenang dan tetap pada posisi. Lampu hijau institusional ini secara struktural bullish untuk infrastruktur kripto. Kumpulkan aset favoritmu dengan aman!
Bukan nasihat keuangan! Gunakan kode VINHTOCDO atau tautkan untuk mendaftar: https://www.binance.com/register?ref=VINHTOCDO
Klik trading di bawah ini untuk mendukung saya! 👇
$BTC
$ETH
$BNB
#CryptoRegulation #SECProjectCrypto #CryptoCustody #DeFi #VINHTOCDO #SEC
Vinhtocdo
·Disukai 3 Kali
·218 penayangan
SECApproves3xLongCryptoCommodityETPs
1,805 penayangan
101 Berdiskusi
G7PlansToReleaseUpTo100MBarrelsOilDiesel
3,441 penayangan
149 Berdiskusi