

CryptoTraders.com
345 Posting

CryptoTraders.com
Laporkan
Blokir Pengguna
Home of Top Analysts, Elite Trade Alerts, Cutting-Edge Algorithms, and Powerful Scanners — all built to give you the edge in any market. Join & Activate your 14-day free trial now to see the results yourself!
0 Mengikuti
4 Pengikut
3 Disukai
Posting
Lihat terjemahan
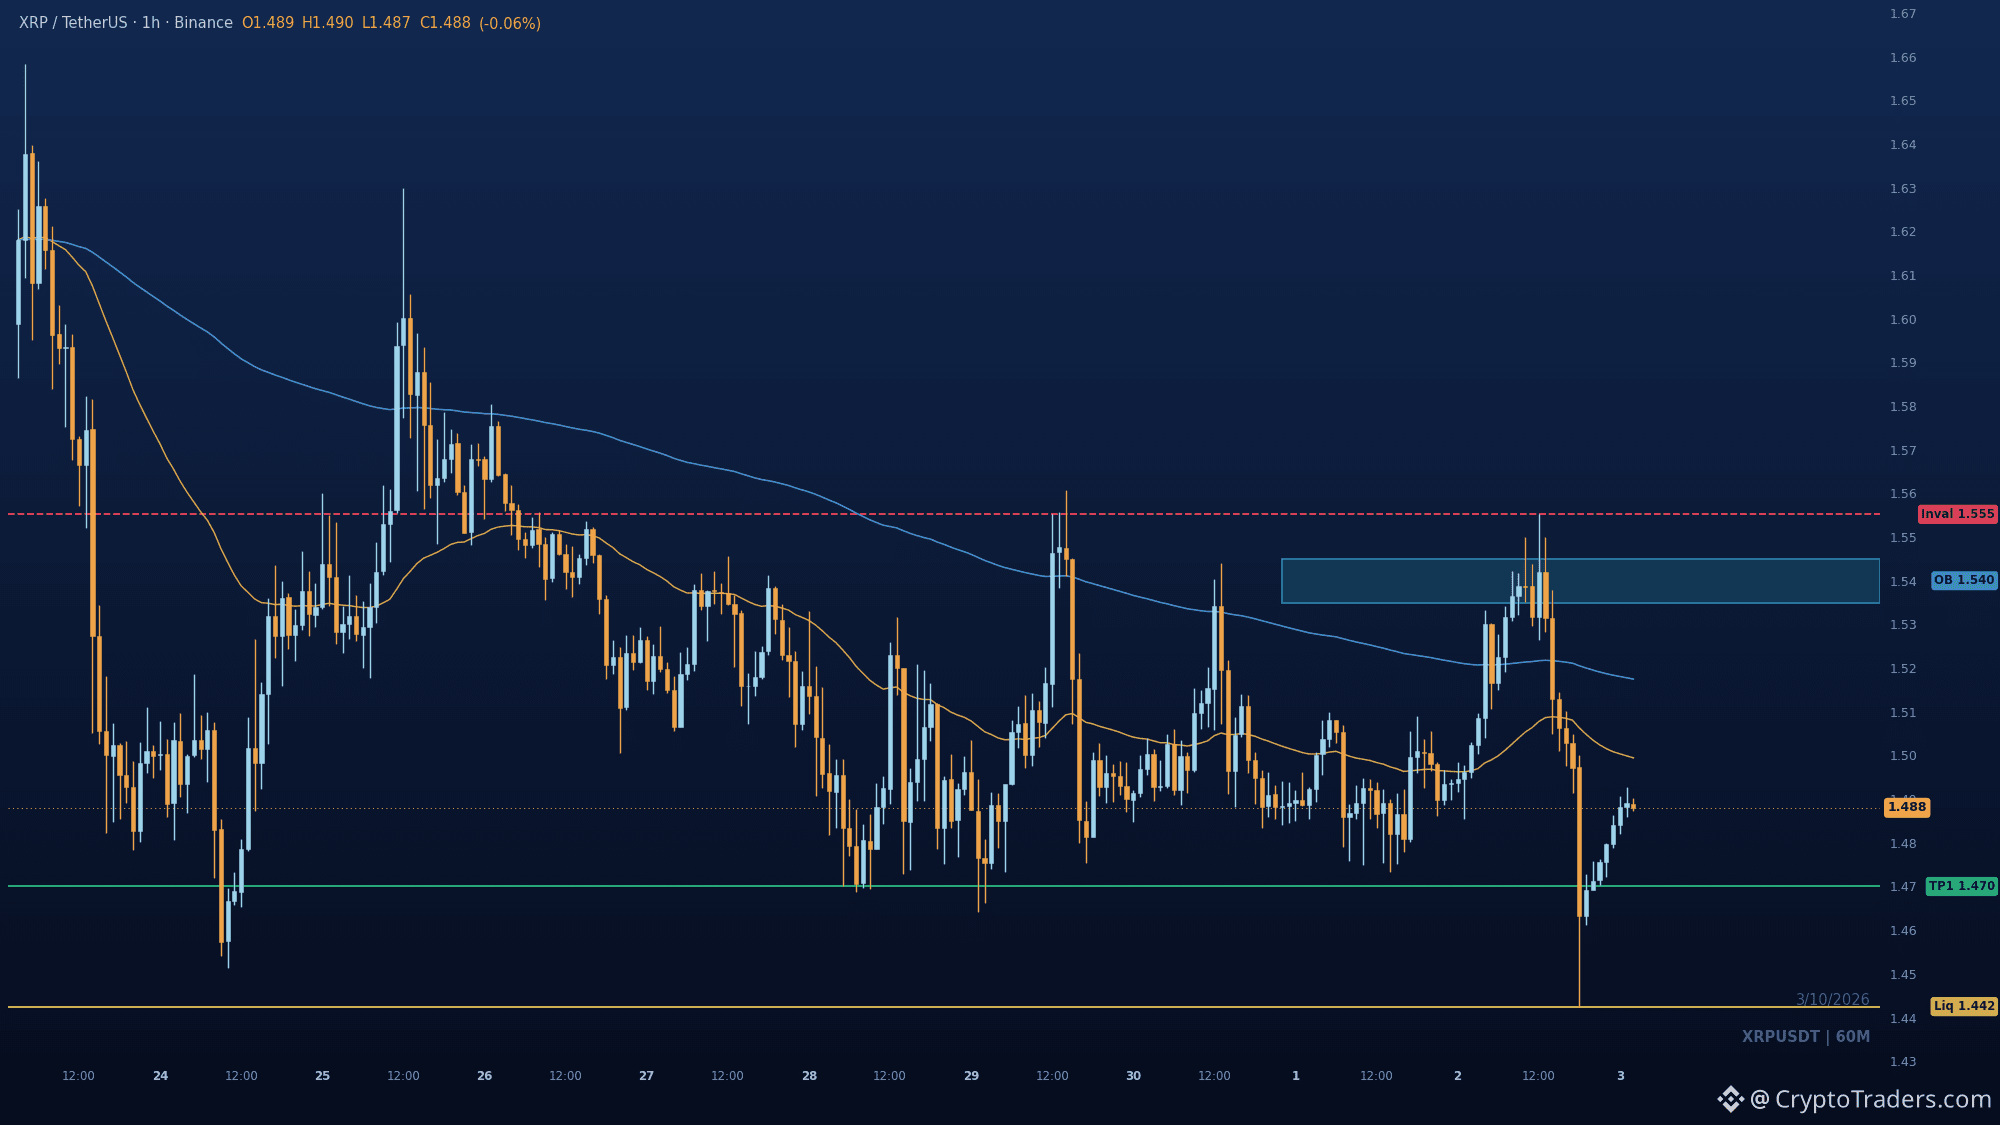
Can $XRP reclaim 1.5552, or does the bounce off 1.4425 just set up a lower high? Price sits under both the 50 and 200 EMAs on the 1h, so the trend still leans down even after that sell-side sweep at 1.4425. The rebound can stretch into 1.499 to 1.517, with supply stacked at 1.535 to 1.545 from before the sharp selloff. Rejection there keeps 1.470 and a retest of 1.4425 in play, while a close above 1.5552 would flip the read. Are you treating this bounce as a retrace or the start of a reversal? A fresh breakdown like this lands in the community every morning. #Altcoin Season#
Can $XRP reclaim 1.5552, or does the bounce off 1.4425 just set up a lower high? Price sits under both the 50 and 200 EMAs on the 1h, so the trend still leans down even after that sell-side sweep at 1.4425. The rebound can stretch into 1.499 to 1.517, with supply stacked at 1.535 to 1.545 from before the sharp selloff. Rejection there keeps 1.470 and a retest of 1.4425 in play, while a close above 1.5552 would flip the read. Are you treating this bounce as a retrace or the start of a reversal? A fresh breakdown like this lands in the community every morning. #Altcoin Season#
60
Lihat terjemahan
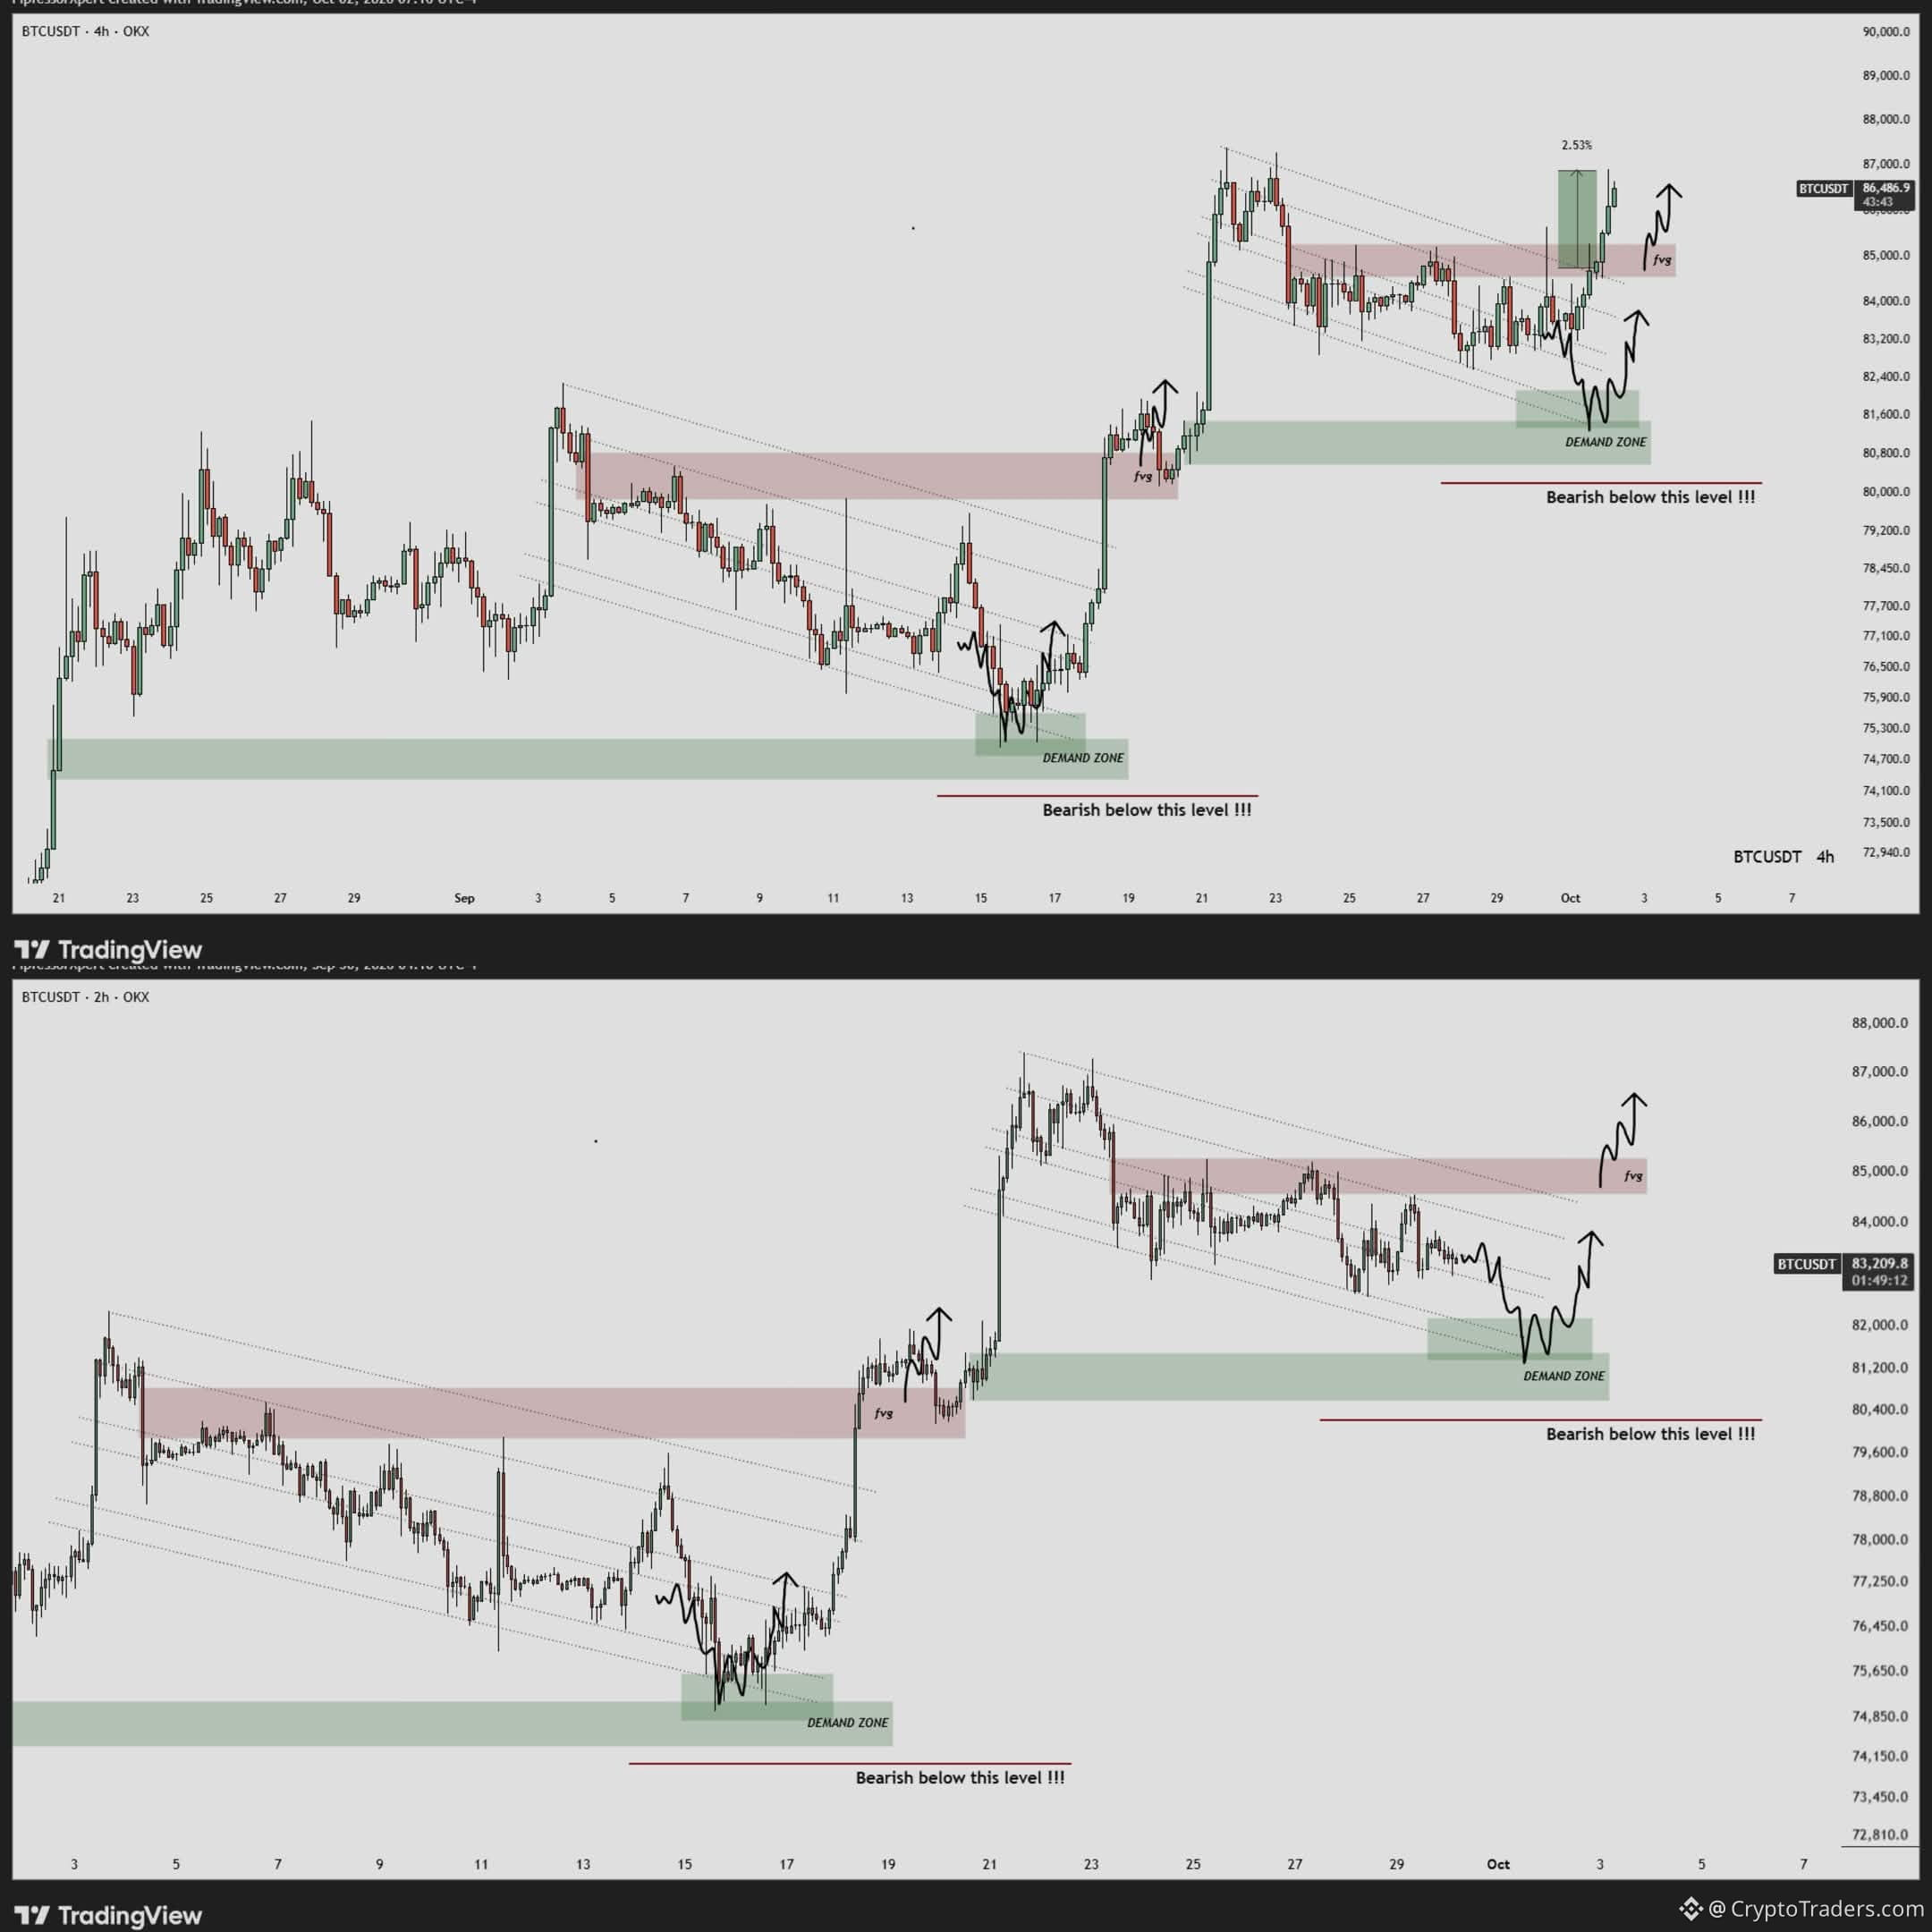
$BTC 84,521 (-0.4% 24h). Here's the level that matters. OUTLOOK** Price has flipped the FVG into support and is showing strong momentum. With the weekend approaching, some sideways chop or a liquidity trap around the FVG is possible. As long as price holds and sustains above the FVG, the bullish structure remains intact, with 88K–90K as the next major upside targets. What's your read on BTC here? This is one of several charts the group gets each day - see my bio #BTC Price Analysis# #Bitcoin Price Prediction: What is Bitcoins next move?#
$BTC 84,521 (-0.4% 24h). Here's the level that matters. OUTLOOK** Price has flipped the FVG into support and is showing strong momentum. With the weekend approaching, some sideways chop or a liquidity trap around the FVG is possible. As long as price holds and sustains above the FVG, the bullish structure remains intact, with 88K–90K as the next major upside targets. What's your read on BTC here? This is one of several charts the group gets each day - see my bio #BTC Price Analysis# #Bitcoin Price Prediction: What is Bitcoins next move?#
89
Lihat terjemahan
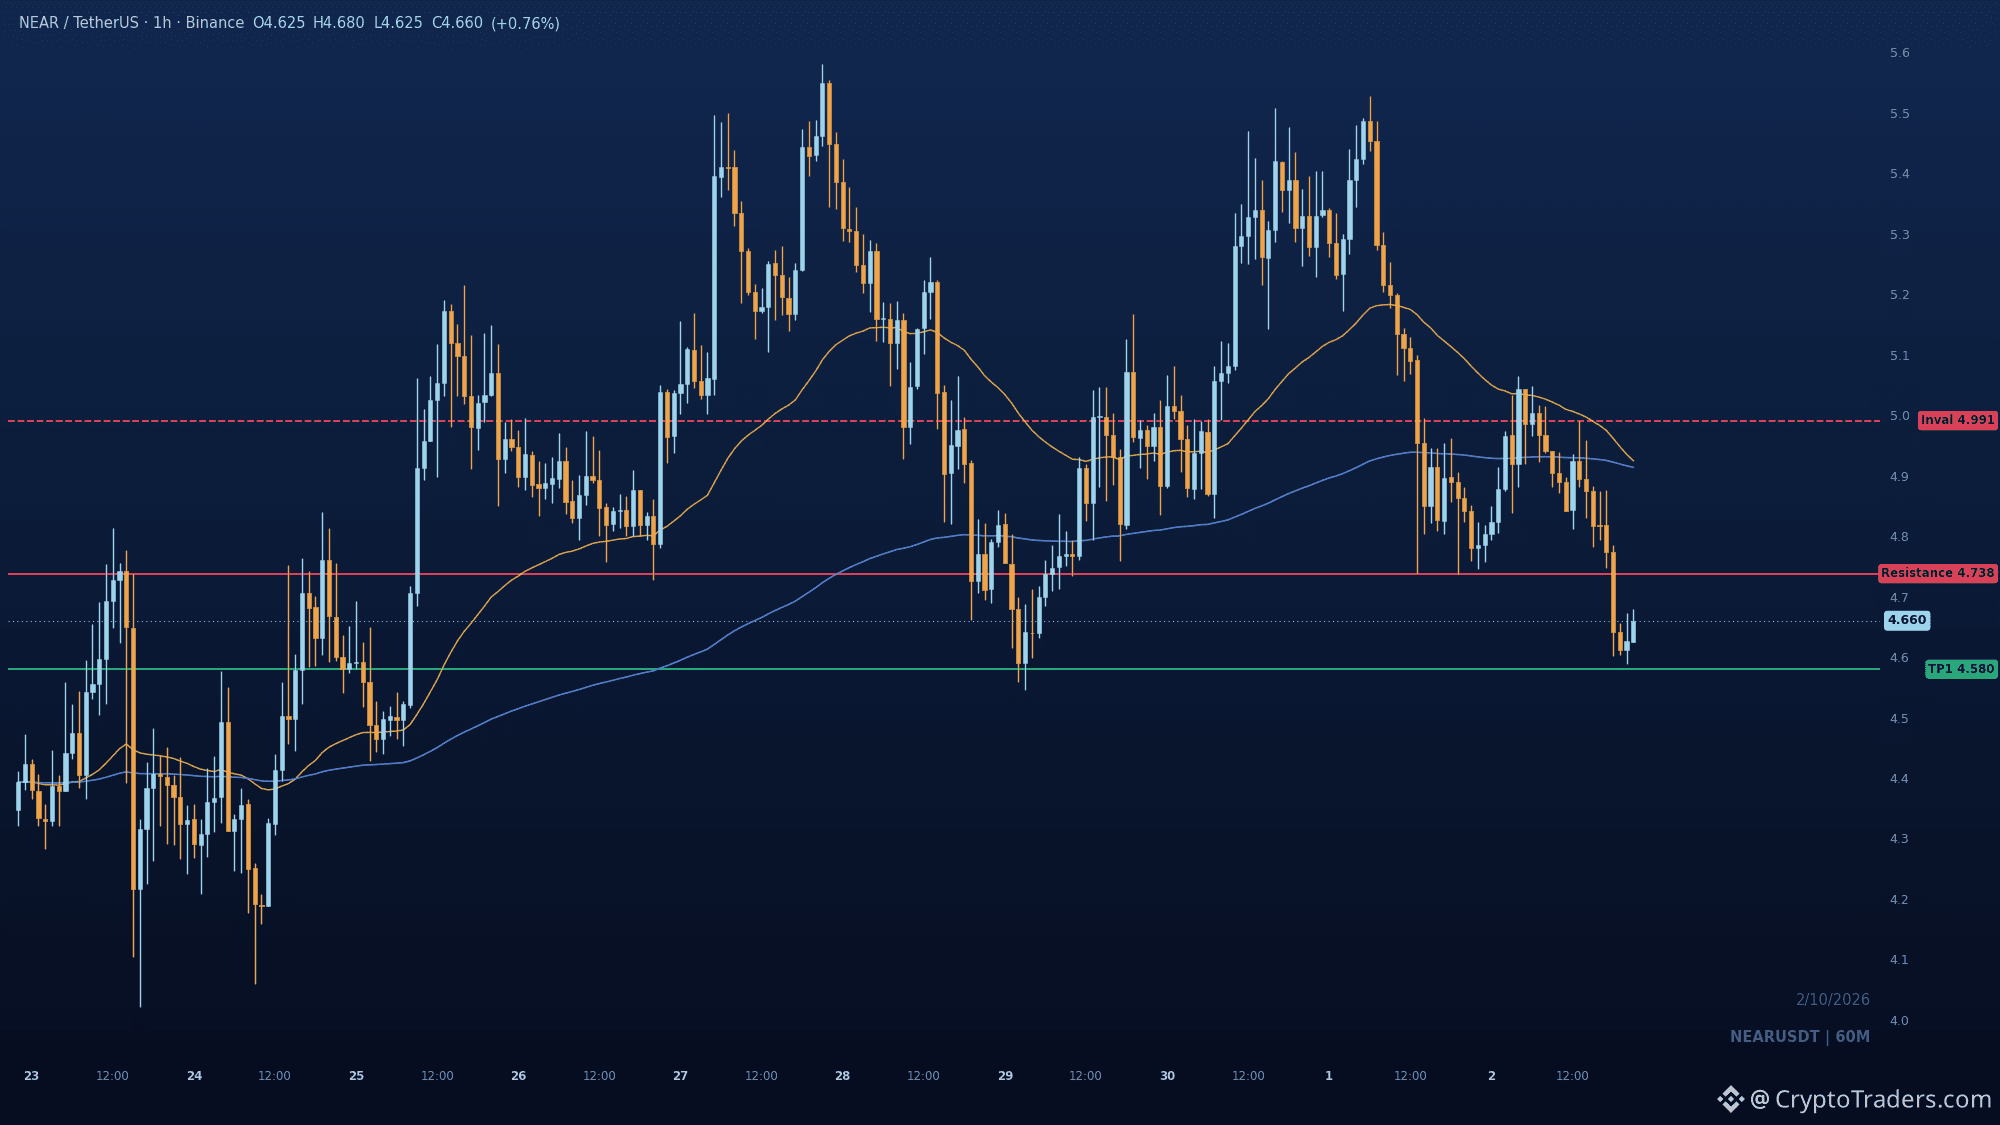
A 3.8 million dollar bridge exploit just paused transfers on three chains for $NEAR , and the token is down 2.9 percent at 4.66. 1⃣ Exploit hits Intents rails: An Omni deposit and withdrawal bridge connection drained more than 3.8 million from NEAR Intents. The flaw was patched and compensation promised, but BNB Chain, Polygon and TON transfers were paused. Prolonged downtime could also cut the fees that feed NEAR buybacks. 2⃣ Flows stay mixed elsewhere: U.S. spot Bitcoin ETFs logged 148.7 million of outflows on September 30, then 102.7 million of inflows on October 1, concentrated in BlackRock's IBIT while Fidelity's FBTC kept bleeding. The two days net to 46 million of outflows, so no clean risk-on bid. 3⃣ Payments rails shift: Stripe made Bridge-issued OUSD its default stablecoin, steering new payment flows toward the roughly 668.5 million circulating asset and sharing reserve income with distributors. That pressures USDC's economics, while Bitget's 388 million breach coverage and a protection fund rebuilt above 300 million show how thin confidence signals can be. The exploit response matters more than the price dip; watch whether those three paused chains reopen on schedule. Do you treat a patched bridge and promised compensation as enough to keep using Intents rails? This is one of several reads the group gets each day, so check the bio for the rest. #Altcoin Season# #Macro Insights#
A 3.8 million dollar bridge exploit just paused transfers on three chains for $NEAR , and the token is down 2.9 percent at 4.66. 1⃣ Exploit hits Intents rails: An Omni deposit and withdrawal bridge connection drained more than 3.8 million from NEAR Intents. The flaw was patched and compensation promised, but BNB Chain, Polygon and TON transfers were paused. Prolonged downtime could also cut the fees that feed NEAR buybacks. 2⃣ Flows stay mixed elsewhere: U.S. spot Bitcoin ETFs logged 148.7 million of outflows on September 30, then 102.7 million of inflows on October 1, concentrated in BlackRock's IBIT while Fidelity's FBTC kept bleeding. The two days net to 46 million of outflows, so no clean risk-on bid. 3⃣ Payments rails shift: Stripe made Bridge-issued OUSD its default stablecoin, steering new payment flows toward the roughly 668.5 million circulating asset and sharing reserve income with distributors. That pressures USDC's economics, while Bitget's 388 million breach coverage and a protection fund rebuilt above 300 million show how thin confidence signals can be. The exploit response matters more than the price dip; watch whether those three paused chains reopen on schedule. Do you treat a patched bridge and promised compensation as enough to keep using Intents rails? This is one of several reads the group gets each day, so check the bio for the rest. #Altcoin Season# #Macro Insights#
Lihat terjemahan
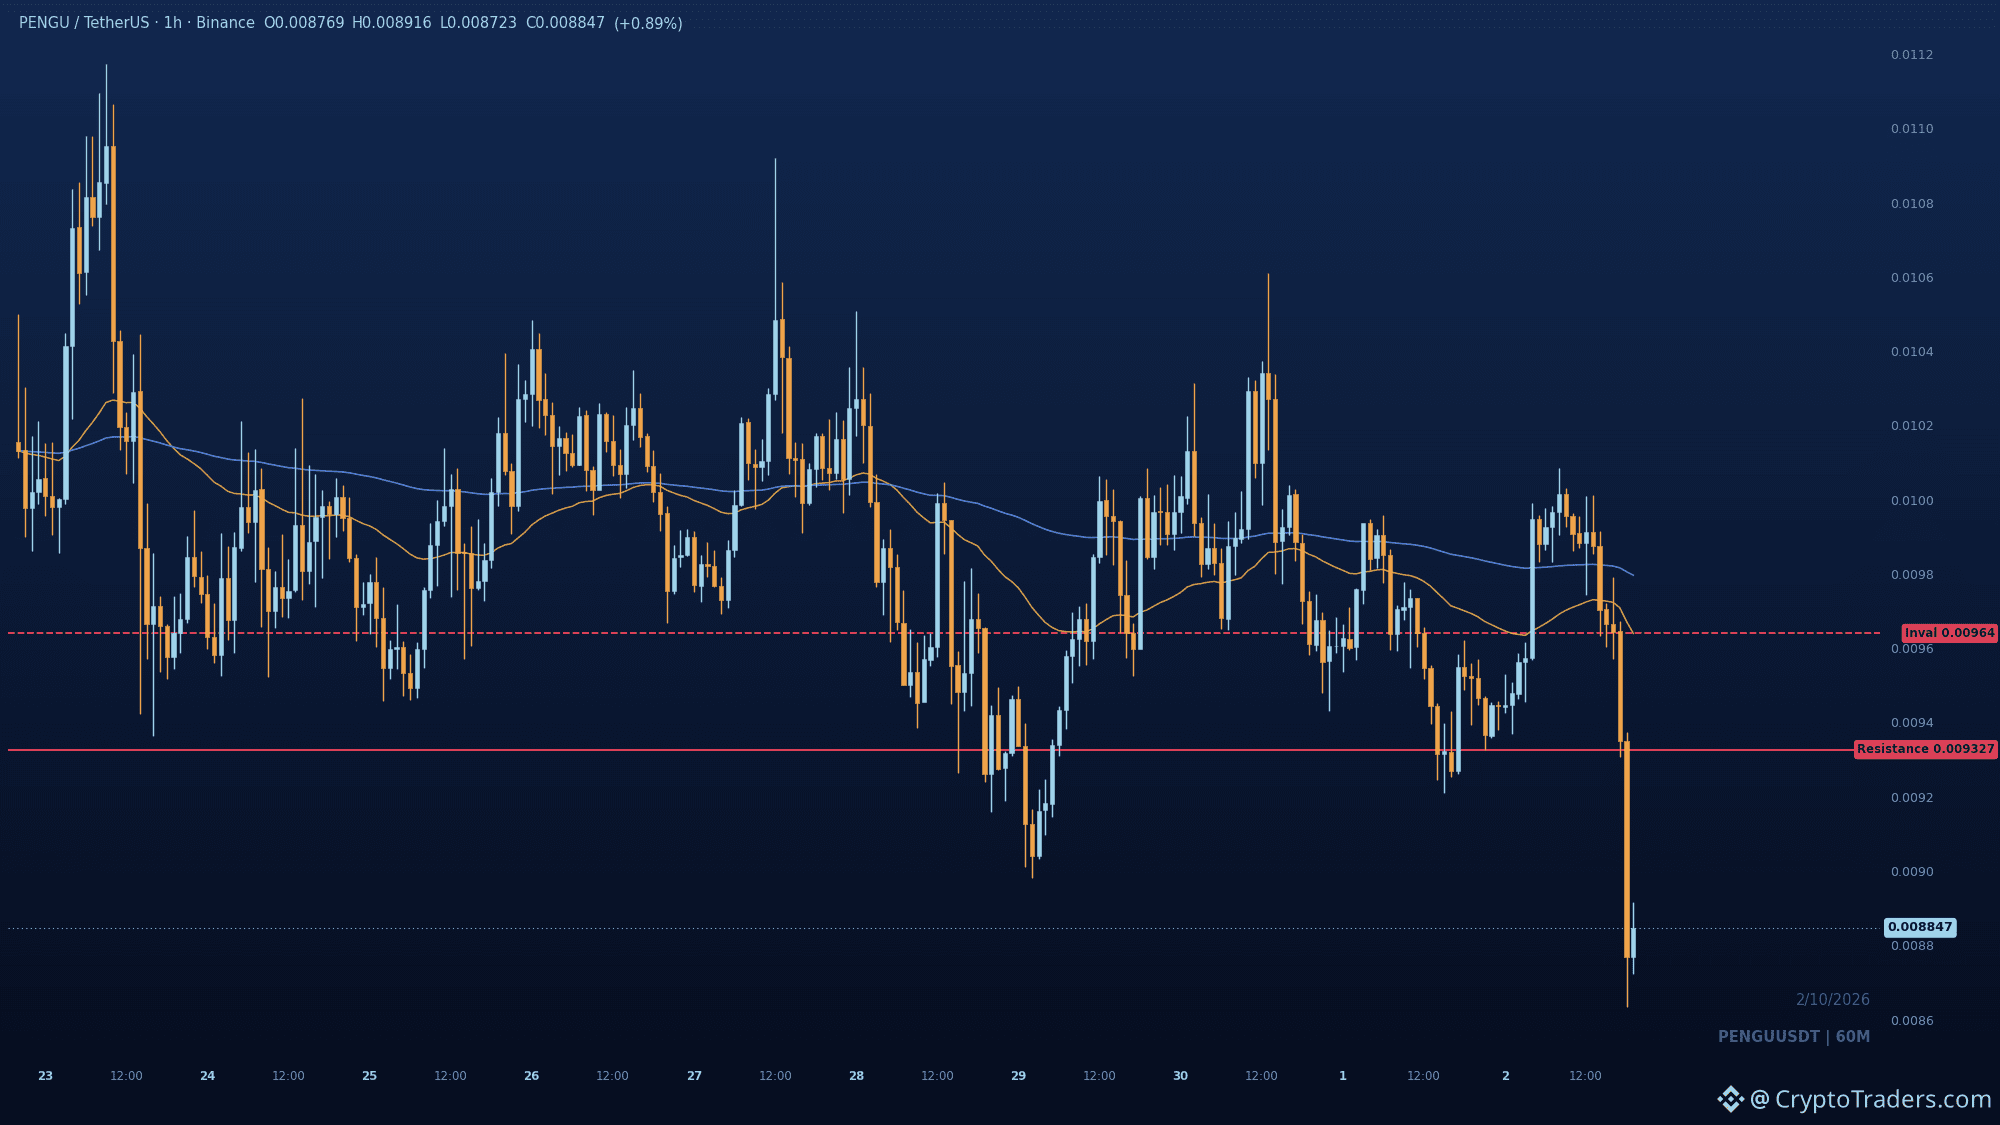
The 7 percent drop in $PENGU is being read as capitulation, but the 0.009327 break says the downtrend just got confirmed. Sellers drove price through the prior swing low with real displacement, and the old support now sits overhead as resistance. A relief bounce into 0.009327 is the spot to watch. Rejection there keeps downside expansion toward 0.008635 in play. Invalidation sits at 0.009640. Reclaim that and the bearish read is done. Where do you want to see PENGU hold on the next bounce? More reads like this land in the group daily, bio has the way in. #Altcoin Season#
The 7 percent drop in $PENGU is being read as capitulation, but the 0.009327 break says the downtrend just got confirmed. Sellers drove price through the prior swing low with real displacement, and the old support now sits overhead as resistance. A relief bounce into 0.009327 is the spot to watch. Rejection there keeps downside expansion toward 0.008635 in play. Invalidation sits at 0.009640. Reclaim that and the bearish read is done. Where do you want to see PENGU hold on the next bounce? More reads like this land in the group daily, bio has the way in. #Altcoin Season#
28
Lihat terjemahan
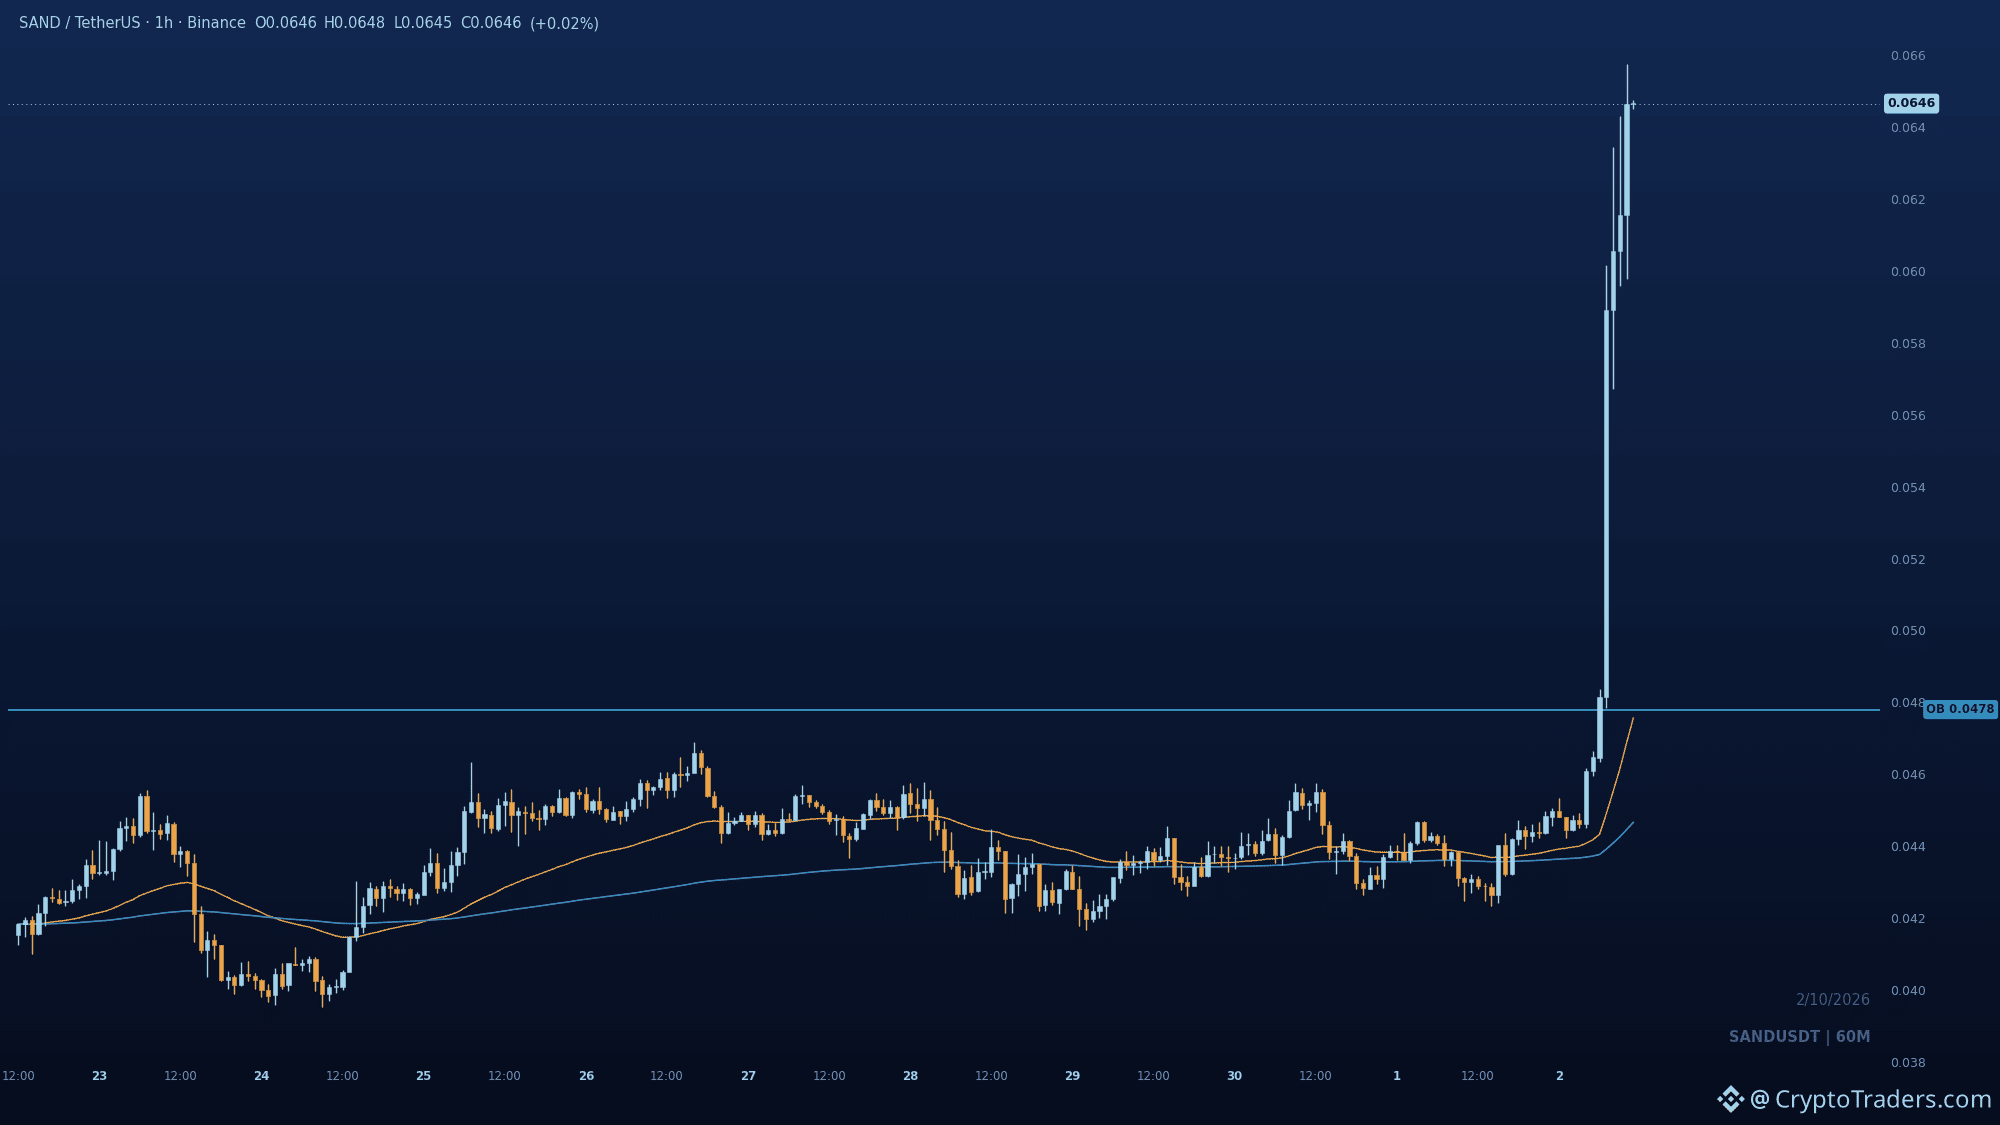
$SAND is up 52.6 percent and sitting at the range high, but the real decision is whether the 0.0478 to 0.0482 base holds as the pullback zone. Price displaced hard through prior structure and is now in open upside discovery, so there is no obvious pool above to draw it higher. The breakout base at 0.0478 to 0.0482 is the tight impulse zone buyers would need to defend on any retrace. If that zone fails, the chart prints a lower high against the range extreme and the whole displacement gets retraced back into the old base. Holding it keeps continuation in play toward fresh discovery. What level are you watching to tell a healthy pullback from a failed breakout? More charts like this land daily in the group, bio has the details. #Altcoin Season#
$SAND is up 52.6 percent and sitting at the range high, but the real decision is whether the 0.0478 to 0.0482 base holds as the pullback zone. Price displaced hard through prior structure and is now in open upside discovery, so there is no obvious pool above to draw it higher. The breakout base at 0.0478 to 0.0482 is the tight impulse zone buyers would need to defend on any retrace. If that zone fails, the chart prints a lower high against the range extreme and the whole displacement gets retraced back into the old base. Holding it keeps continuation in play toward fresh discovery. What level are you watching to tell a healthy pullback from a failed breakout? More charts like this land daily in the group, bio has the details. #Altcoin Season#
34
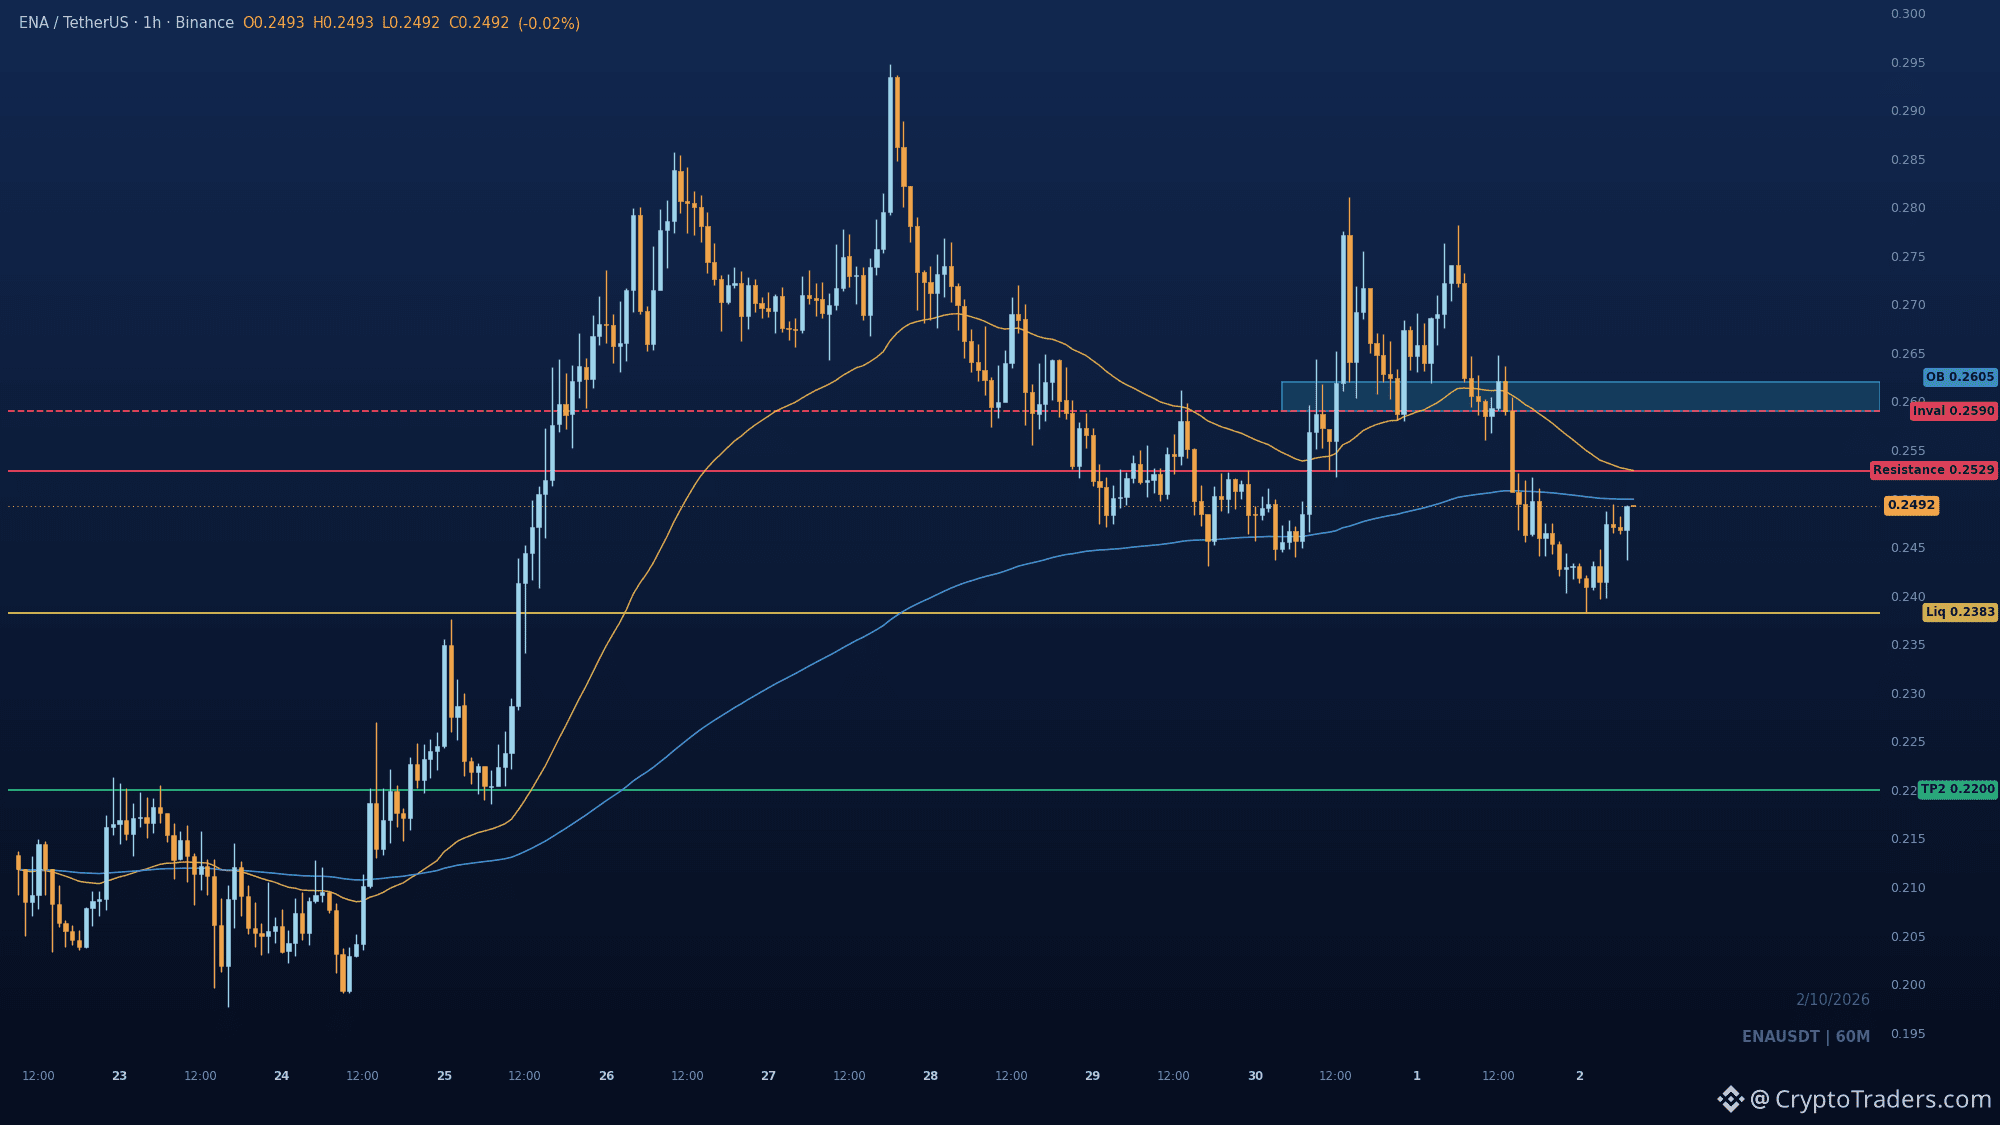
Pantulan pada $ENA sedang dibaca sebagai pola bottom, tetapi chart masih menunjukkan lower highs dan harga berada di bawah fast EMA. Harga sedang memantul dari low terbaru menuju fast EMA 0.25289, yaitu hal pertama yang akan dipertahankan oleh para seller. Di atasnya terdapat order block 0.259 hingga 0.262, supply yang tertinggal sebelum terjadinya penurunan tajam. Merebut kembali 0.259 adalah yang benar-benar akan melemahkan pembacaan bearish. Jika 0.25289 ditolak, magnet terdekat adalah kumpulan sell-side dari swing-low 0.23827, dengan 0.22 sebagai rak berikutnya di bawahnya. Apa yang perlu kamu lihat di timeframe 1h sebelum kamu membalik bias? Bacaan seperti ini lebih sering muncul setiap hari di grup—bio punya jalurnya masuk. #Altcoin Season#
Pantulan pada $ENA sedang dibaca sebagai pola bottom, tetapi chart masih menunjukkan lower highs dan harga berada di bawah fast EMA. Harga sedang memantul dari low terbaru menuju fast EMA 0.25289, yaitu hal pertama yang akan dipertahankan oleh para seller. Di atasnya terdapat order block 0.259 hingga 0.262, supply yang tertinggal sebelum terjadinya penurunan tajam. Merebut kembali 0.259 adalah yang benar-benar akan melemahkan pembacaan bearish. Jika 0.25289 ditolak, magnet terdekat adalah kumpulan sell-side dari swing-low 0.23827, dengan 0.22 sebagai rak berikutnya di bawahnya. Apa yang perlu kamu lihat di timeframe 1h sebelum kamu membalik bias? Bacaan seperti ini lebih sering muncul setiap hari di grup—bio punya jalurnya masuk. #Altcoin Season#
51
Lihat terjemahan
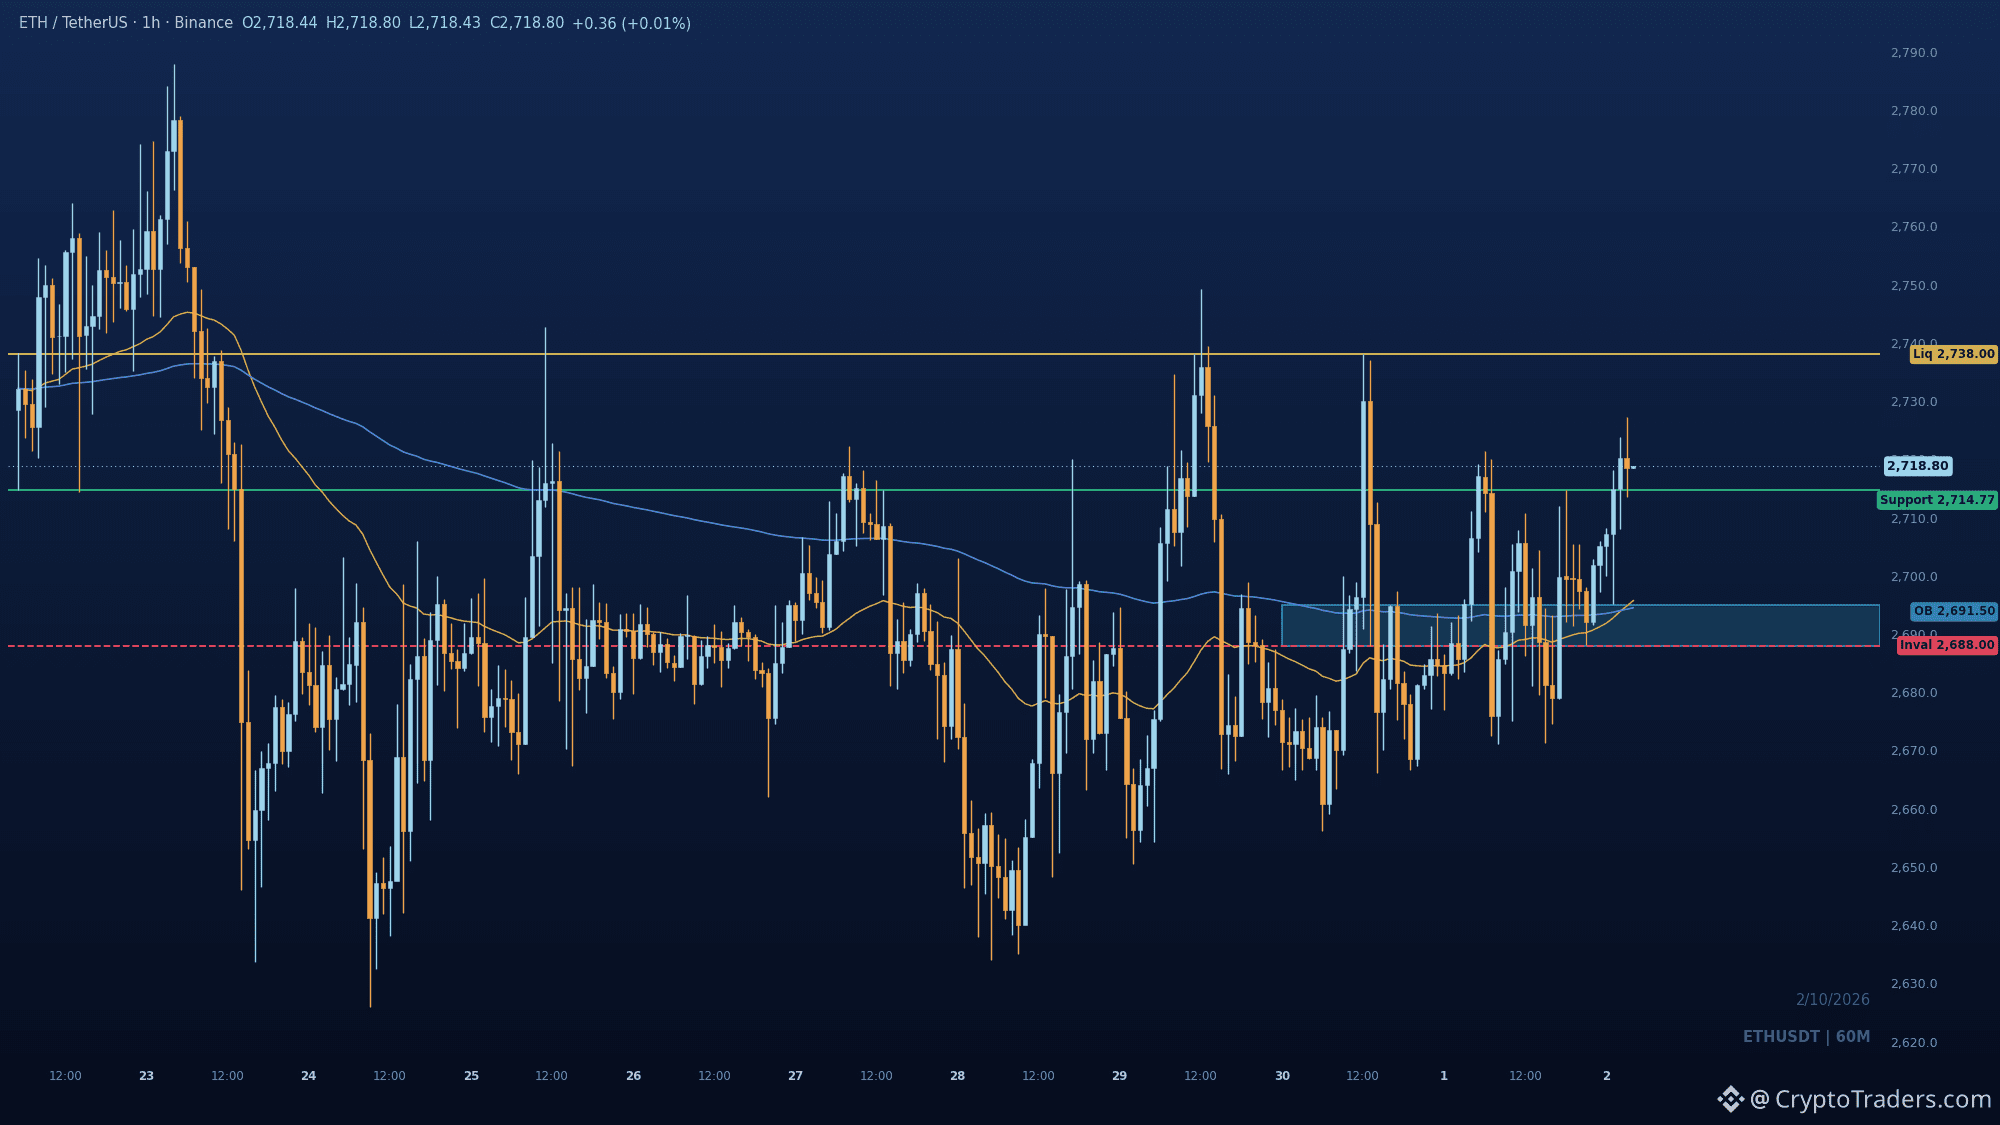
Ether holds the 2714.77 breakout as ETF flows turn positive on the week $ETH is trading near 2,720, up 0.9% on the day, and parked just above the hourly breakout that has become the level to defend. Citi lifted its 12-month ether target to 3,028 from 2,240 and bitcoin to 113,000, assuming 5 billion in crypto investment product inflows over the same window. That is forecast work rather than a catalyst, and it landed against a mixed flow tape: lookonchain showed Ethereum ETFs at minus 5,171 ETH (13.89 million) on the day, while the seven-day figure sits at plus 41,041 ETH (110.24 million). The SEC also proposed custody clarifications for advisers and funds, allowing self-custody in certain cases and state-chartered trusts, with a 60-day comment period and nothing binding yet. In the background, lookonchain flagged a wallet tied to Joseph Lubin moving 133,298 ETH (356.2 million) to a new address, and MetaMask disclosed an infrastructure incident that has it pulling affected validators from Lido. Noise rather than direction, but worth knowing. The chart: after ranging, buyers reclaimed the clustered EMAs and pushed through the 2714.77 swing high, flipping it to support and leaving price just above the dealing range midpoint. The prior swing high at 2738 is the nearest buy-side pool, with a tight demand block at 2688 to 2695 sitting under the rally. A retest of 2714.77 that holds keeps 2738 in play, while a sustained break below 2688 weakens the shift and hands the range back to sellers, so that level decides rather than the breakout candle itself. Invalidation is 2688. If the retest gets bought, do you want 2738 taken in the same session, or is a slower grind healthier for this structure? Setups like this land in the group every day, and the bio has the way in. #Altcoin Season# #Macro Insights#
Ether holds the 2714.77 breakout as ETF flows turn positive on the week $ETH is trading near 2,720, up 0.9% on the day, and parked just above the hourly breakout that has become the level to defend. Citi lifted its 12-month ether target to 3,028 from 2,240 and bitcoin to 113,000, assuming 5 billion in crypto investment product inflows over the same window. That is forecast work rather than a catalyst, and it landed against a mixed flow tape: lookonchain showed Ethereum ETFs at minus 5,171 ETH (13.89 million) on the day, while the seven-day figure sits at plus 41,041 ETH (110.24 million). The SEC also proposed custody clarifications for advisers and funds, allowing self-custody in certain cases and state-chartered trusts, with a 60-day comment period and nothing binding yet. In the background, lookonchain flagged a wallet tied to Joseph Lubin moving 133,298 ETH (356.2 million) to a new address, and MetaMask disclosed an infrastructure incident that has it pulling affected validators from Lido. Noise rather than direction, but worth knowing. The chart: after ranging, buyers reclaimed the clustered EMAs and pushed through the 2714.77 swing high, flipping it to support and leaving price just above the dealing range midpoint. The prior swing high at 2738 is the nearest buy-side pool, with a tight demand block at 2688 to 2695 sitting under the rally. A retest of 2714.77 that holds keeps 2738 in play, while a sustained break below 2688 weakens the shift and hands the range back to sellers, so that level decides rather than the breakout candle itself. Invalidation is 2688. If the retest gets bought, do you want 2738 taken in the same session, or is a slower grind healthier for this structure? Setups like this land in the group every day, and the bio has the way in. #Altcoin Season# #Macro Insights#
66
Lihat terjemahan
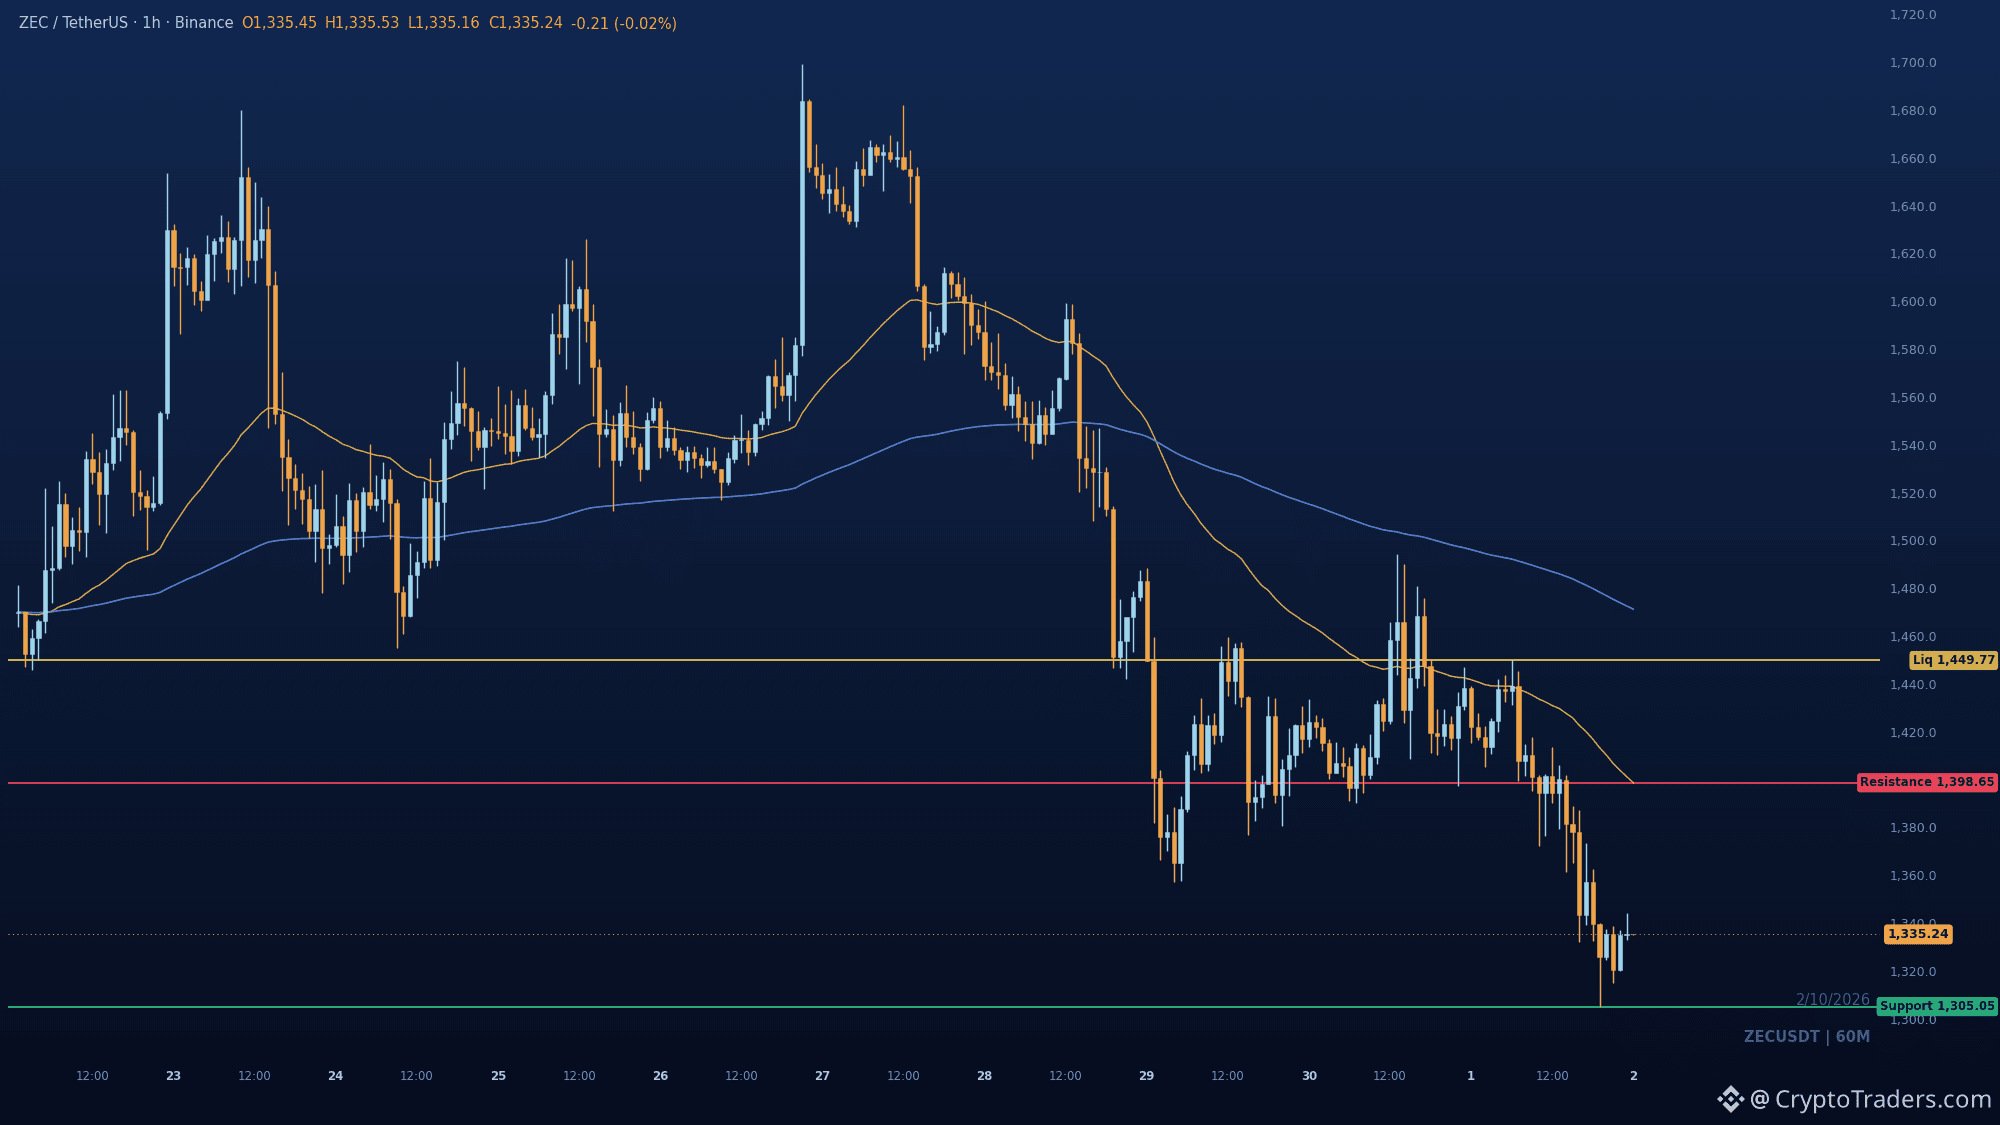
Everyone's treating the 1305.05 test on $ZEC as a bounce setup, but the chart says that shelf is the last thing holding the breakdown together. Price is below both EMAs after a bearish BOS, with lower highs stacked behind it. The 1398.65 fast EMA is where a relief bounce likely meets sellers, not where the trend turns. If 1305.05 gives way, anyone still long from higher has no nearby structure underneath to lean on. Reclaiming 1449.77 is the only thing that actually repairs this. Are you treating 1305.05 as a floor or a trapdoor? More reads like this land daily in the group, bio has the way in. #Altcoin Season#
Everyone's treating the 1305.05 test on $ZEC as a bounce setup, but the chart says that shelf is the last thing holding the breakdown together. Price is below both EMAs after a bearish BOS, with lower highs stacked behind it. The 1398.65 fast EMA is where a relief bounce likely meets sellers, not where the trend turns. If 1305.05 gives way, anyone still long from higher has no nearby structure underneath to lean on. Reclaiming 1449.77 is the only thing that actually repairs this. Are you treating 1305.05 as a floor or a trapdoor? More reads like this land daily in the group, bio has the way in. #Altcoin Season#
70
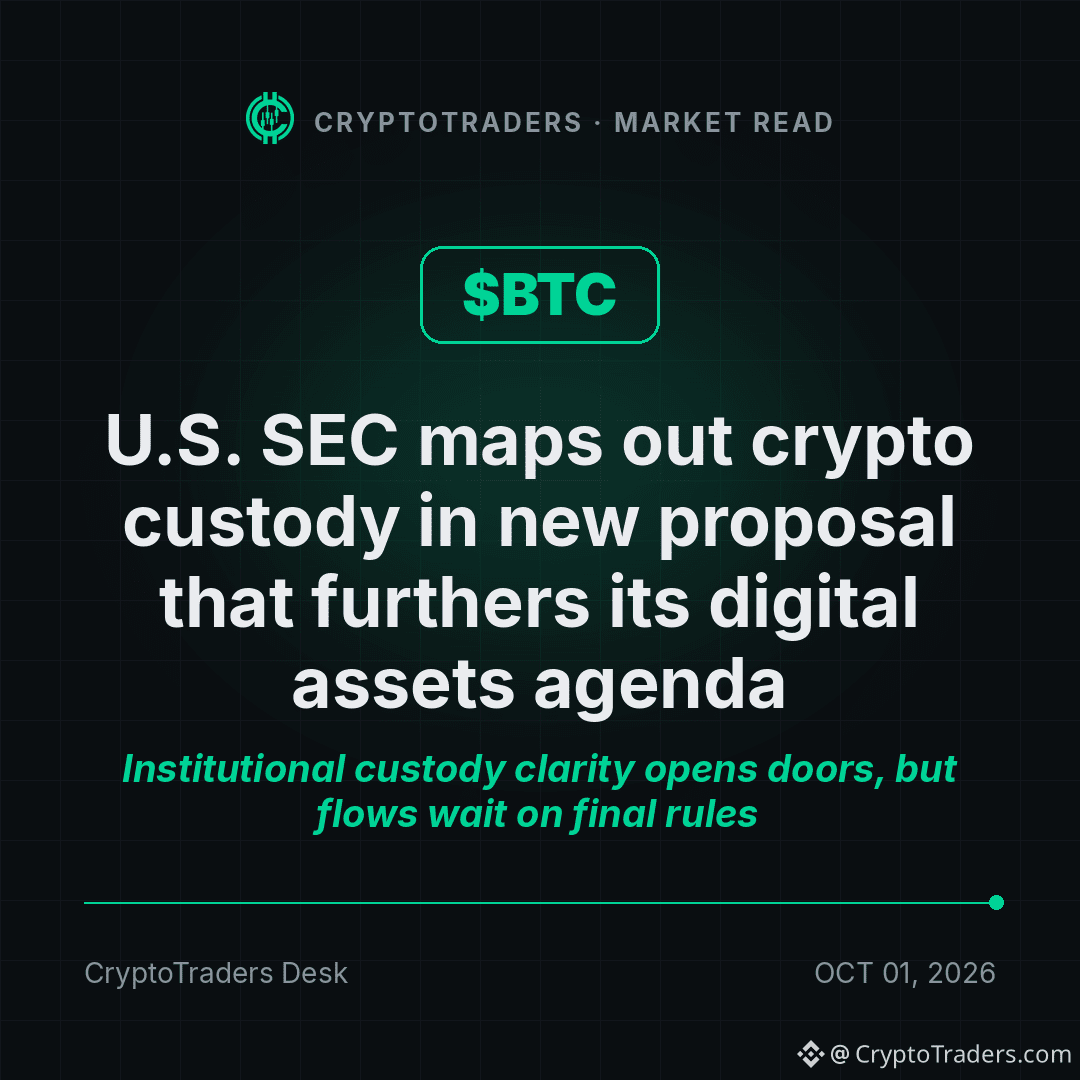
SEC membuka pintu untuk aturan penitipan kripto, dan $BTC duduk di dekat 84.582 saat semuanya bergulir 🏦 Sorotan: ▪ SEC mengusulkan klarifikasi untuk penasihat investasi dan dana yang teregulasi yang mencakup penitipan kripto, catatan, pengungkapan, serta audit. ▪ Proposal ini akan mengizinkan self-custody dalam kondisi tertentu dan memungkinkan penggunaan trust berbasis perwalian yang diakui oleh negara. ▪ Periode komentar 60 hari kini dibuka, jadi belum ada yang mengikat di sini. ▪ Ruang lingkup masih bisa berubah sebelum aturan final, sehingga efek permintaannya menjadi tidak langsung dan berjangka lebih panjang. Pandanganku 🟢 Jalur penitipan yang lebih jelas memberi institusi cerita kepatuhan yang lebih rapi—jenis infrastruktur yang mendukung alokasi dari waktu ke waktu. 🔴 Ini adalah proposal dengan periode komentar, bukan aturan, jadi menganggapnya sebagai katalis permintaan langsung terlalu prematur. 🟡 Harga naik 1,0% pada hari ini, tetapi sinyal sebenarnya adalah teks final dan bagaimana penggunaan trust yang diakui negara diterapkan. Apakah kejelasan penitipan benar-benar menggerakkan alokasi institusional, atau ini hanya urusan dokumen sampai aturan final terbit? Saya memposting seperti ini setiap hari di grup, dan bio saya menunjukkan jalannya. #BTC Price Analysis# #Bitcoin Price Prediction: What is Bitcoins next move?# #Macro Insights#
SEC membuka pintu untuk aturan penitipan kripto, dan $BTC duduk di dekat 84.582 saat semuanya bergulir 🏦 Sorotan: ▪ SEC mengusulkan klarifikasi untuk penasihat investasi dan dana yang teregulasi yang mencakup penitipan kripto, catatan, pengungkapan, serta audit. ▪ Proposal ini akan mengizinkan self-custody dalam kondisi tertentu dan memungkinkan penggunaan trust berbasis perwalian yang diakui oleh negara. ▪ Periode komentar 60 hari kini dibuka, jadi belum ada yang mengikat di sini. ▪ Ruang lingkup masih bisa berubah sebelum aturan final, sehingga efek permintaannya menjadi tidak langsung dan berjangka lebih panjang. Pandanganku 🟢 Jalur penitipan yang lebih jelas memberi institusi cerita kepatuhan yang lebih rapi—jenis infrastruktur yang mendukung alokasi dari waktu ke waktu. 🔴 Ini adalah proposal dengan periode komentar, bukan aturan, jadi menganggapnya sebagai katalis permintaan langsung terlalu prematur. 🟡 Harga naik 1,0% pada hari ini, tetapi sinyal sebenarnya adalah teks final dan bagaimana penggunaan trust yang diakui negara diterapkan. Apakah kejelasan penitipan benar-benar menggerakkan alokasi institusional, atau ini hanya urusan dokumen sampai aturan final terbit? Saya memposting seperti ini setiap hari di grup, dan bio saya menunjukkan jalannya. #BTC Price Analysis# #Bitcoin Price Prediction: What is Bitcoins next move?# #Macro Insights#
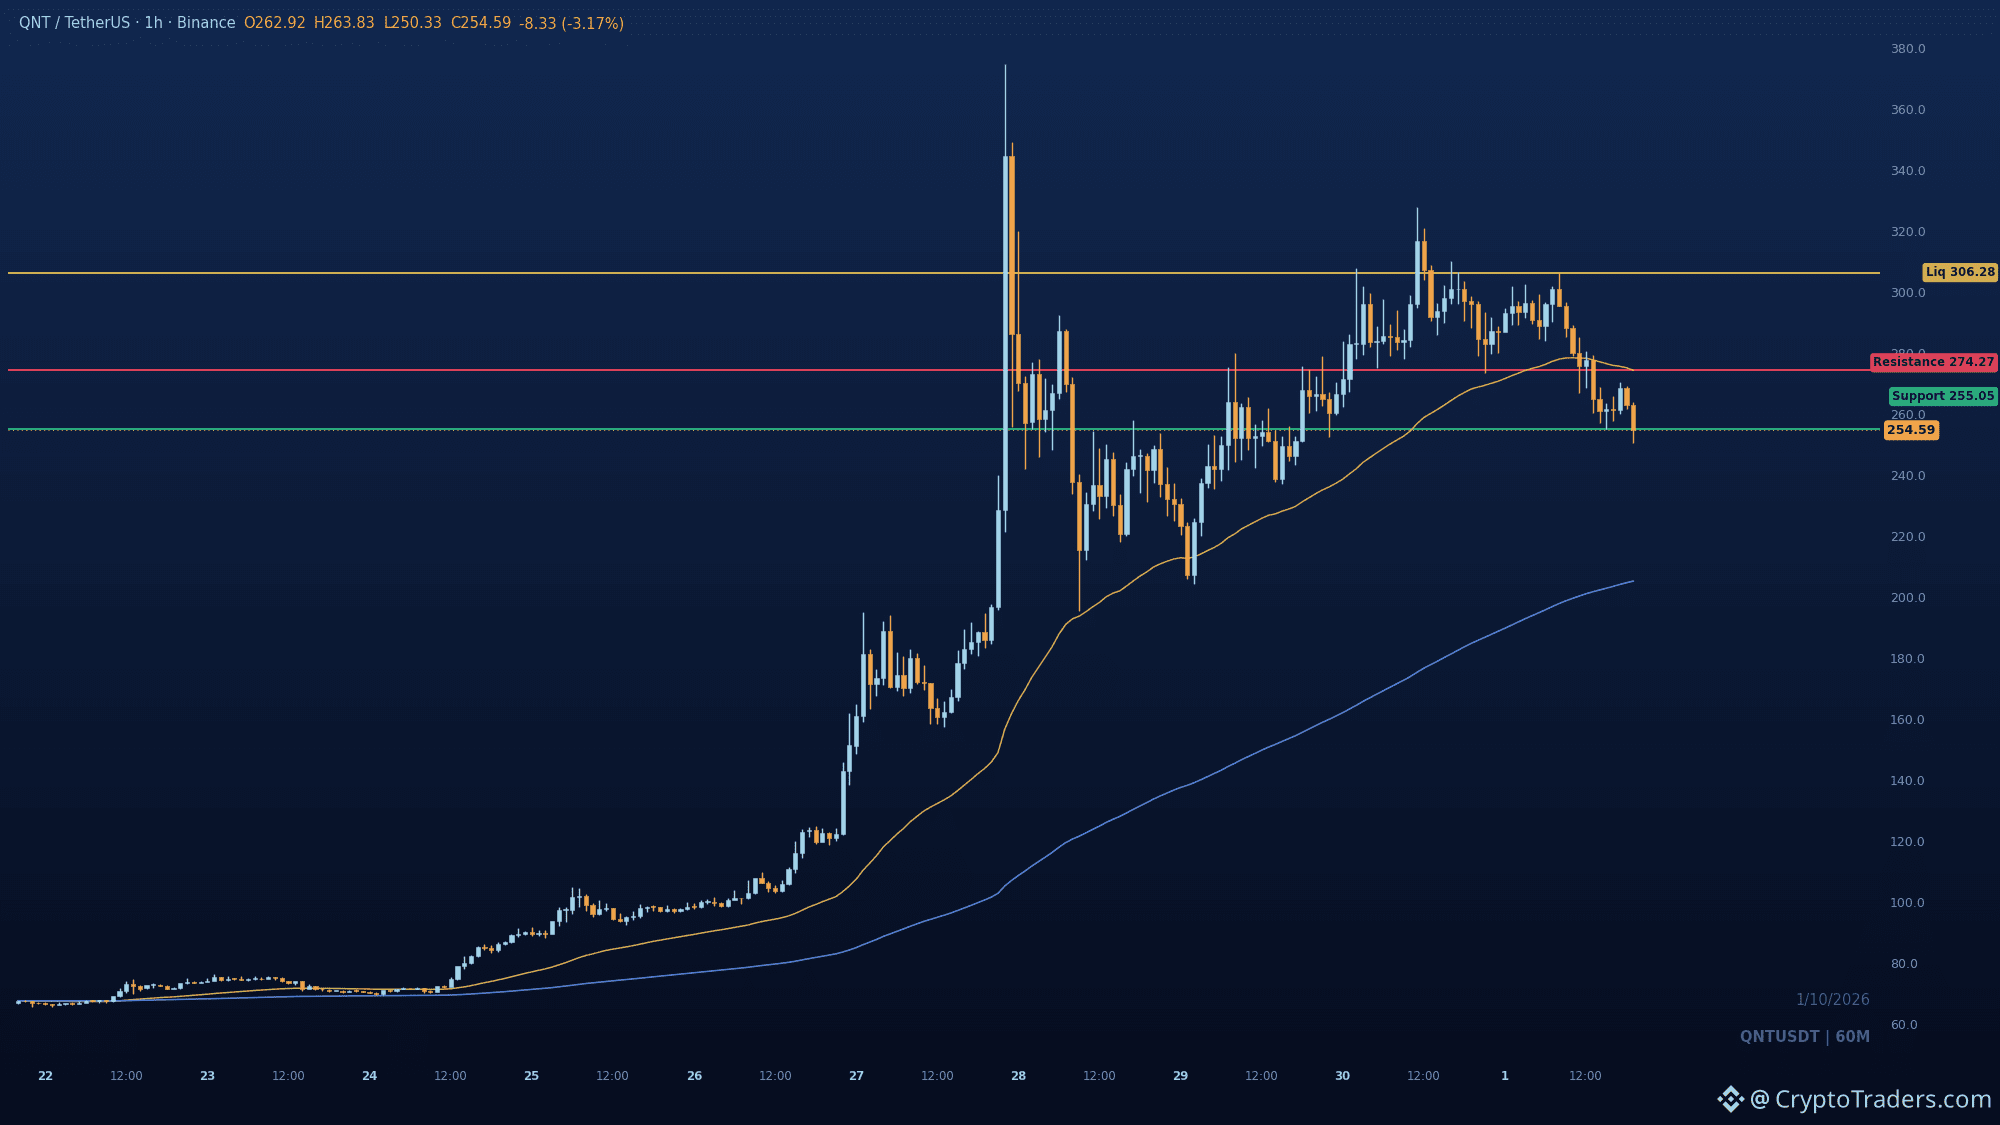
Bagian ganjil pada $QNT : pergerakan yang lebih luas masih bullish, tetapi harga sudah menguji swing low di 255.05 setelah menolak 306.28. Penahanan yang bersih di 255.05 akan menjadi bukti pertama bahwa pullback dapat stabil. Untuk yakin akan adanya rebound, saya perlu melihat harga merebut kembali 274.27, yaitu EMA 50. Patahan tegas di bawah 255.05 akan mengonfirmasi kelanjutan turun dalam jangka pendek; 306.28 tetap menjadi swing high sebelumnya. Apa yang akan meyakinkan Anda bahwa pullback ini telah menemukan dasar? Lebih banyak pembacaan chart seperti ini—terus naik di grup harian; bio saya mengarah ke sana. #Altcoin Season#
Bagian ganjil pada $QNT : pergerakan yang lebih luas masih bullish, tetapi harga sudah menguji swing low di 255.05 setelah menolak 306.28. Penahanan yang bersih di 255.05 akan menjadi bukti pertama bahwa pullback dapat stabil. Untuk yakin akan adanya rebound, saya perlu melihat harga merebut kembali 274.27, yaitu EMA 50. Patahan tegas di bawah 255.05 akan mengonfirmasi kelanjutan turun dalam jangka pendek; 306.28 tetap menjadi swing high sebelumnya. Apa yang akan meyakinkan Anda bahwa pullback ini telah menemukan dasar? Lebih banyak pembacaan chart seperti ini—terus naik di grup harian; bio saya mengarah ke sana. #Altcoin Season#
Lihat terjemahan
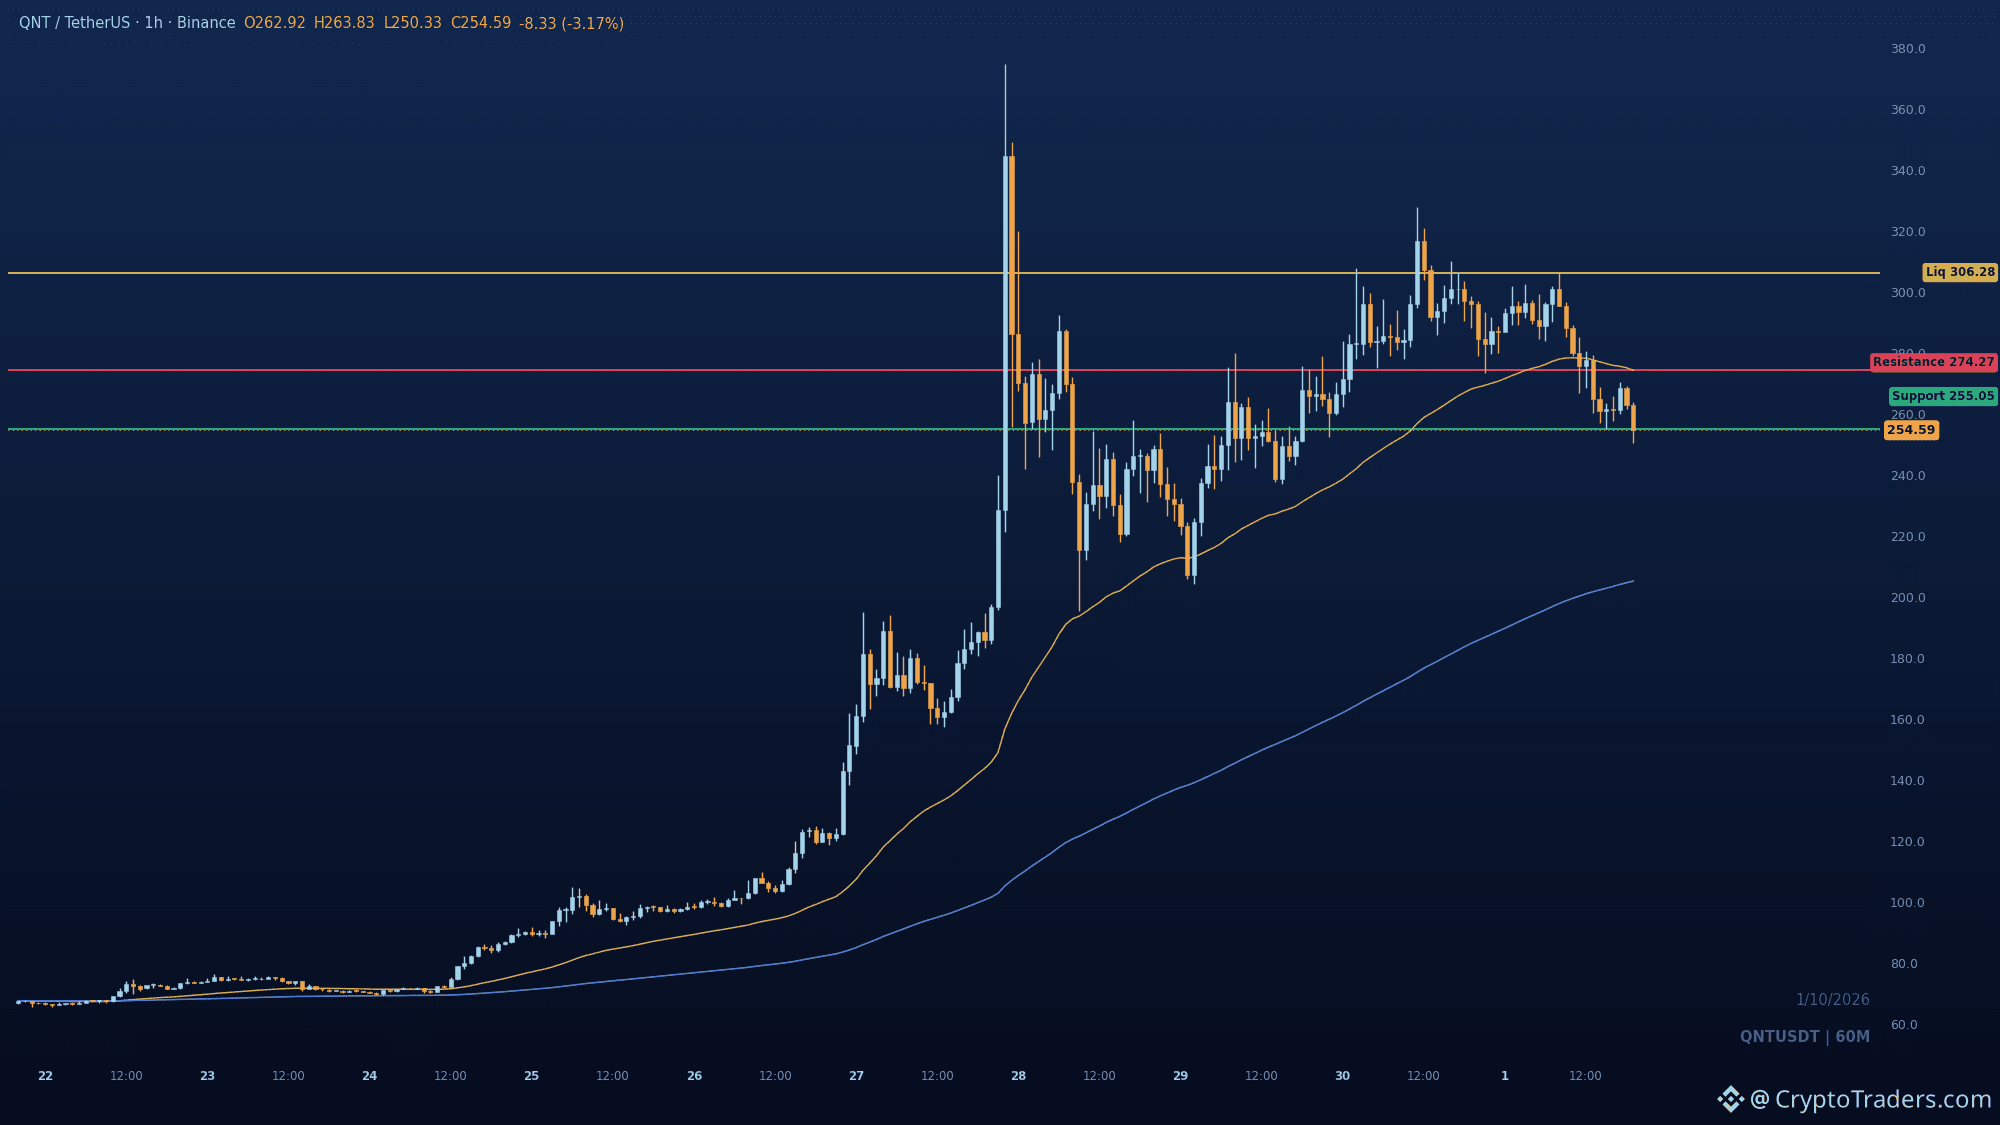
The odd part on $QNT : the broader move is still bullish, but price is already testing the 255.05 swing low after rejecting 306.28. A clean hold at 255.05 would be the first evidence the pullback can stabilize. To believe in a rebound, I’d need to see price reclaim 274.27, the 50 EMA. A decisive break below 255.05 would confirm near-term continuation lower; 306.28 remains the prior swing high. What would convince you this pullback has found a floor? More chart reads like this go up in the group daily; my bio points you there. #Altcoin Season#
The odd part on $QNT : the broader move is still bullish, but price is already testing the 255.05 swing low after rejecting 306.28. A clean hold at 255.05 would be the first evidence the pullback can stabilize. To believe in a rebound, I’d need to see price reclaim 274.27, the 50 EMA. A decisive break below 255.05 would confirm near-term continuation lower; 306.28 remains the prior swing high. What would convince you this pullback has found a floor? More chart reads like this go up in the group daily; my bio points you there. #Altcoin Season#
Lihat terjemahan
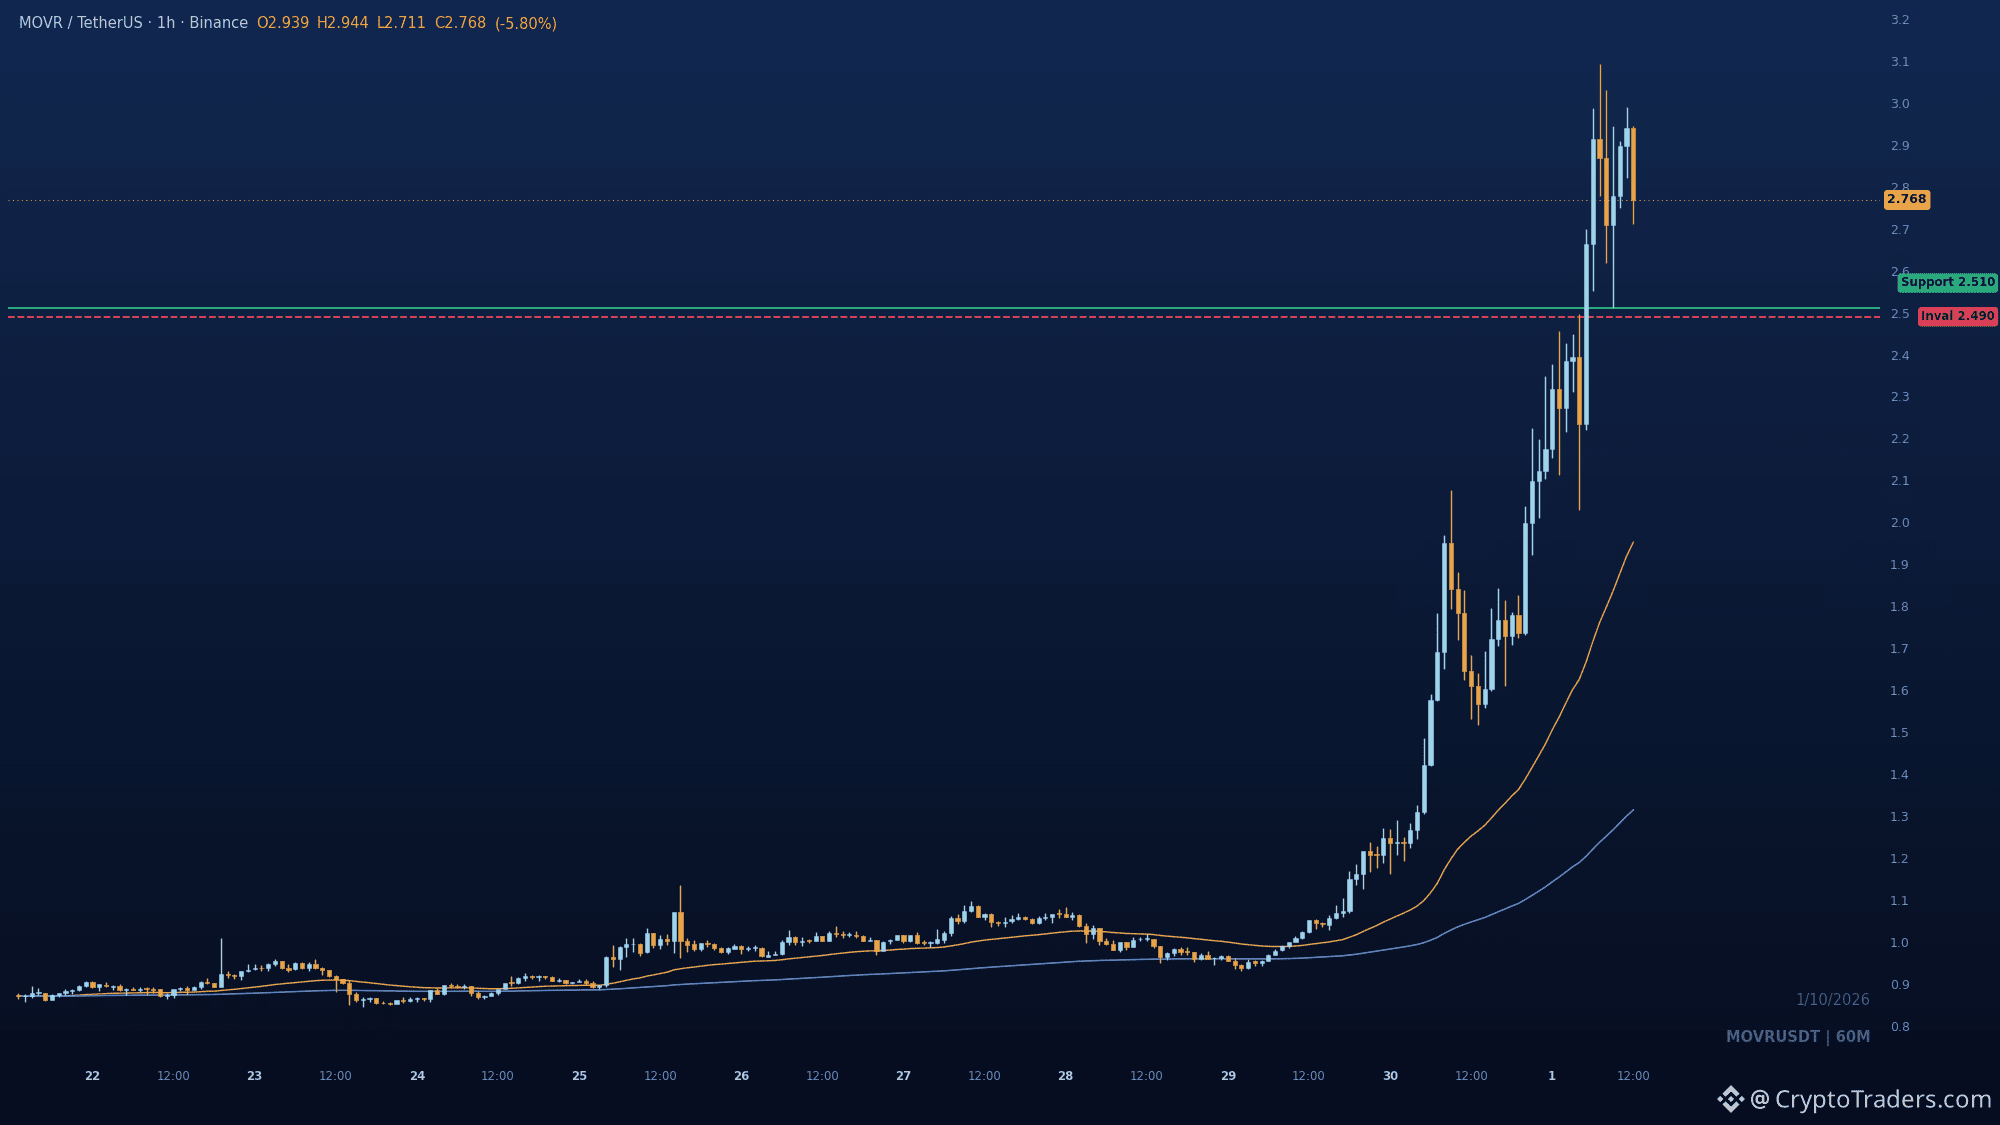
$MOVR ripped 74.8 percent into 3.0912, and the chart now says the easy part of that move is done. Displacement broke structure and swept buy-side liquidity at the swing high. Price is retracing from the range extreme, still in premium. The level that matters is 2.51, the recent swing low. Buyers defending it keeps open price discovery in play. Lose 2.49 and anyone who chased the top is holding a failed breakout with the whole impulse unwound underneath them. Are you treating 2.51 as the line, or waiting for a deeper flush? We break down setups like this with the group every day, so swing by if you want the next one. #Altcoin Season#
$MOVR ripped 74.8 percent into 3.0912, and the chart now says the easy part of that move is done. Displacement broke structure and swept buy-side liquidity at the swing high. Price is retracing from the range extreme, still in premium. The level that matters is 2.51, the recent swing low. Buyers defending it keeps open price discovery in play. Lose 2.49 and anyone who chased the top is holding a failed breakout with the whole impulse unwound underneath them. Are you treating 2.51 as the line, or waiting for a deeper flush? We break down setups like this with the group every day, so swing by if you want the next one. #Altcoin Season#
28
Lihat terjemahan
$NEAR either holds the 5.172 retest and grinds to 5.58, or that shelf gives way and the breakout above 5.403 was the high. The reclaim of structure is real: buyers took out the 5.403 swing high before offers showed up near local highs. The pullback is now sitting on the breakout area, with 5.172 as the swing low that matters. Defended there, buy-side liquidity at the 5.58 range high is the next draw. Lose 5.172 on a close and the premium side of the range stops paying. Does 5.172 get defended on the first touch, or do we need a deeper sweep first? Most of my daily charts land in the group, bio has the way in. #Altcoin Season#
$NEAR either holds the 5.172 retest and grinds to 5.58, or that shelf gives way and the breakout above 5.403 was the high. The reclaim of structure is real: buyers took out the 5.403 swing high before offers showed up near local highs. The pullback is now sitting on the breakout area, with 5.172 as the swing low that matters. Defended there, buy-side liquidity at the 5.58 range high is the next draw. Lose 5.172 on a close and the premium side of the range stops paying. Does 5.172 get defended on the first touch, or do we need a deeper sweep first? Most of my daily charts land in the group, bio has the way in. #Altcoin Season#
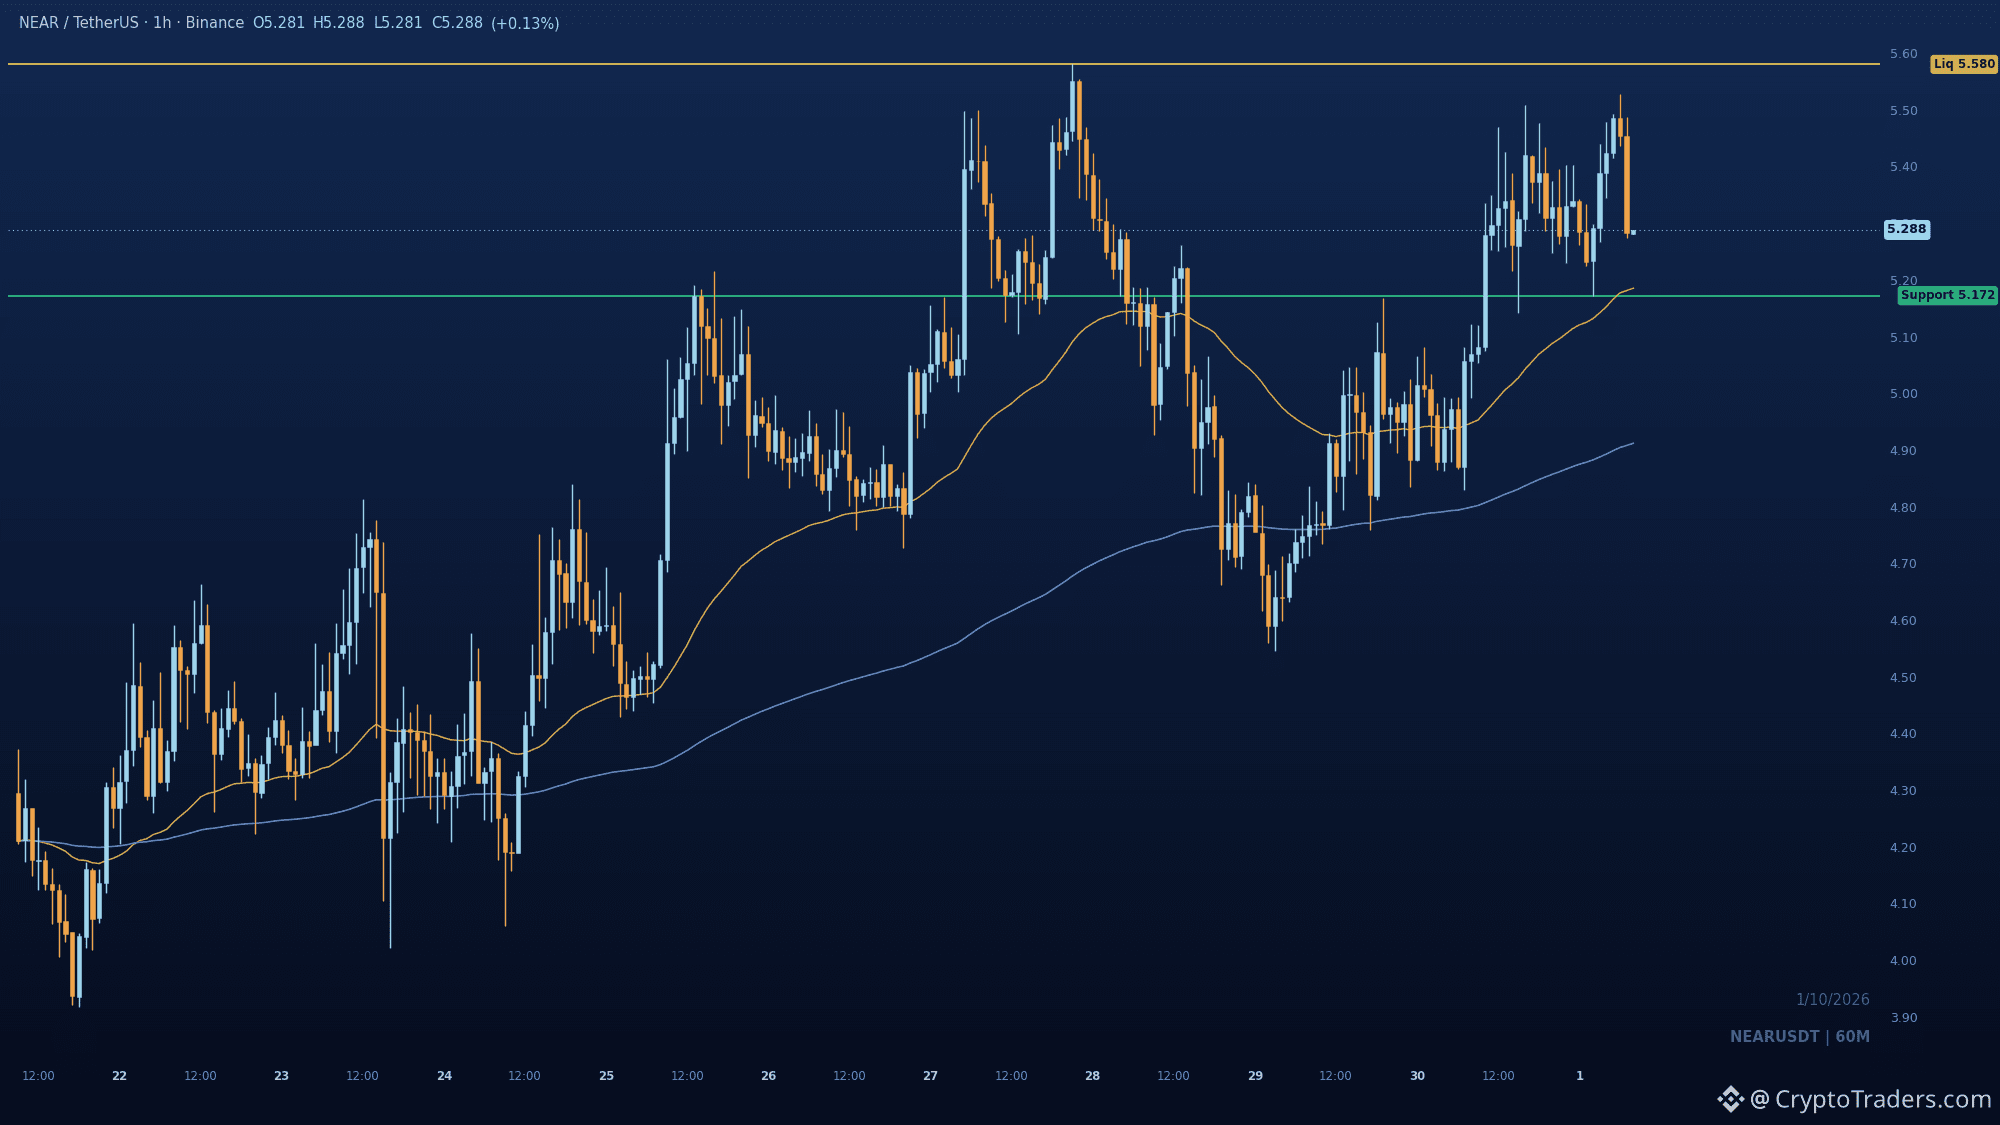
29
Lihat terjemahan
$DOGE just cleared 0.0958 after basing at 0.0935, and that same shelf rejected price earlier in the window. The 1h chart shows the converged EMAs reclaimed, with the candle closing above them for the first time since the selloff. Pullback zone sits at 0.09468 to 0.09481. If bids hold there, the next reference is the 0.09815 swing high where buy-side liquidity rests. Losing 0.0935 flips the recovery back to the sellers. Do you think 0.09815 gets tagged before a retest of the EMAs? More reads like this land in the group daily, details in my bio. #Altcoin Season#
$DOGE just cleared 0.0958 after basing at 0.0935, and that same shelf rejected price earlier in the window. The 1h chart shows the converged EMAs reclaimed, with the candle closing above them for the first time since the selloff. Pullback zone sits at 0.09468 to 0.09481. If bids hold there, the next reference is the 0.09815 swing high where buy-side liquidity rests. Losing 0.0935 flips the recovery back to the sellers. Do you think 0.09815 gets tagged before a retest of the EMAs? More reads like this land in the group daily, details in my bio. #Altcoin Season#
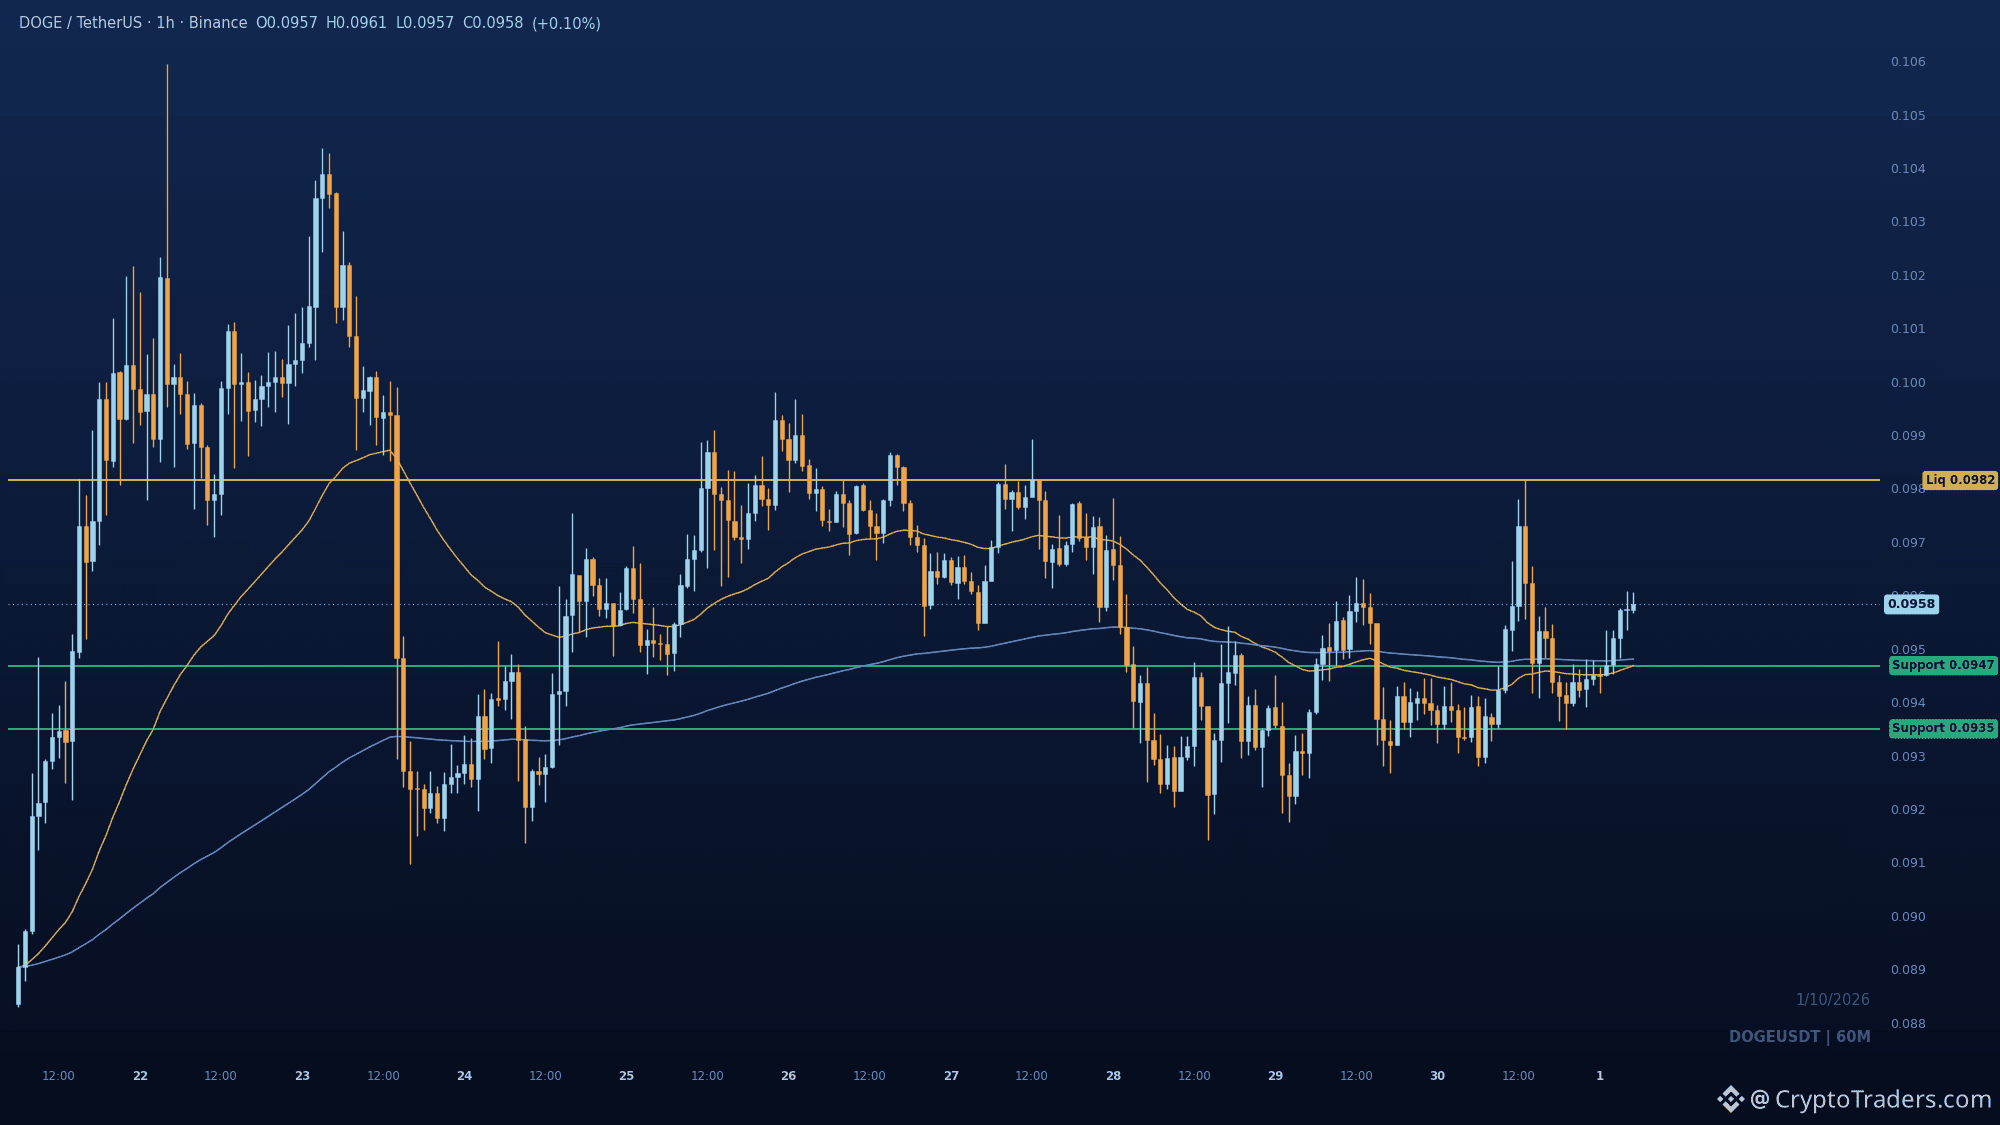
42
Lihat terjemahan
0.258. That is the whole story on $ENA after today's 10.1 percent push. Buyers swept the lows near 0.245, reclaimed the 0.258 swing area, and price is now holding above both EMAs on the 1h. The 0.258 to 0.261 band is the launch zone of this recovery, and a pullback into it is the test I expect to hold. If it does, the prior swing high at 0.2811 is the next buy-side liquidity to reach for. Losing 0.258 weakens the recovery, and 0.245 is where the whole structure fails. Do you think 0.2811 gets tagged on this attempt or after one more dip? Charts like this one land in the group every day, bio has the way in. #Altcoin Season#
0.258. That is the whole story on $ENA after today's 10.1 percent push. Buyers swept the lows near 0.245, reclaimed the 0.258 swing area, and price is now holding above both EMAs on the 1h. The 0.258 to 0.261 band is the launch zone of this recovery, and a pullback into it is the test I expect to hold. If it does, the prior swing high at 0.2811 is the next buy-side liquidity to reach for. Losing 0.258 weakens the recovery, and 0.245 is where the whole structure fails. Do you think 0.2811 gets tagged on this attempt or after one more dip? Charts like this one land in the group every day, bio has the way in. #Altcoin Season#
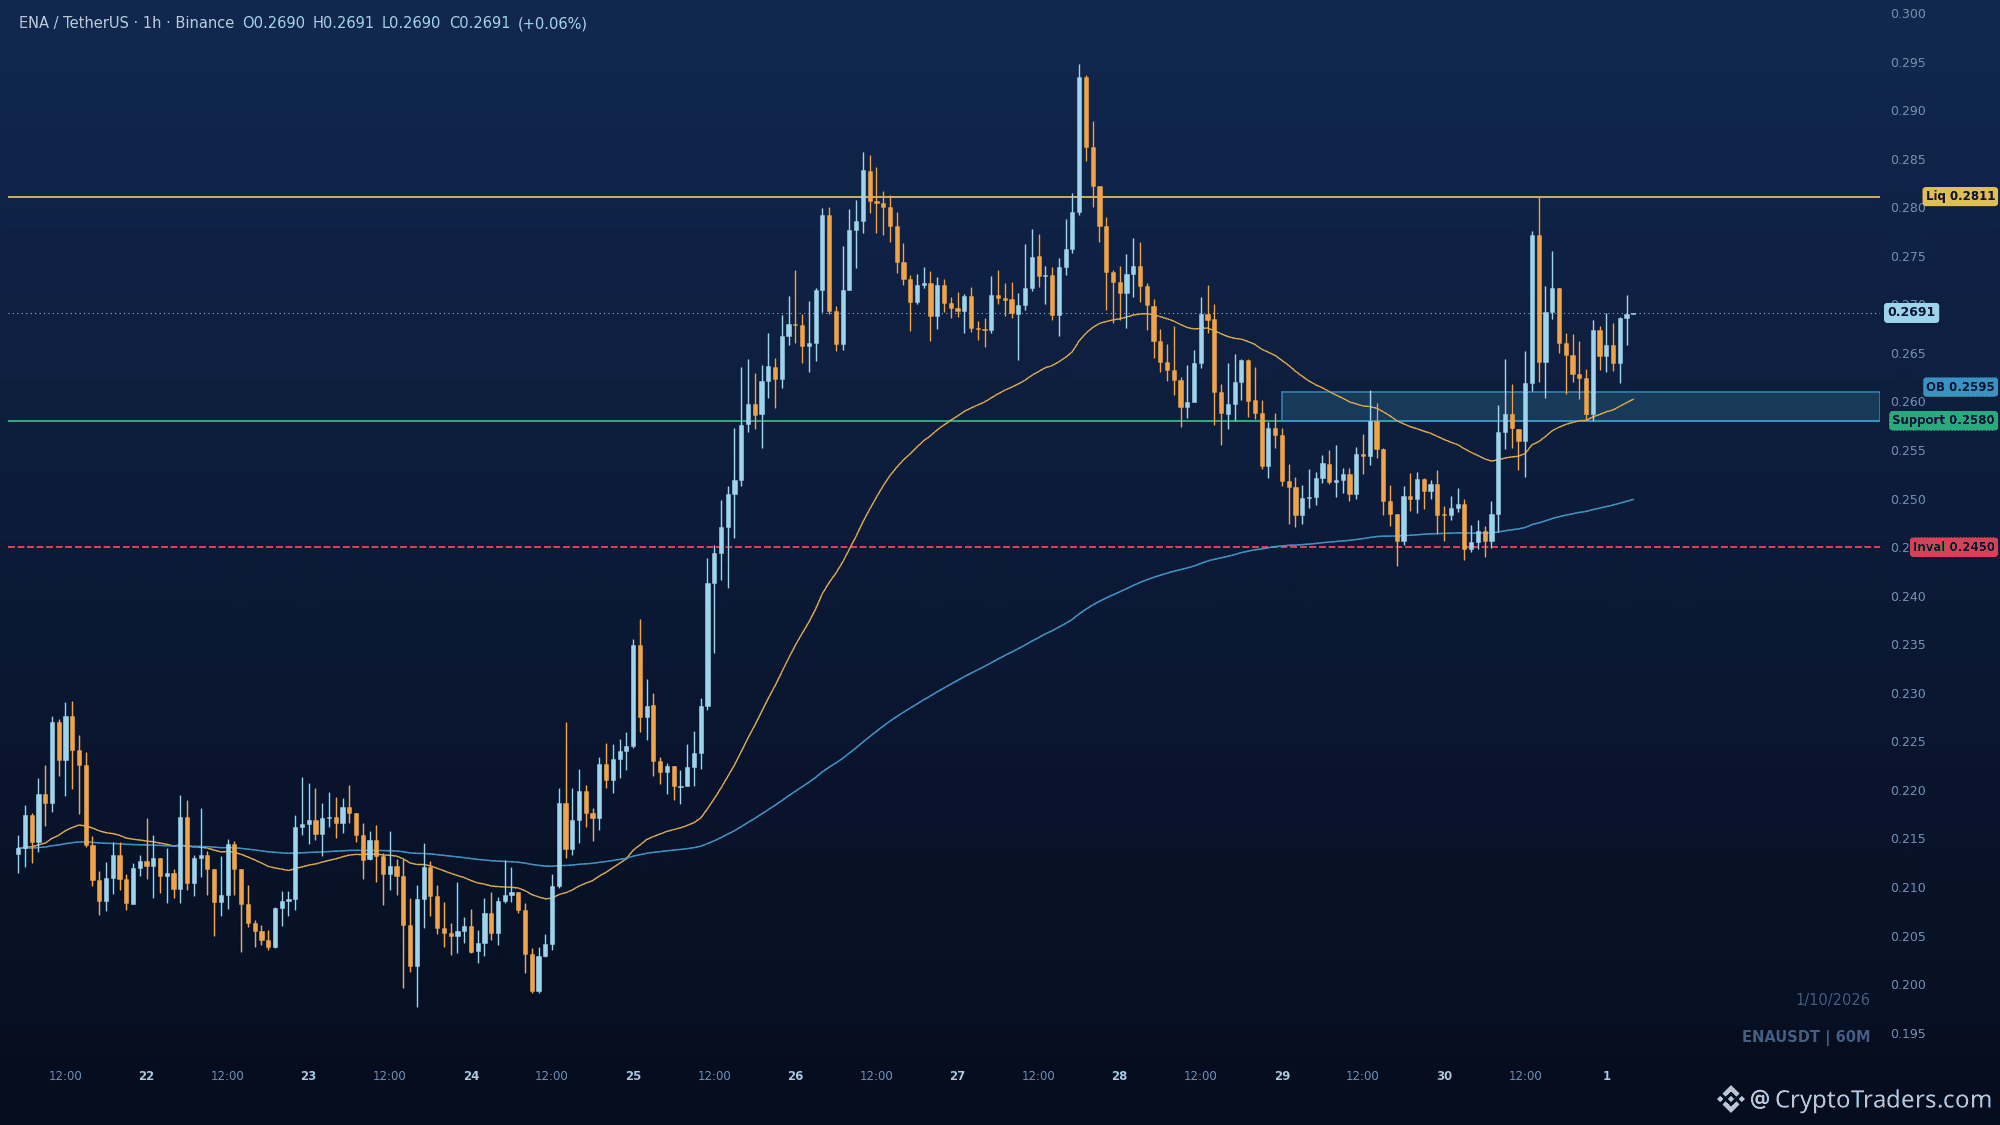
67
Apakah $PENGU bisa bertahan pada 0.009432, atau penolakan di bawah 0.0103 perlu satu sesi lagi agar benar-benar terjadi? Pantulan dari penurunan awalnya ditolak mendekati 0.0103, dan jam terakhir ditutup kembali di bawah EMA. Itu membuat rentang jangka pendek yang mengendalikan, dengan swing low 0.009432 sebagai kumpulan sisi jual yang jelas di bawahnya. Rebut kembali 0.01061 dan pembacaan bearish ini mati; sampai saat itu bias tetap turun. Berapa lama Anda memberi waktu bagi para bulls untuk mengembalikan level itu? Setup harian seperti ini masuk ke grup, bio punya caranya masuk. #Altcoin Season#
Apakah $PENGU bisa bertahan pada 0.009432, atau penolakan di bawah 0.0103 perlu satu sesi lagi agar benar-benar terjadi? Pantulan dari penurunan awalnya ditolak mendekati 0.0103, dan jam terakhir ditutup kembali di bawah EMA. Itu membuat rentang jangka pendek yang mengendalikan, dengan swing low 0.009432 sebagai kumpulan sisi jual yang jelas di bawahnya. Rebut kembali 0.01061 dan pembacaan bearish ini mati; sampai saat itu bias tetap turun. Berapa lama Anda memberi waktu bagi para bulls untuk mengembalikan level itu? Setup harian seperti ini masuk ke grup, bio punya caranya masuk. #Altcoin Season#
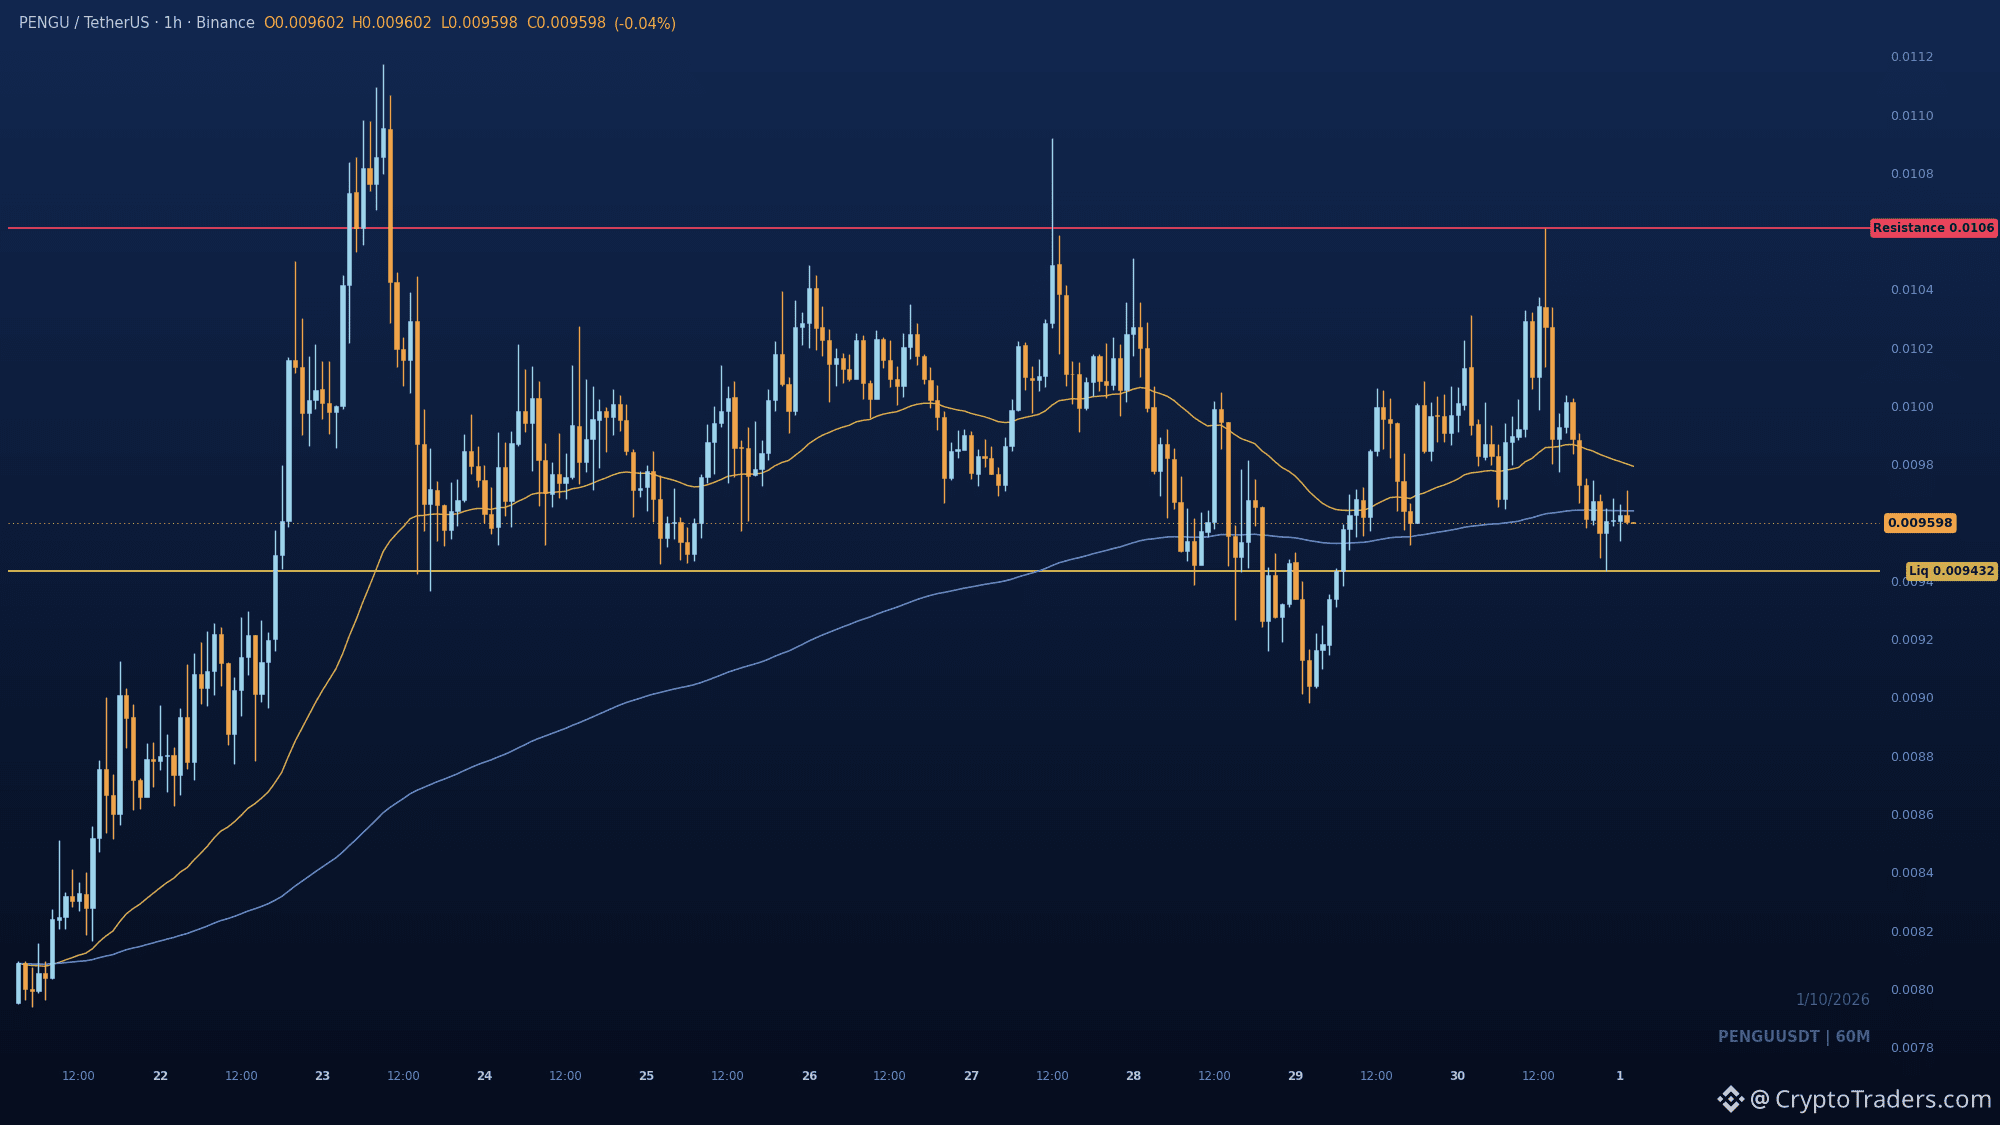
60
Lihat terjemahan
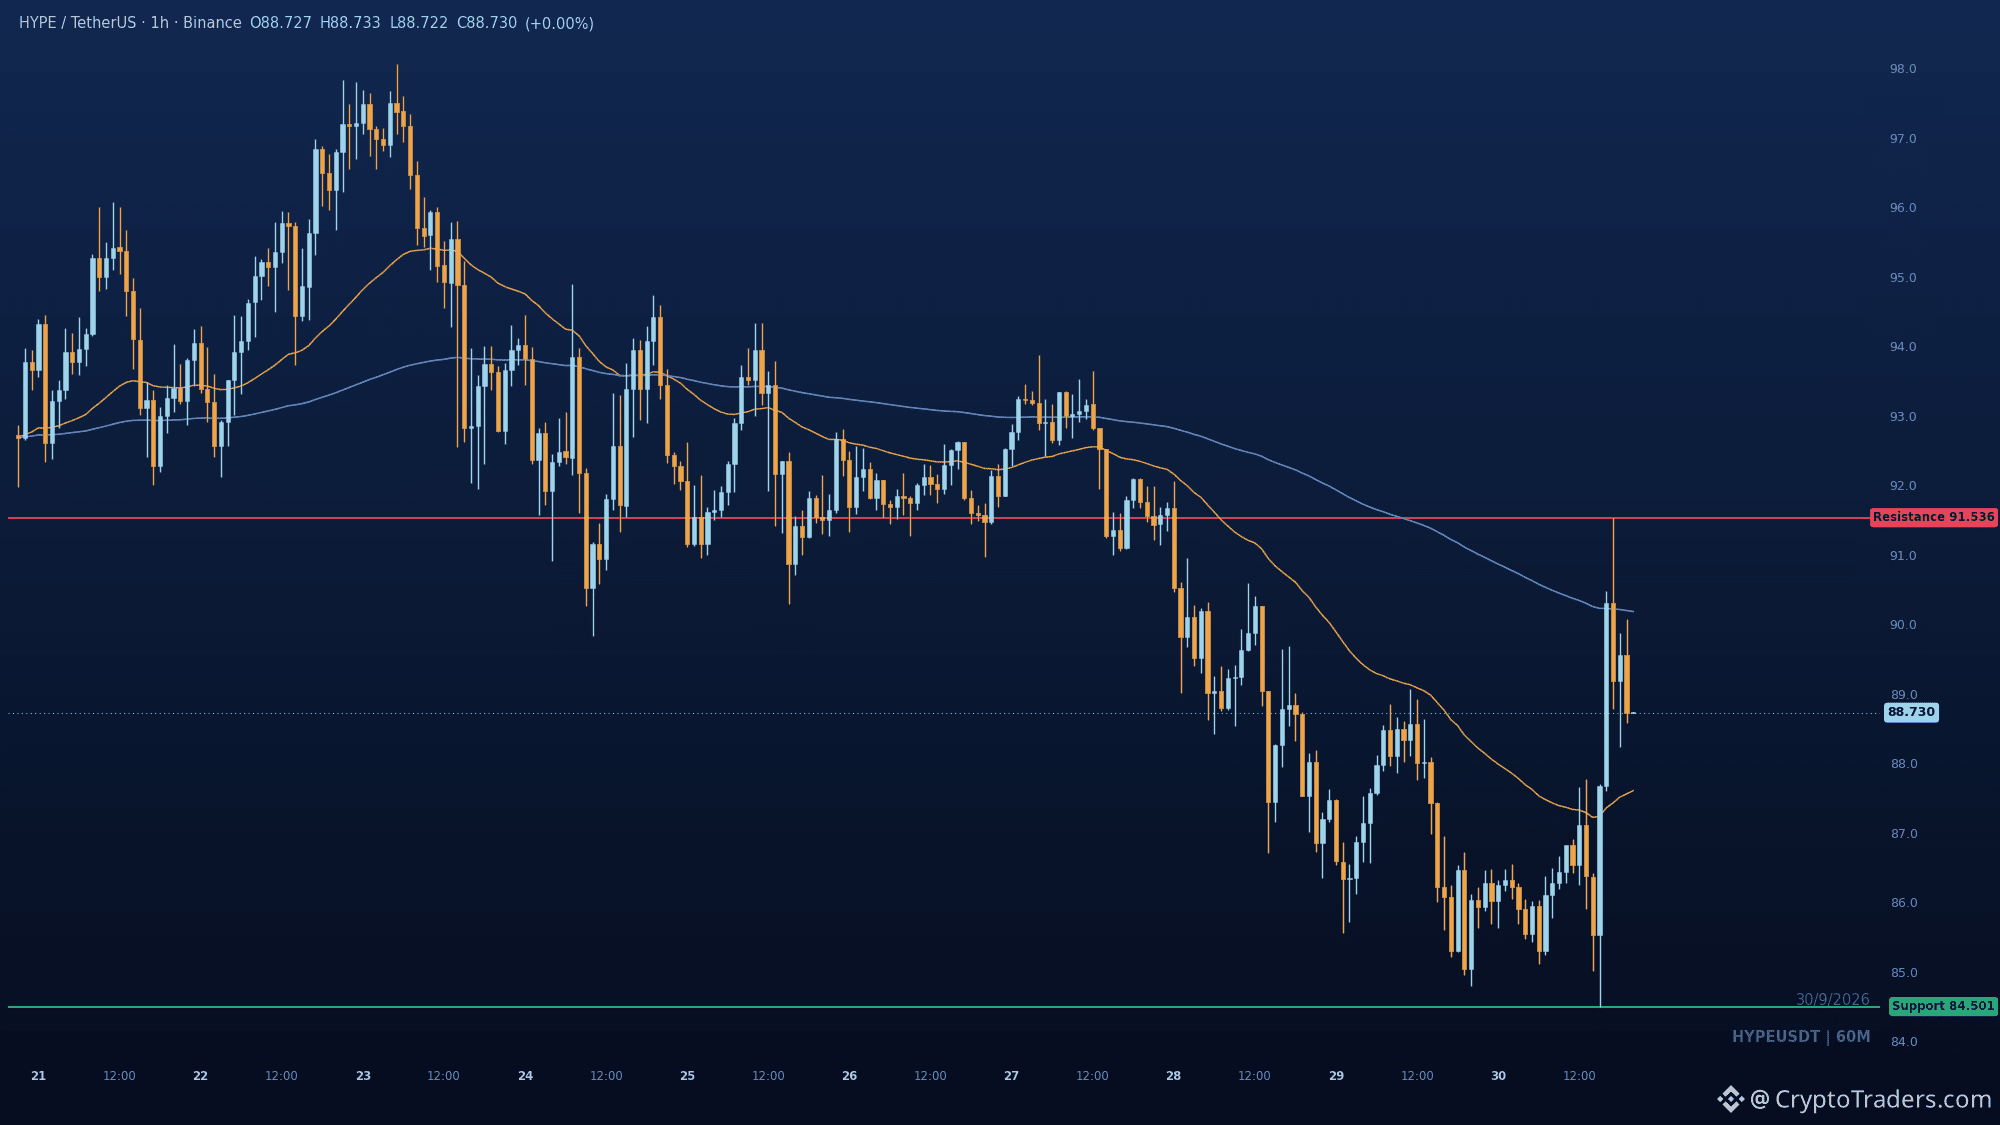
The 4.2 percent bounce in $HYPE is already stalling at 91.536, and that rejection keeps the 1h structure bearish. Price rebounded hard off the 84.501 low, but the lower highs and lower lows are still the pattern that matters. 91.536 is the line: sellers defended it once, and a clean reclaim is what would flip this read. Until then, the assumption is continuation toward 84.501, where sell-side liquidity sits. Failure to hold above the rejection area is the surprise scenario, not the base case. Do you think 84.501 gets retested before HYPE reclaims 91.536? More reads like this land daily in the community, my bio has the details. #Altcoin Season#
The 4.2 percent bounce in $HYPE is already stalling at 91.536, and that rejection keeps the 1h structure bearish. Price rebounded hard off the 84.501 low, but the lower highs and lower lows are still the pattern that matters. 91.536 is the line: sellers defended it once, and a clean reclaim is what would flip this read. Until then, the assumption is continuation toward 84.501, where sell-side liquidity sits. Failure to hold above the rejection area is the surprise scenario, not the base case. Do you think 84.501 gets retested before HYPE reclaims 91.536? More reads like this land daily in the community, my bio has the details. #Altcoin Season#
Lihat terjemahan
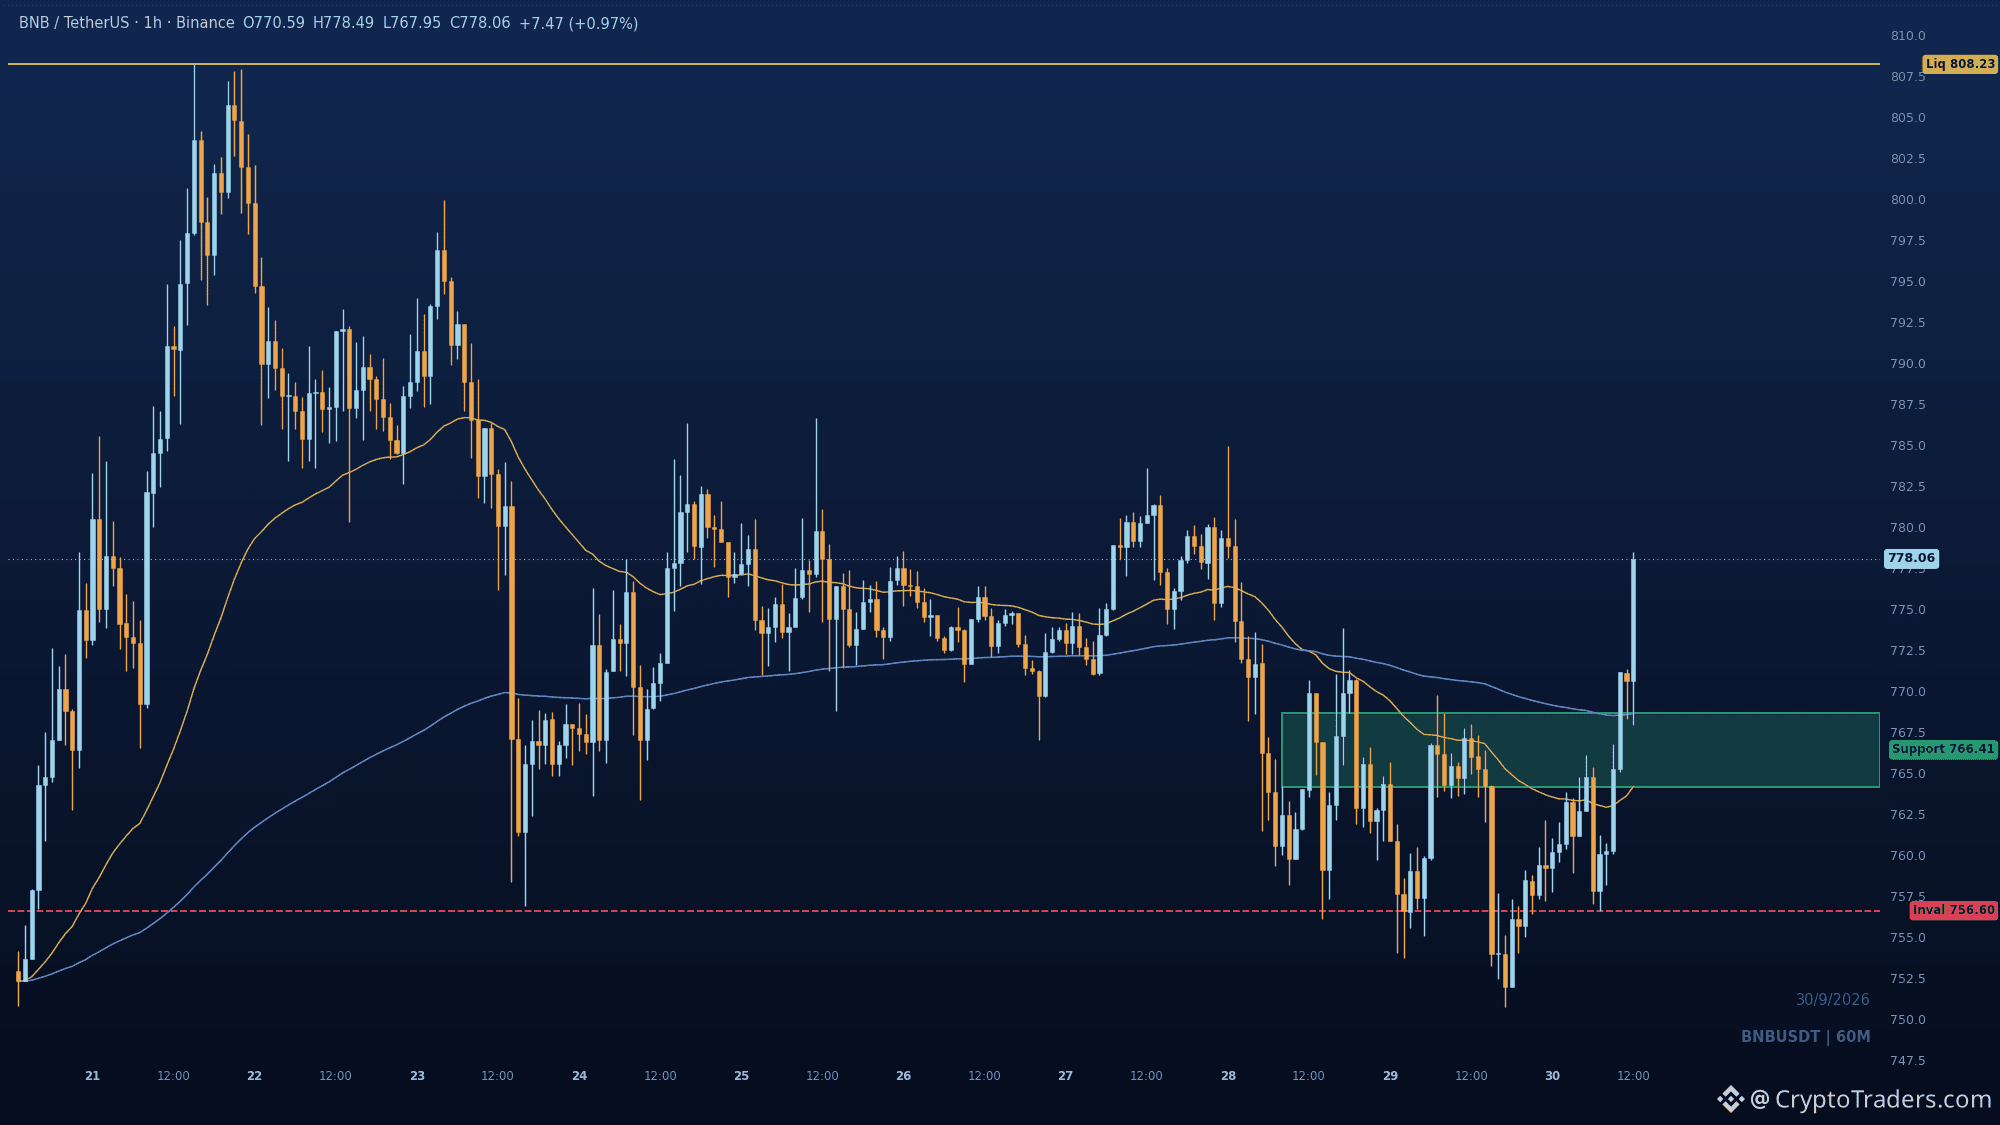
Can $BNB hold the 764 to 768 EMA cluster it just reclaimed, or does the displacement above 766.07 start fading? Buyers drove price out of the 756.6 to 750.75 low area and punched through the recent swing high, flipping structure bullish and reclaiming both EMAs. Price is still under the range midpoint, so this sits in discount with the 808.23 window high as the buy-side draw. Holding 756.6 on any retest keeps the higher low intact. A close back under it would undo the displacement, put the EMAs back overhead and hand the range back to sellers. Are you watching the EMA retest or the 808.23 liquidity above? One of several charts the desk breaks down for the group every morning. #Altcoin Season#
Can $BNB hold the 764 to 768 EMA cluster it just reclaimed, or does the displacement above 766.07 start fading? Buyers drove price out of the 756.6 to 750.75 low area and punched through the recent swing high, flipping structure bullish and reclaiming both EMAs. Price is still under the range midpoint, so this sits in discount with the 808.23 window high as the buy-side draw. Holding 756.6 on any retest keeps the higher low intact. A close back under it would undo the displacement, put the EMAs back overhead and hand the range back to sellers. Are you watching the EMA retest or the 808.23 liquidity above? One of several charts the desk breaks down for the group every morning. #Altcoin Season#
28
Lihat terjemahan
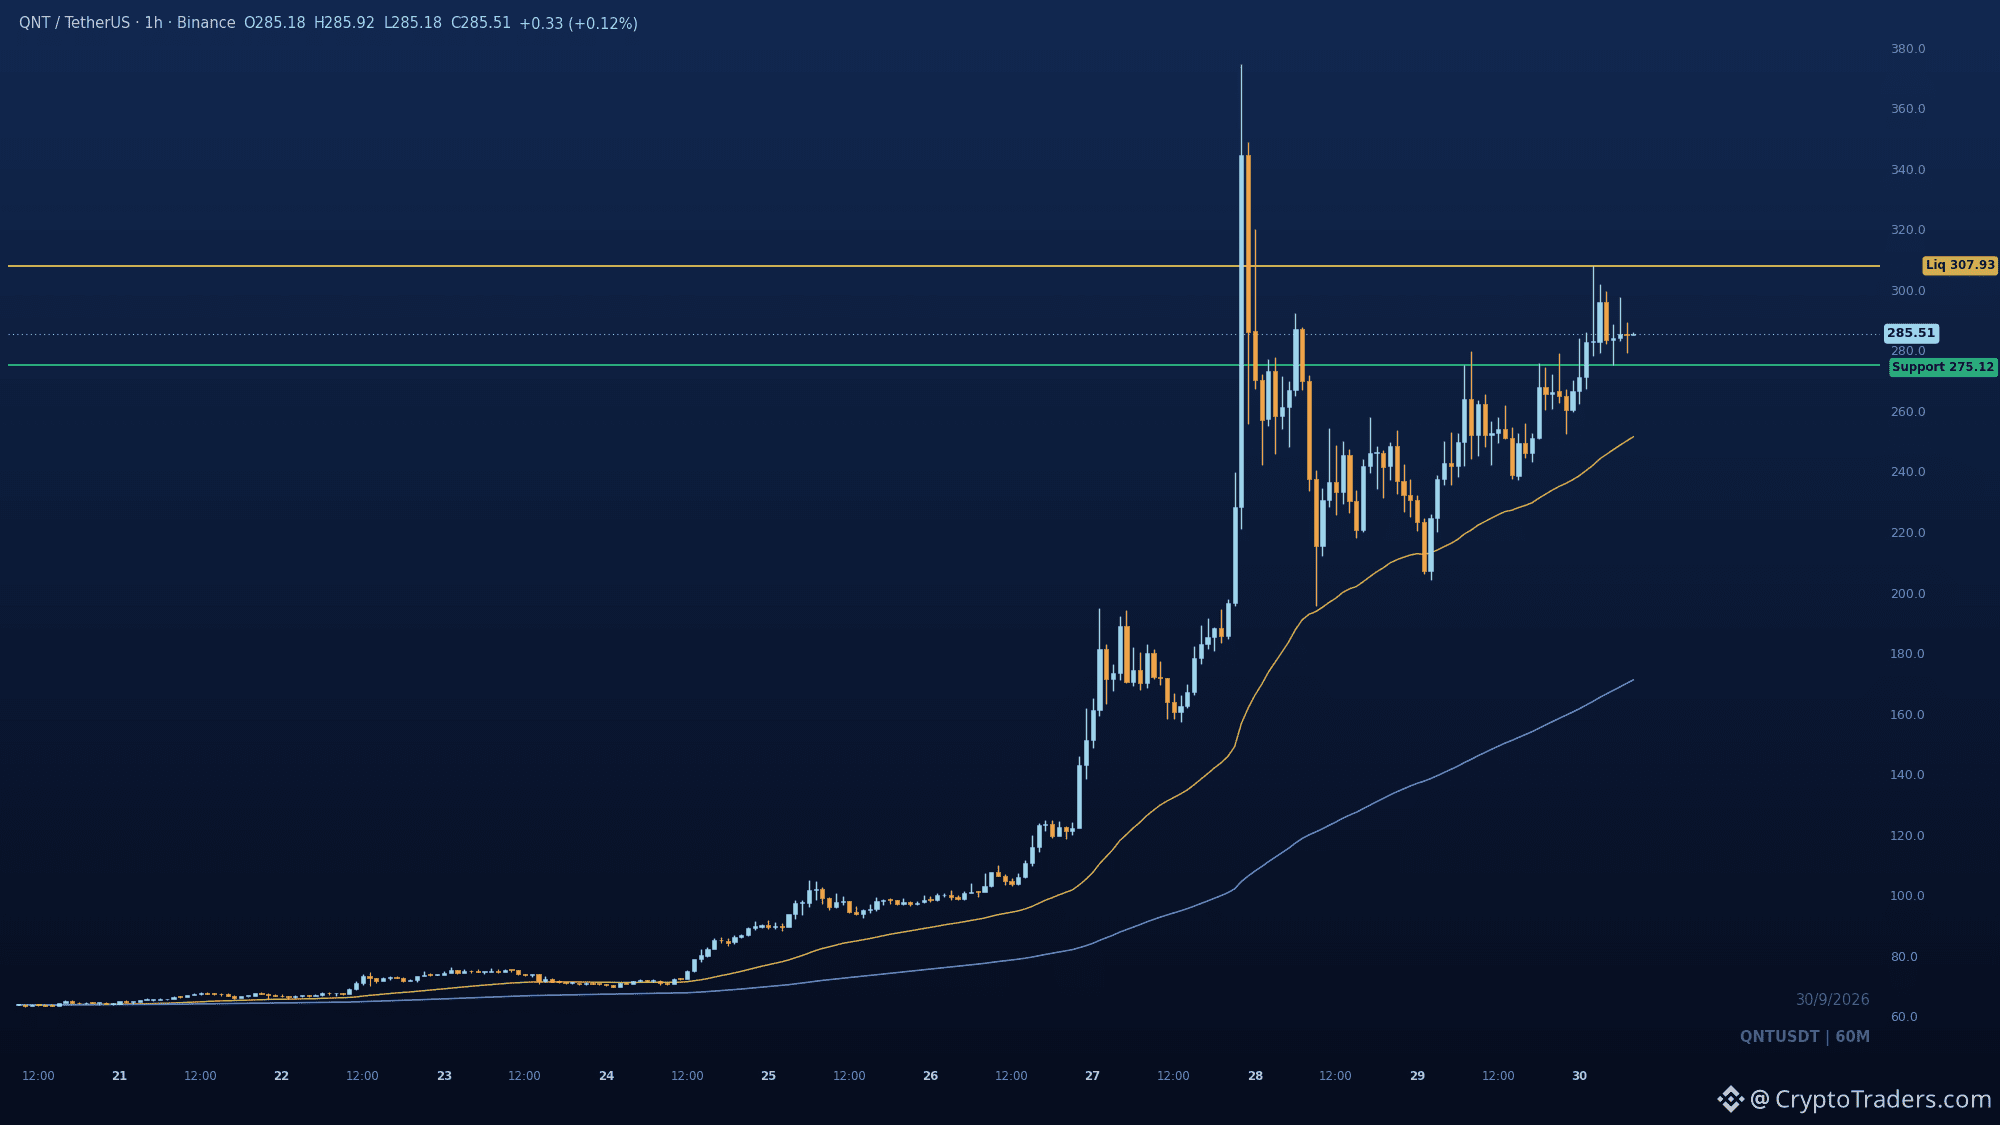
$QNT either defends 275.12 and takes another run at 307.93, or it loses that shelf and the bid changes hands. The 1H trend is still bullish after the break through 260 to 275, and price is sitting in the premium half of the range. Higher lows keep forming above a rising 50 EMA, so buyers are still the ones paying at 275. That is the line: hold it and the draw is the buy-side pool at 307.93, lose it decisively and the continuation read weakens while sellers take over the tape. What would you need to see at 275 to stay with this one? #Altcoin Season#
$QNT either defends 275.12 and takes another run at 307.93, or it loses that shelf and the bid changes hands. The 1H trend is still bullish after the break through 260 to 275, and price is sitting in the premium half of the range. Higher lows keep forming above a rising 50 EMA, so buyers are still the ones paying at 275. That is the line: hold it and the draw is the buy-side pool at 307.93, lose it decisively and the continuation read weakens while sellers take over the tape. What would you need to see at 275 to stay with this one? #Altcoin Season#
26
Lihat terjemahan
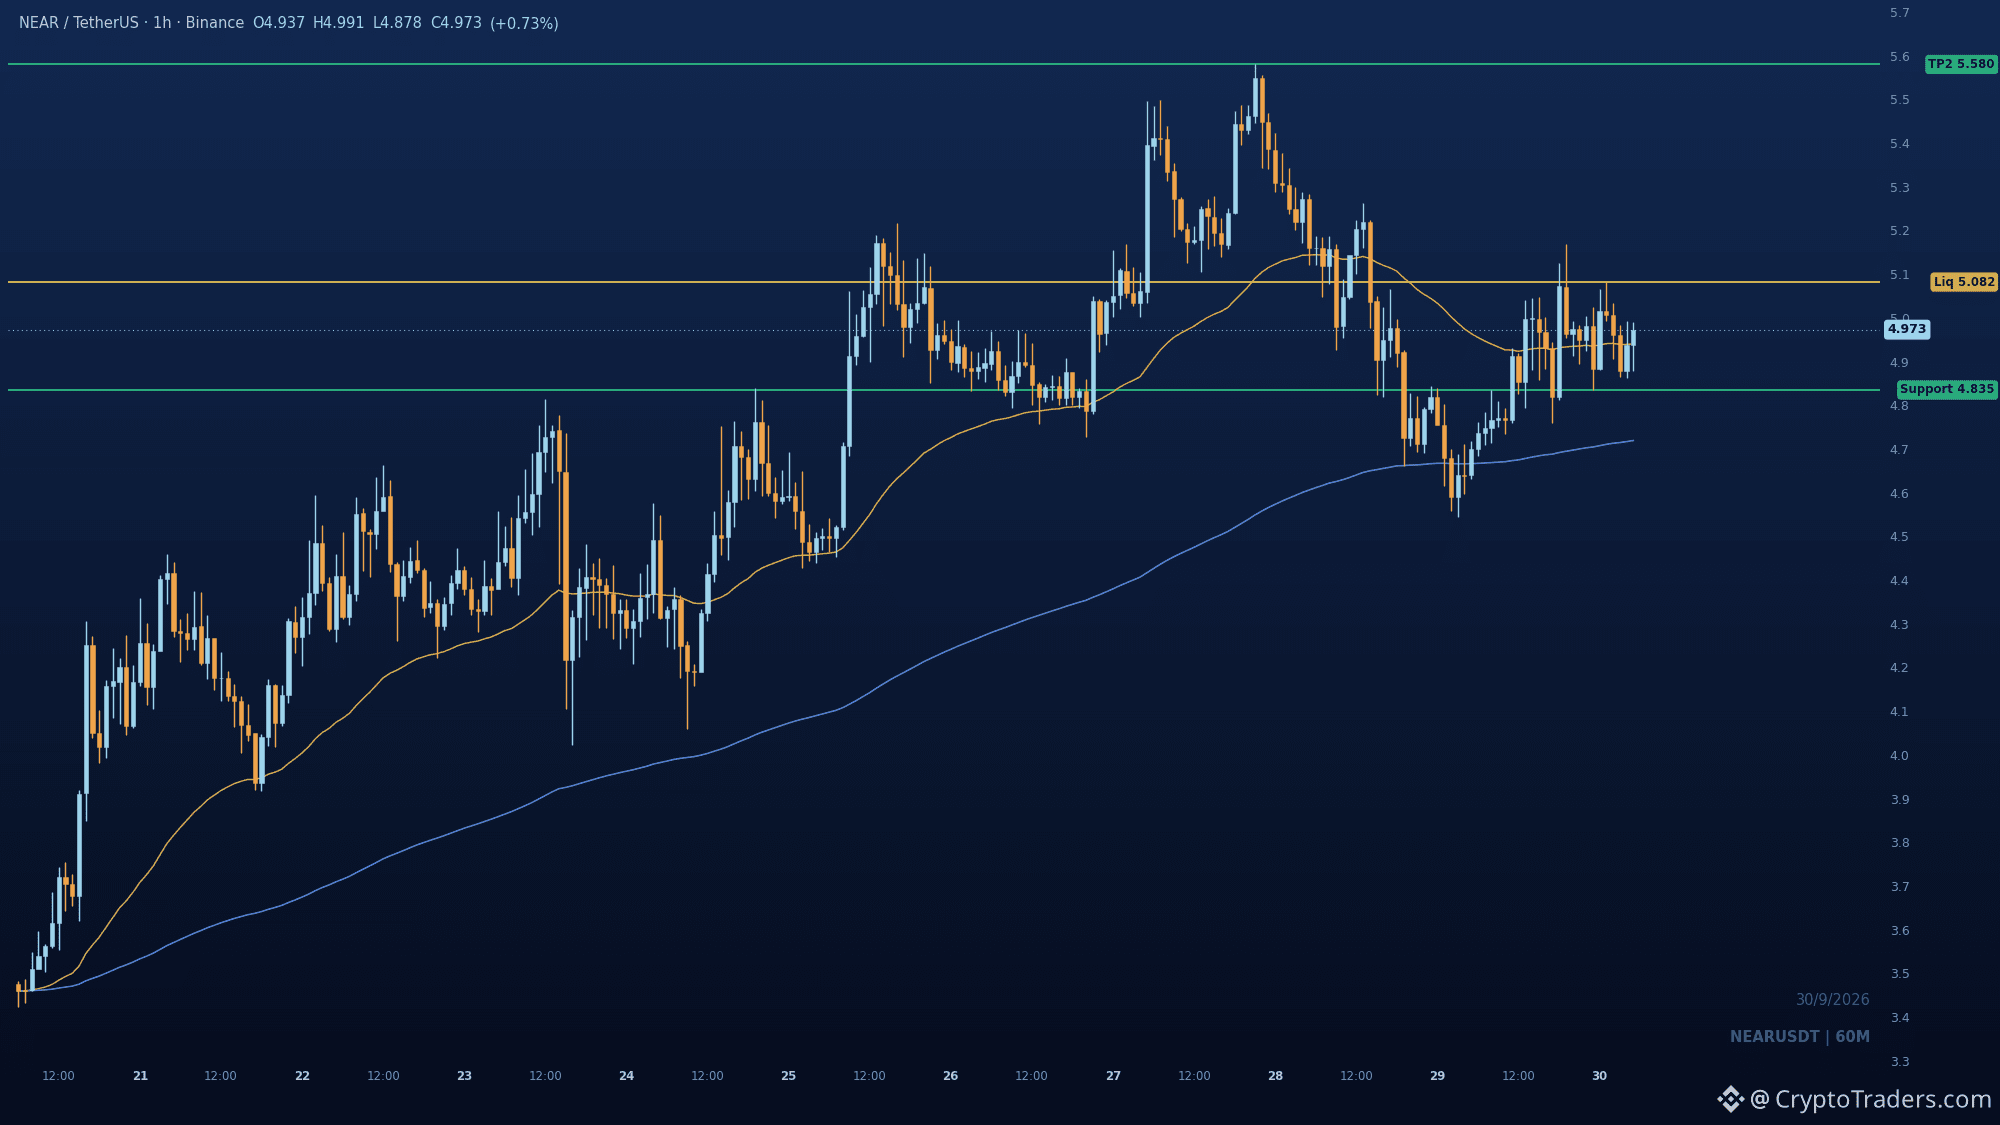
$NEAR made the watchlist today because 4.835 is doing all the work: hold it and the recovery stays intact, lose it and the reclaimed EMA stops meaning anything. After the rally, price pulled back to the rising 200 EMA and bounced, taking back the fast EMA. That is a local bullish change of character. Upside draw is the buy-side liquidity sitting at 5.082, the recent swing high. A clean break there puts the prior high at 5.58 back in play. Below 4.835, the recent swing low, the bullish read falls apart and the recovery was just a bounce. Which one do you think prints first, the 5.082 sweep or the 4.835 break? More setups like this land daily in the group, bio has the way in. #Altcoin Season#
$NEAR made the watchlist today because 4.835 is doing all the work: hold it and the recovery stays intact, lose it and the reclaimed EMA stops meaning anything. After the rally, price pulled back to the rising 200 EMA and bounced, taking back the fast EMA. That is a local bullish change of character. Upside draw is the buy-side liquidity sitting at 5.082, the recent swing high. A clean break there puts the prior high at 5.58 back in play. Below 4.835, the recent swing low, the bullish read falls apart and the recovery was just a bounce. Which one do you think prints first, the 5.082 sweep or the 4.835 break? More setups like this land daily in the group, bio has the way in. #Altcoin Season#
41
Masuk untuk menjelajahi konten lainnya
Bergabunglah dengan pengguna kripto global di Binance Square
⚡️ Dapatkan informasi terbaru dan berguna tentang kripto.
💬 Dipercayai oleh bursa kripto terbesar di dunia.
👍 Temukan wawasan nyata dari kreator terverifikasi.
Email/Nomor Ponsel
Topik Sedang Tren
BitcoinParesGainsAfterRallyTo$86.5K
880 penayangan
31 Berdiskusi
$BTC bertengger tepat di tepi pisau di $86k. Bulls menumpuk 1.436 BTC untuk mempertahankan level itu, sementara bears memasang 1.008 BTC sebagai tembok di $86.5k. Ini bahan bakar likuidasi murni—siapa pun yang kalah dalam pertarungan ini akan dihajar habis.
Zona scalping jangka pendek. Jika bulls menembus $86.5k dengan volume, kemungkinan besar kita akan bergerak cepat menuju $88k. Jika bears bertahan dan mendorong turun, $84k adalah tujuan berikutnya dan long akan tersapu bersih.
Perhatikan tape dengan saksama. Salah satu pihak sebentar lagi akan dihancurkan, dan pergerakannya akan brutal apa pun arahnya.
AI Market Brief
·Disukai 4 Kali
·5.8k penayangan
CerebrasSinksNearly20%OnReportNvidiaToPowerOpenAI
4,585 penayangan
111 Berdiskusi
SECProposesCryptoCustodyRules
26,354 penayangan
261 Berdiskusi