
CryptoZeno 1
481 Posting

CryptoZeno 1
Laporkan
Blokir Pengguna
Featured Creator on #CoinMarketCap #BinanceSquare and #CryptoQuant | On Chain Research and Market Insights
0 Mengikuti
8 Pengikut
19 Disukai
Posting
·
--
Lihat terjemahan
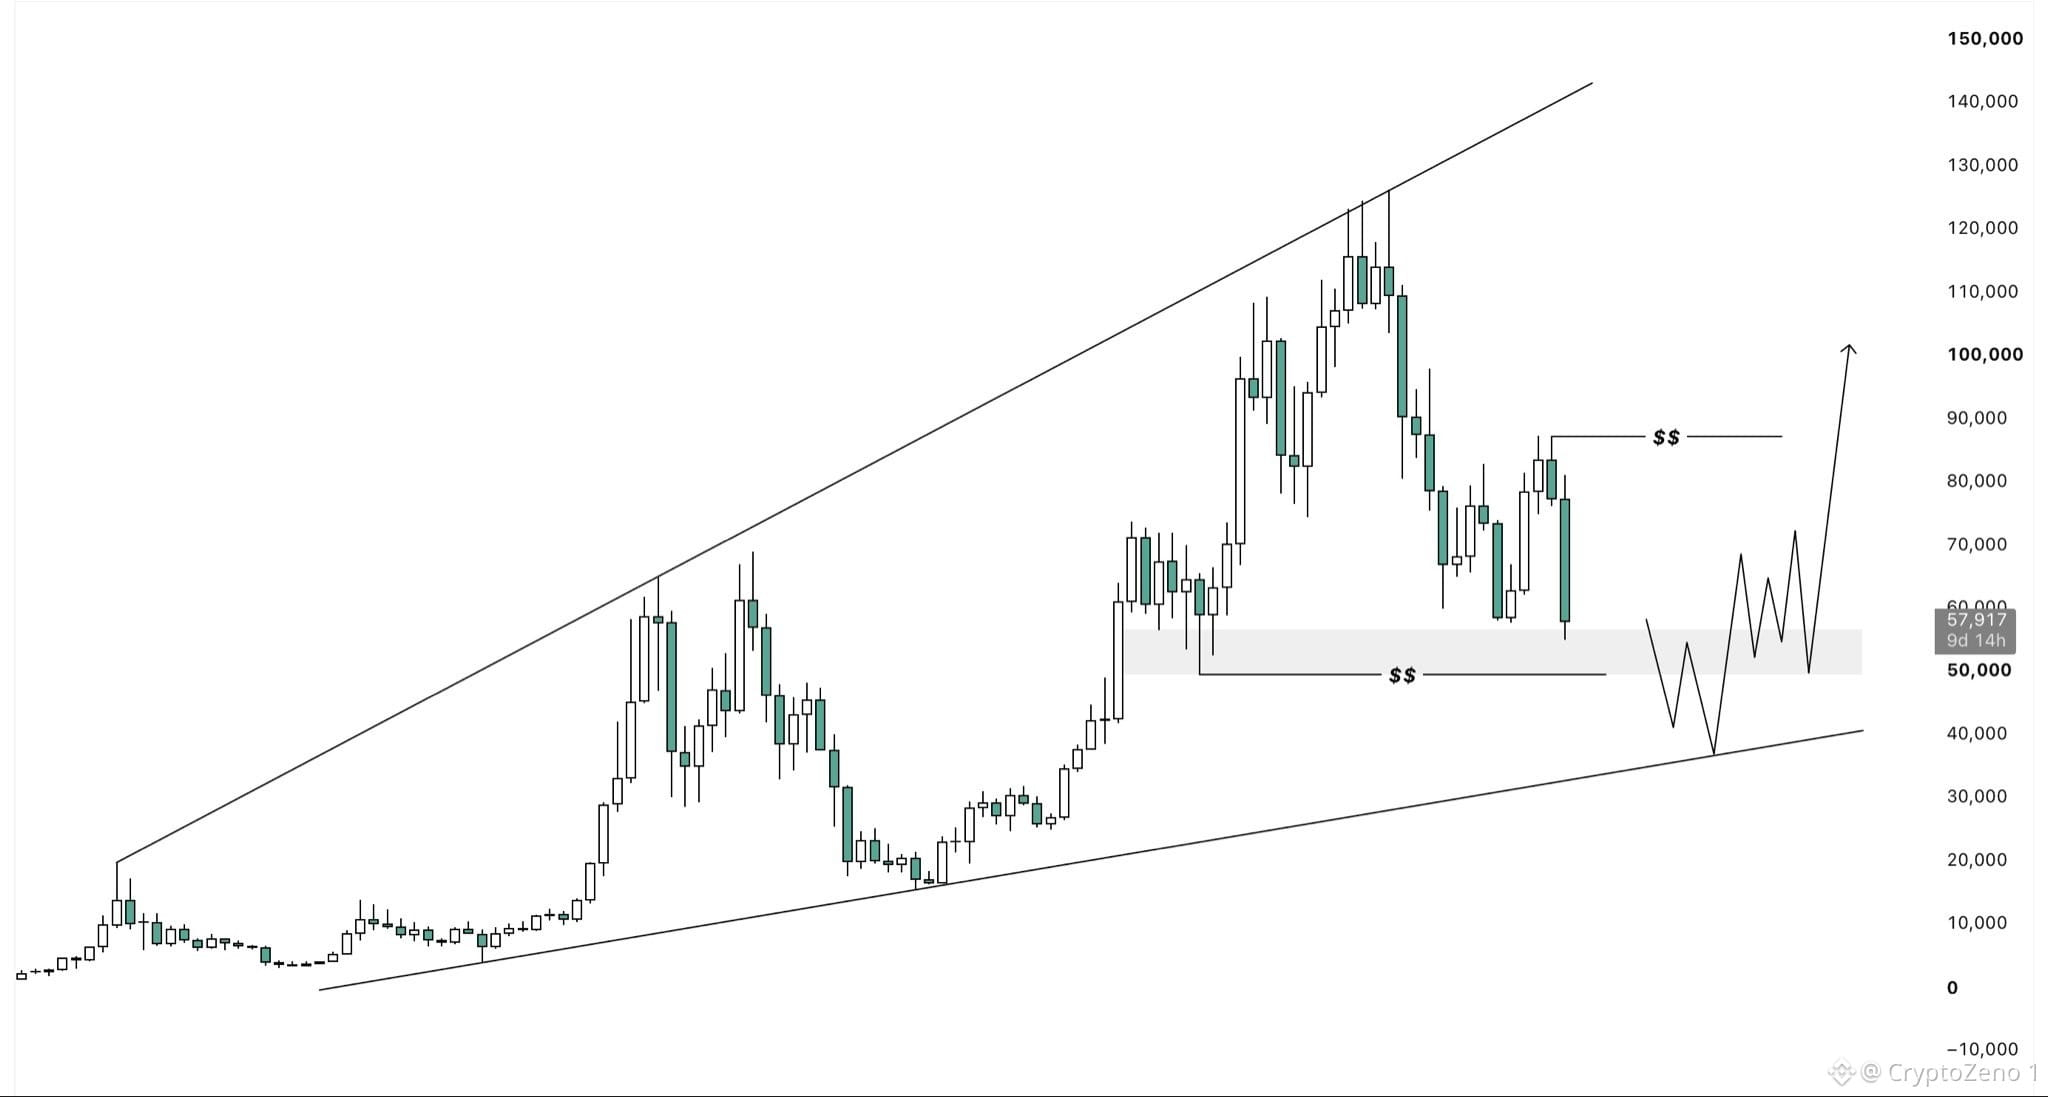
$BTC Welcome to my doomsday scenario.
BTC has been respecting this rising broadening channel since 2017.
If the lows of the accumulation range from summer 2024 fail to hold, we could be looking at a much deeper correction that eventually sends price back towards the lower boundary of this channel.
At that point, BTC would be trading below $40k.
Interestingly, a move into that region would put BTC slightly over 70% below the current ATH, which would perfectly fit the broader pattern of drawdowns becoming slightly smaller with each cycle.
However, I want to make it clear that this is not my main scenario.
It’s simply the worst case I’m prepared for and one that I don’t think can be ruled out entirely. #BTC Price Analysis# #Macro Insights#
$BTC Welcome to my doomsday scenario.
BTC has been respecting this rising broadening channel since 2017.
If the lows of the accumulation range from summer 2024 fail to hold, we could be looking at a much deeper correction that eventually sends price back towards the lower boundary of this channel.
At that point, BTC would be trading below $40k.
Interestingly, a move into that region would put BTC slightly over 70% below the current ATH, which would perfectly fit the broader pattern of drawdowns becoming slightly smaller with each cycle.
However, I want to make it clear that this is not my main scenario.
It’s simply the worst case I’m prepared for and one that I don’t think can be ruled out entirely. #BTC Price Analysis# #Macro Insights#
BTC has been respecting this rising broadening channel since 2017.
If the lows of the accumulation range from summer 2024 fail to hold, we could be looking at a much deeper correction that eventually sends price back towards the lower boundary of this channel.
At that point, BTC would be trading below $40k.
Interestingly, a move into that region would put BTC slightly over 70% below the current ATH, which would perfectly fit the broader pattern of drawdowns becoming slightly smaller with each cycle.
However, I want to make it clear that this is not my main scenario.
It’s simply the worst case I’m prepared for and one that I don’t think can be ruled out entirely. #BTC Price Analysis# #Macro Insights#
66
·
--
Lihat terjemahan
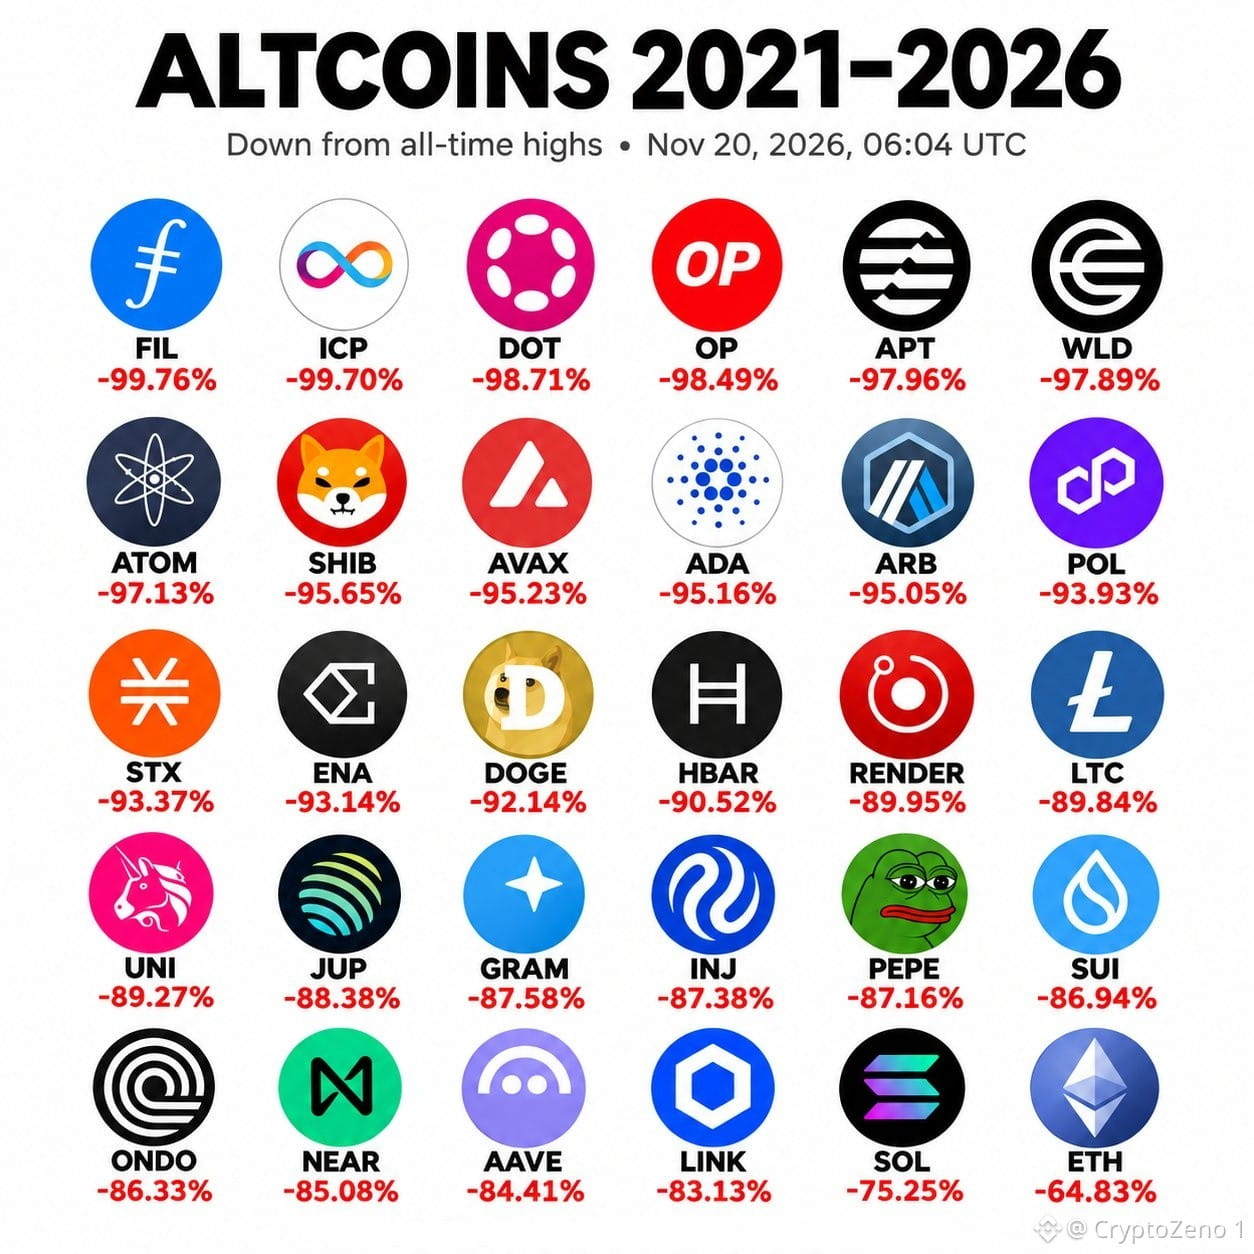
🚨 $BTC ALTCOIN INVESTORS HAVE LOST UP TO 98% OF THEIR WEALTH SINCE 2021. THE DAMAGE IS BRUTAL.
Imagine investing $100,000 in altcoins during the 2021 bull run, holding through five years of market cycles, and watching your portfolio collapse to just $2,000–$3,000. That is a potential loss of 97–98%, with almost an entire investment wiped out.
The numbers are devastating. FIL is down 99.76%, ICP 99.70%, DOT 98.71%, OP 98.49%, and APT 97.96% from their all-time highs. Even major names like ADA, AVAX, LINK, SOL and ETH remain significantly below their previous peaks.
Five years in the market, yet some altcoins have failed to recover even a fraction of their former value. A strong narrative, a famous project, or a previous all-time high does not guarantee long-term survival.
This is the brutal reality of altcoin investing: buying the hype is easy, but preserving capital through an entire market cycle is the real challenge. #BTC Price Analysis# #Macro Insights# #Altcoin Season#
🚨 $BTC ALTCOIN INVESTORS HAVE LOST UP TO 98% OF THEIR WEALTH SINCE 2021. THE DAMAGE IS BRUTAL.
Imagine investing $100,000 in altcoins during the 2021 bull run, holding through five years of market cycles, and watching your portfolio collapse to just $2,000–$3,000. That is a potential loss of 97–98%, with almost an entire investment wiped out.
The numbers are devastating. FIL is down 99.76%, ICP 99.70%, DOT 98.71%, OP 98.49%, and APT 97.96% from their all-time highs. Even major names like ADA, AVAX, LINK, SOL and ETH remain significantly below their previous peaks.
Five years in the market, yet some altcoins have failed to recover even a fraction of their former value. A strong narrative, a famous project, or a previous all-time high does not guarantee long-term survival.
This is the brutal reality of altcoin investing: buying the hype is easy, but preserving capital through an entire market cycle is the real challenge. #BTC Price Analysis# #Macro Insights# #Altcoin Season#
Imagine investing $100,000 in altcoins during the 2021 bull run, holding through five years of market cycles, and watching your portfolio collapse to just $2,000–$3,000. That is a potential loss of 97–98%, with almost an entire investment wiped out.
The numbers are devastating. FIL is down 99.76%, ICP 99.70%, DOT 98.71%, OP 98.49%, and APT 97.96% from their all-time highs. Even major names like ADA, AVAX, LINK, SOL and ETH remain significantly below their previous peaks.
Five years in the market, yet some altcoins have failed to recover even a fraction of their former value. A strong narrative, a famous project, or a previous all-time high does not guarantee long-term survival.
This is the brutal reality of altcoin investing: buying the hype is easy, but preserving capital through an entire market cycle is the real challenge. #BTC Price Analysis# #Macro Insights# #Altcoin Season#
46
·
--
Lihat terjemahan
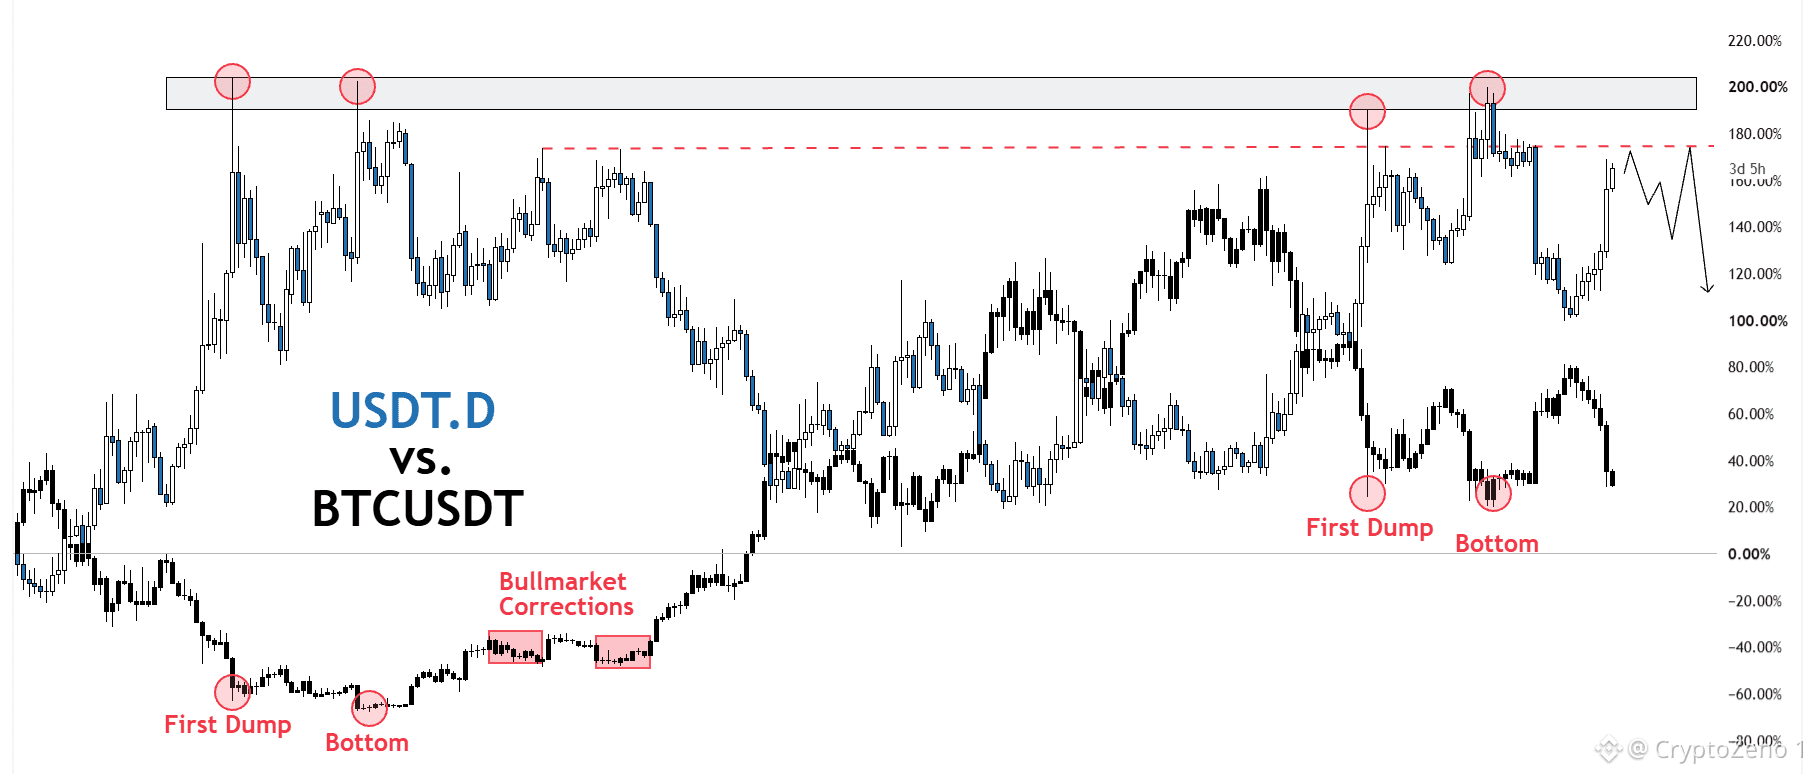
$BTC This might be the most important chart right now.
Comparing USDT dominance with BTC's price action during the last transition from a bear to a bull market reveals something interesting.
In both cycles, USDT.D reached the same zone during the initial selloff and again during the final dump that formed the bottom.
But here's where it gets interesting.
During the 2023 bull market, USDT.D spiked three more times as BTC went through major corrections.
Yet not a single one of those spikes brought Tether dominance back into the grey zone.
We're seeing something similar in the current cycle.
Even after the current 30% correction, USDT.D remains below the levels reached during the initial selloff and the bottoming phase.
In fact, we're currently sitting just below the highs of those USDT.D spikes from the previous cycle, which further supports the idea that this is a normal bull market correction.
To me, that's another sign that the bottom is already behind us.
What we're experiencing right now might simply be a very scary correction in an already established bull market.
#BTC Price Analysis# #Macro Insights#
$BTC This might be the most important chart right now.
Comparing USDT dominance with BTC's price action during the last transition from a bear to a bull market reveals something interesting.
In both cycles, USDT.D reached the same zone during the initial selloff and again during the final dump that formed the bottom.
But here's where it gets interesting.
During the 2023 bull market, USDT.D spiked three more times as BTC went through major corrections.
Yet not a single one of those spikes brought Tether dominance back into the grey zone.
We're seeing something similar in the current cycle.
Even after the current 30% correction, USDT.D remains below the levels reached during the initial selloff and the bottoming phase.
In fact, we're currently sitting just below the highs of those USDT.D spikes from the previous cycle, which further supports the idea that this is a normal bull market correction.
To me, that's another sign that the bottom is already behind us.
What we're experiencing right now might simply be a very scary correction in an already established bull market.
#BTC Price Analysis# #Macro Insights#
Comparing USDT dominance with BTC's price action during the last transition from a bear to a bull market reveals something interesting.
In both cycles, USDT.D reached the same zone during the initial selloff and again during the final dump that formed the bottom.
But here's where it gets interesting.
During the 2023 bull market, USDT.D spiked three more times as BTC went through major corrections.
Yet not a single one of those spikes brought Tether dominance back into the grey zone.
We're seeing something similar in the current cycle.
Even after the current 30% correction, USDT.D remains below the levels reached during the initial selloff and the bottoming phase.
In fact, we're currently sitting just below the highs of those USDT.D spikes from the previous cycle, which further supports the idea that this is a normal bull market correction.
To me, that's another sign that the bottom is already behind us.
What we're experiencing right now might simply be a very scary correction in an already established bull market.
#BTC Price Analysis# #Macro Insights#
52
·
--
Lihat terjemahan
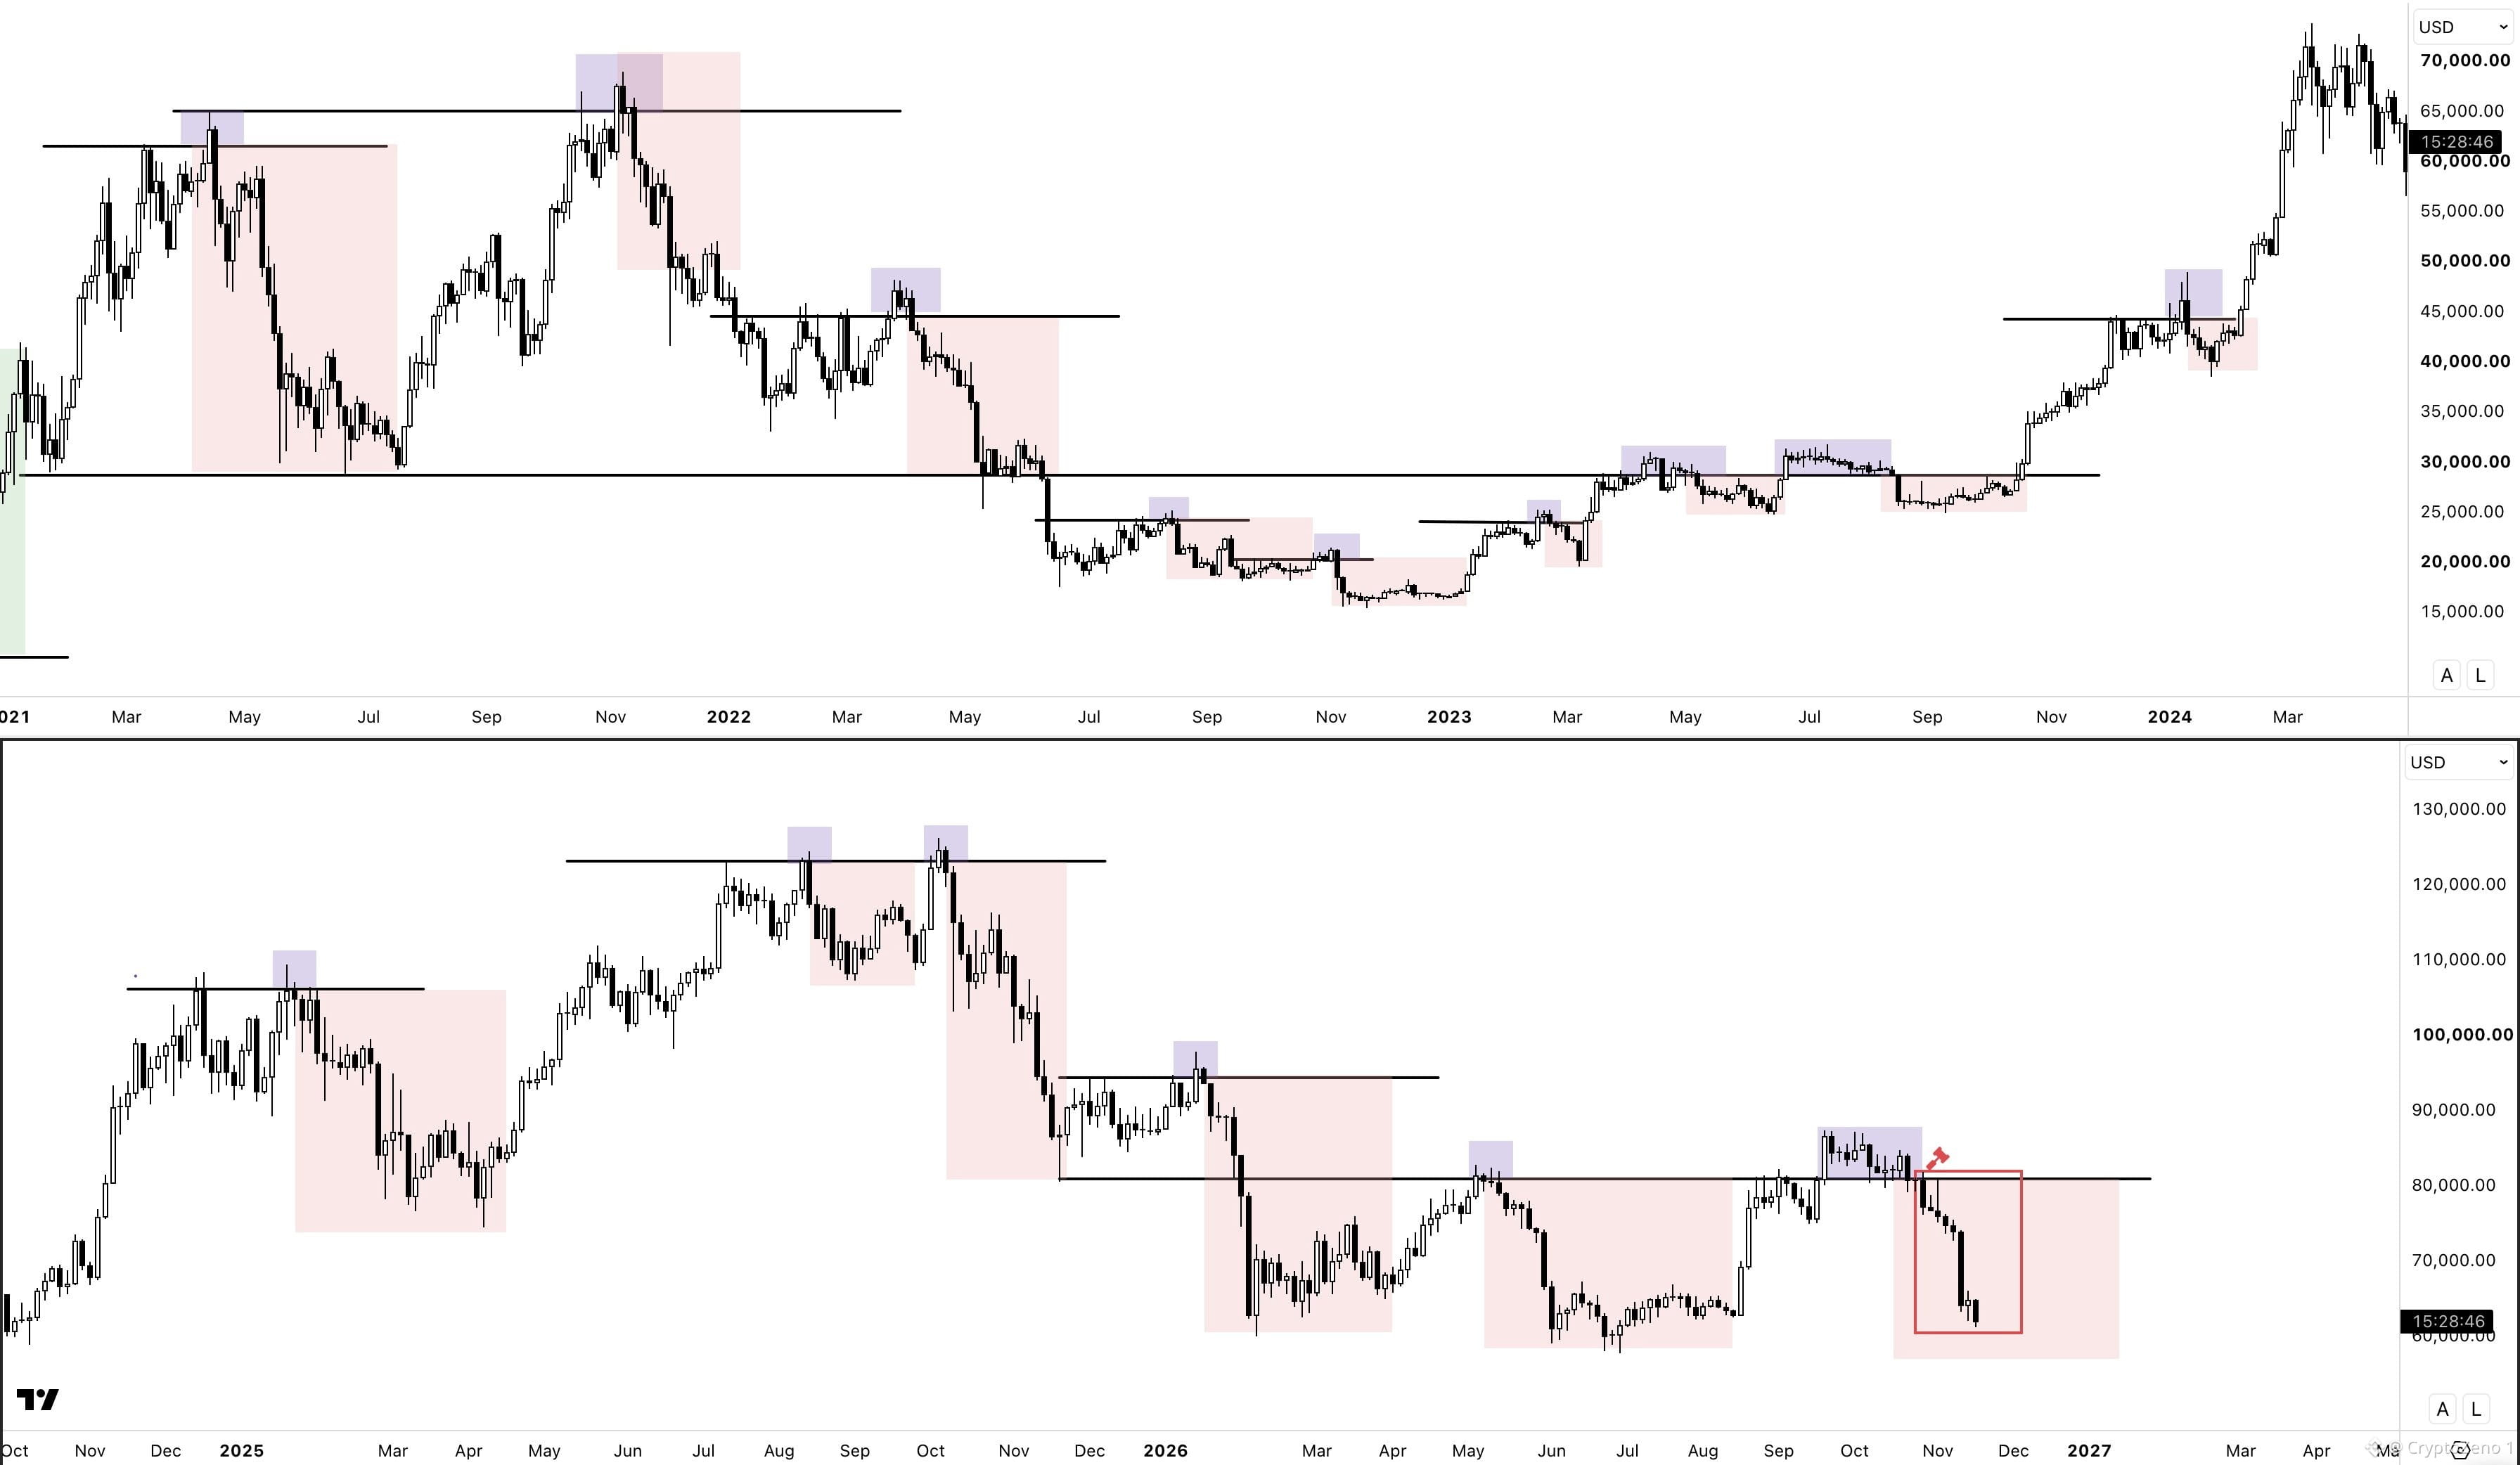
$BTC This might be the most important chart right now.
Comparing USDT dominance with BTC's price action during the last transition from a bear to a bull market reveals something interesting.
In both cycles, USDT.D reached the same zone during the initial selloff and again during the final dump that formed the bottom.
But here's where it gets interesting.
During the 2023 bull market, USDT.D spiked three more times as BTC went through major corrections.
Yet not a single one of those spikes brought Tether dominance back into the grey zone.
We're seeing something similar in the current cycle.
Even after the current 30% correction, USDT.D remains below the levels reached during the initial selloff and the bottoming phase.
In fact, we're currently sitting just below the highs of those USDT.D spikes from the previous cycle, which further supports the idea that this is a normal bull market correction.
To me, that's another sign that the bottom is already behind us.
What we're experiencing right now might simply be a very scary correction in an already established bull market. #BTC Price Analysis# #Macro Insights#
$BTC This might be the most important chart right now.
Comparing USDT dominance with BTC's price action during the last transition from a bear to a bull market reveals something interesting.
In both cycles, USDT.D reached the same zone during the initial selloff and again during the final dump that formed the bottom.
But here's where it gets interesting.
During the 2023 bull market, USDT.D spiked three more times as BTC went through major corrections.
Yet not a single one of those spikes brought Tether dominance back into the grey zone.
We're seeing something similar in the current cycle.
Even after the current 30% correction, USDT.D remains below the levels reached during the initial selloff and the bottoming phase.
In fact, we're currently sitting just below the highs of those USDT.D spikes from the previous cycle, which further supports the idea that this is a normal bull market correction.
To me, that's another sign that the bottom is already behind us.
What we're experiencing right now might simply be a very scary correction in an already established bull market. #BTC Price Analysis# #Macro Insights#
Comparing USDT dominance with BTC's price action during the last transition from a bear to a bull market reveals something interesting.
In both cycles, USDT.D reached the same zone during the initial selloff and again during the final dump that formed the bottom.
But here's where it gets interesting.
During the 2023 bull market, USDT.D spiked three more times as BTC went through major corrections.
Yet not a single one of those spikes brought Tether dominance back into the grey zone.
We're seeing something similar in the current cycle.
Even after the current 30% correction, USDT.D remains below the levels reached during the initial selloff and the bottoming phase.
In fact, we're currently sitting just below the highs of those USDT.D spikes from the previous cycle, which further supports the idea that this is a normal bull market correction.
To me, that's another sign that the bottom is already behind us.
What we're experiencing right now might simply be a very scary correction in an already established bull market. #BTC Price Analysis# #Macro Insights#
50
·
--
Lihat terjemahan
$BTC
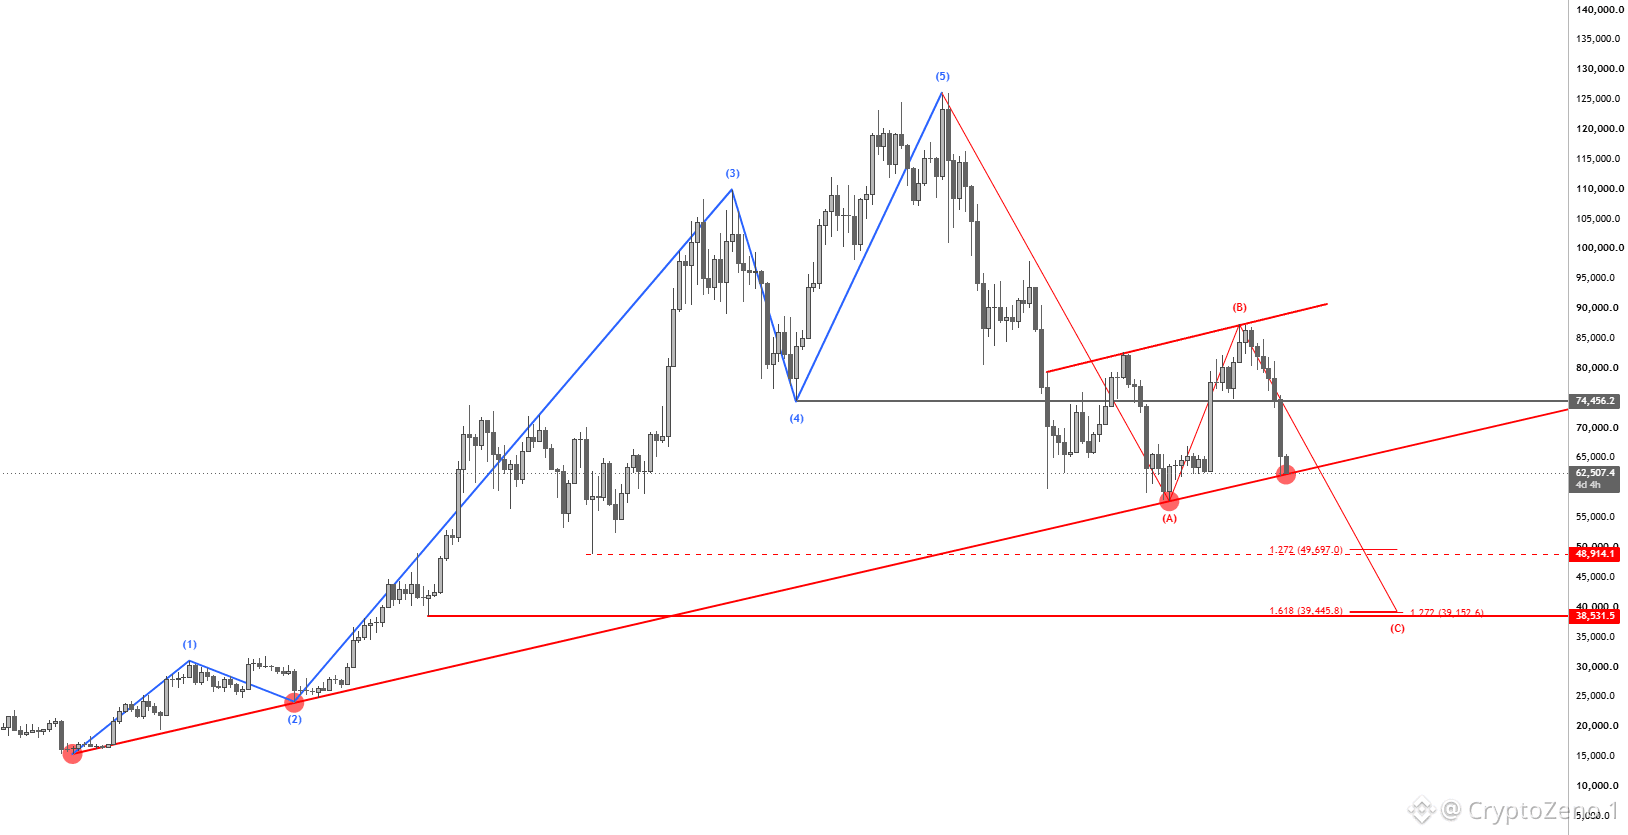
We're either going to bounce from this Trendline and Mark Wave 2, or we'll tap the Correction Wave C targets before Reversing Back Up.
The First Target for Wave C sits at 48k, with the second around 39k.
One thing to keep in mind is that the lower we go, the stronger the next impulse will be.
Meaning that if we do end up in that 40k-30k region, then the next ATH could easily be above 200k in the upcoming years.
That's a 2x even from current prices.
So while it might be painful in the short term, the long-term reward of capitalizing on that opportunity will be significantly higher.
I'm still sitting with 50% cash and ready to deploy if we see those prices. #BTC Price Analysis# #Macro Insights#
$BTC
We're either going to bounce from this Trendline and Mark Wave 2, or we'll tap the Correction Wave C targets before Reversing Back Up.
The First Target for Wave C sits at 48k, with the second around 39k.
One thing to keep in mind is that the lower we go, the stronger the next impulse will be.
Meaning that if we do end up in that 40k-30k region, then the next ATH could easily be above 200k in the upcoming years.
That's a 2x even from current prices.
So while it might be painful in the short term, the long-term reward of capitalizing on that opportunity will be significantly higher.
I'm still sitting with 50% cash and ready to deploy if we see those prices. #BTC Price Analysis# #Macro Insights#
We're either going to bounce from this Trendline and Mark Wave 2, or we'll tap the Correction Wave C targets before Reversing Back Up.
The First Target for Wave C sits at 48k, with the second around 39k.
One thing to keep in mind is that the lower we go, the stronger the next impulse will be.
Meaning that if we do end up in that 40k-30k region, then the next ATH could easily be above 200k in the upcoming years.
That's a 2x even from current prices.
So while it might be painful in the short term, the long-term reward of capitalizing on that opportunity will be significantly higher.
I'm still sitting with 50% cash and ready to deploy if we see those prices. #BTC Price Analysis# #Macro Insights#
83
·
--
Lihat terjemahan
$BTC
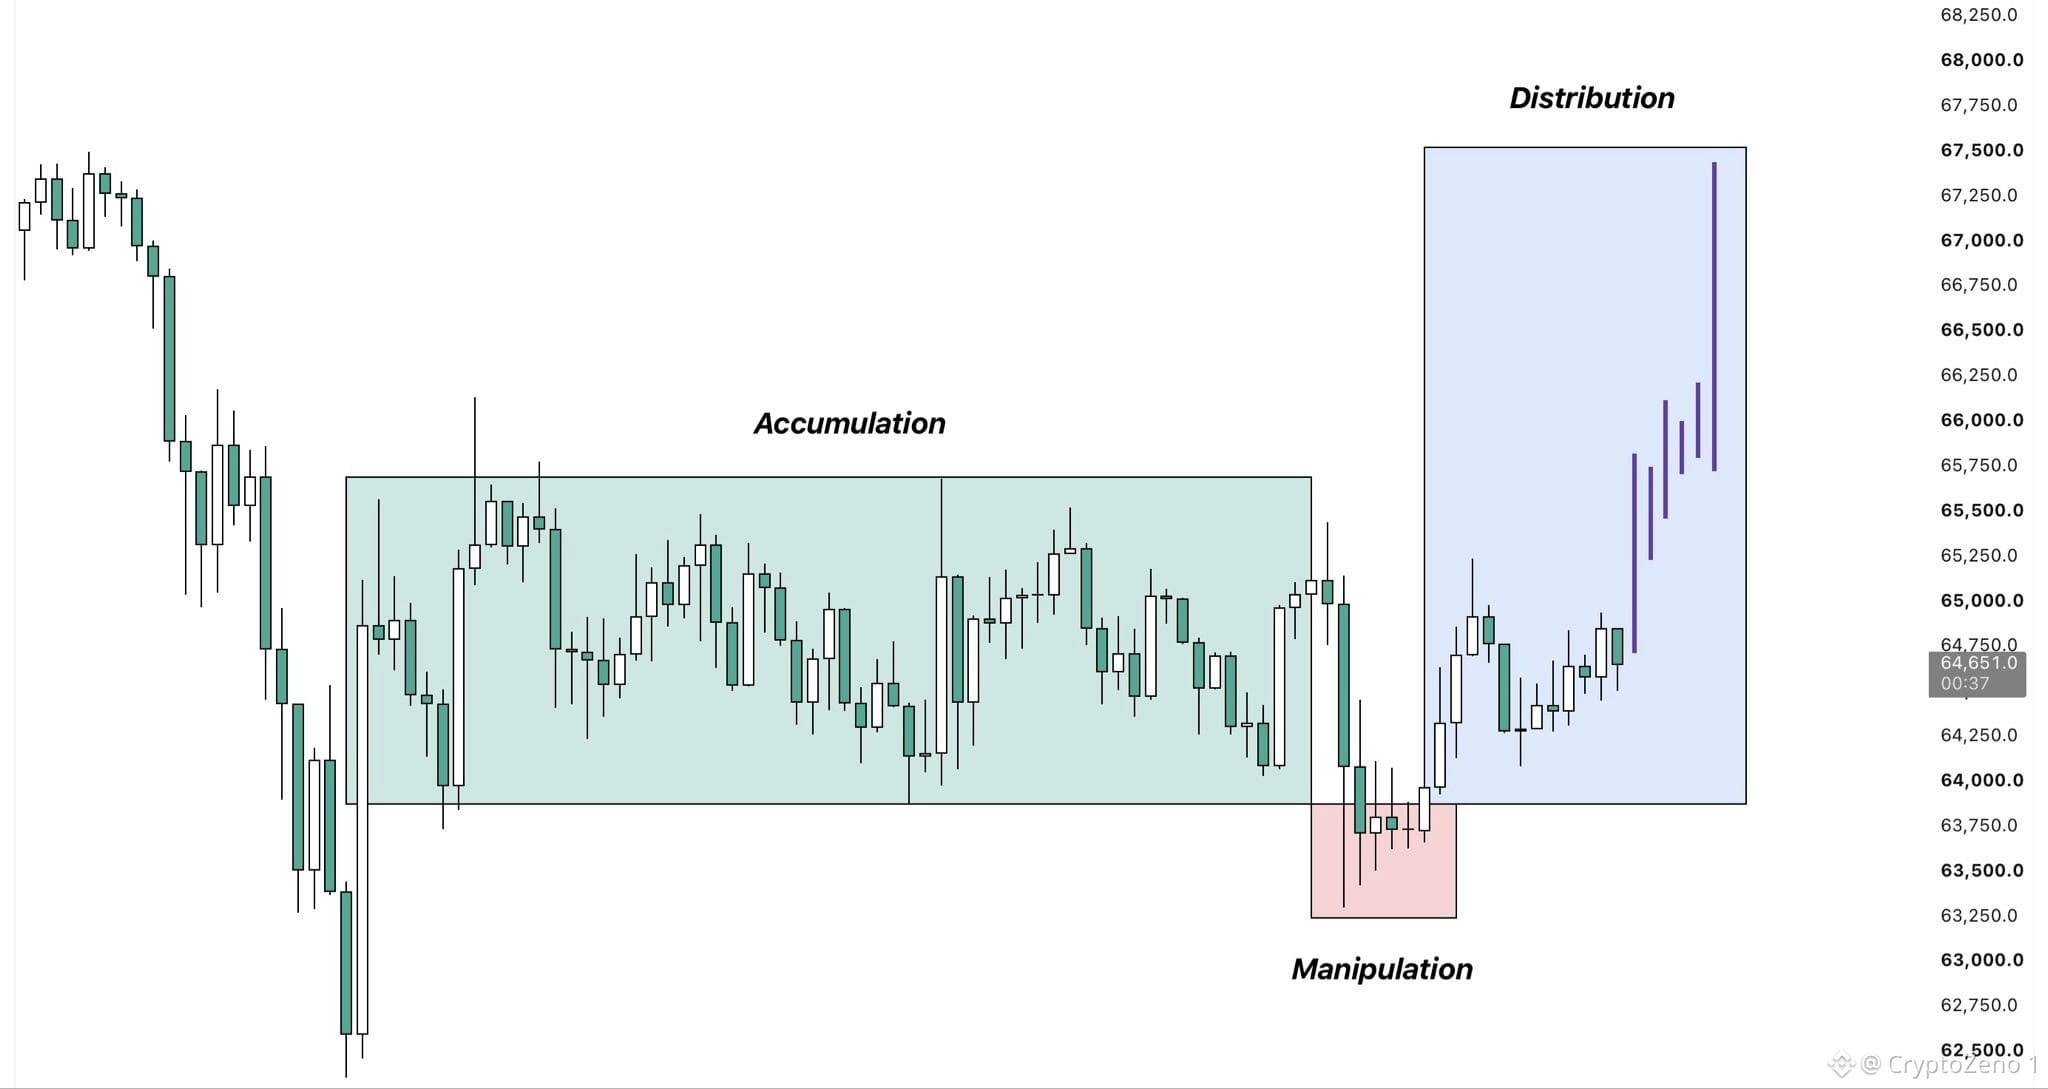
Looks like a classic PO3 in the making.
After the recent selloff, BTC spent the past few days forming an accumulation range before briefly deviating below the lows yesterday, potentially marking the manipulation phase of this pattern.
Price then then quickly reclaimed the range afterwards and has since started moving back to the upside.
If we now take a look at the corresponding data behind this move, we can see that it actually supports this thesis as well, as spot CVD has been rising noticeably throughout this range, suggesting that people have started accumulating again.
If this setup continues to play out, the next phase should be distribution, which would make the range highs the first obvious target. #BTC Price Analysis# #Macro Insights#
$BTC
Looks like a classic PO3 in the making.
After the recent selloff, BTC spent the past few days forming an accumulation range before briefly deviating below the lows yesterday, potentially marking the manipulation phase of this pattern.
Price then then quickly reclaimed the range afterwards and has since started moving back to the upside.
If we now take a look at the corresponding data behind this move, we can see that it actually supports this thesis as well, as spot CVD has been rising noticeably throughout this range, suggesting that people have started accumulating again.
If this setup continues to play out, the next phase should be distribution, which would make the range highs the first obvious target. #BTC Price Analysis# #Macro Insights#
Looks like a classic PO3 in the making.
After the recent selloff, BTC spent the past few days forming an accumulation range before briefly deviating below the lows yesterday, potentially marking the manipulation phase of this pattern.
Price then then quickly reclaimed the range afterwards and has since started moving back to the upside.
If we now take a look at the corresponding data behind this move, we can see that it actually supports this thesis as well, as spot CVD has been rising noticeably throughout this range, suggesting that people have started accumulating again.
If this setup continues to play out, the next phase should be distribution, which would make the range highs the first obvious target. #BTC Price Analysis# #Macro Insights#
54
·
--
Lihat terjemahan
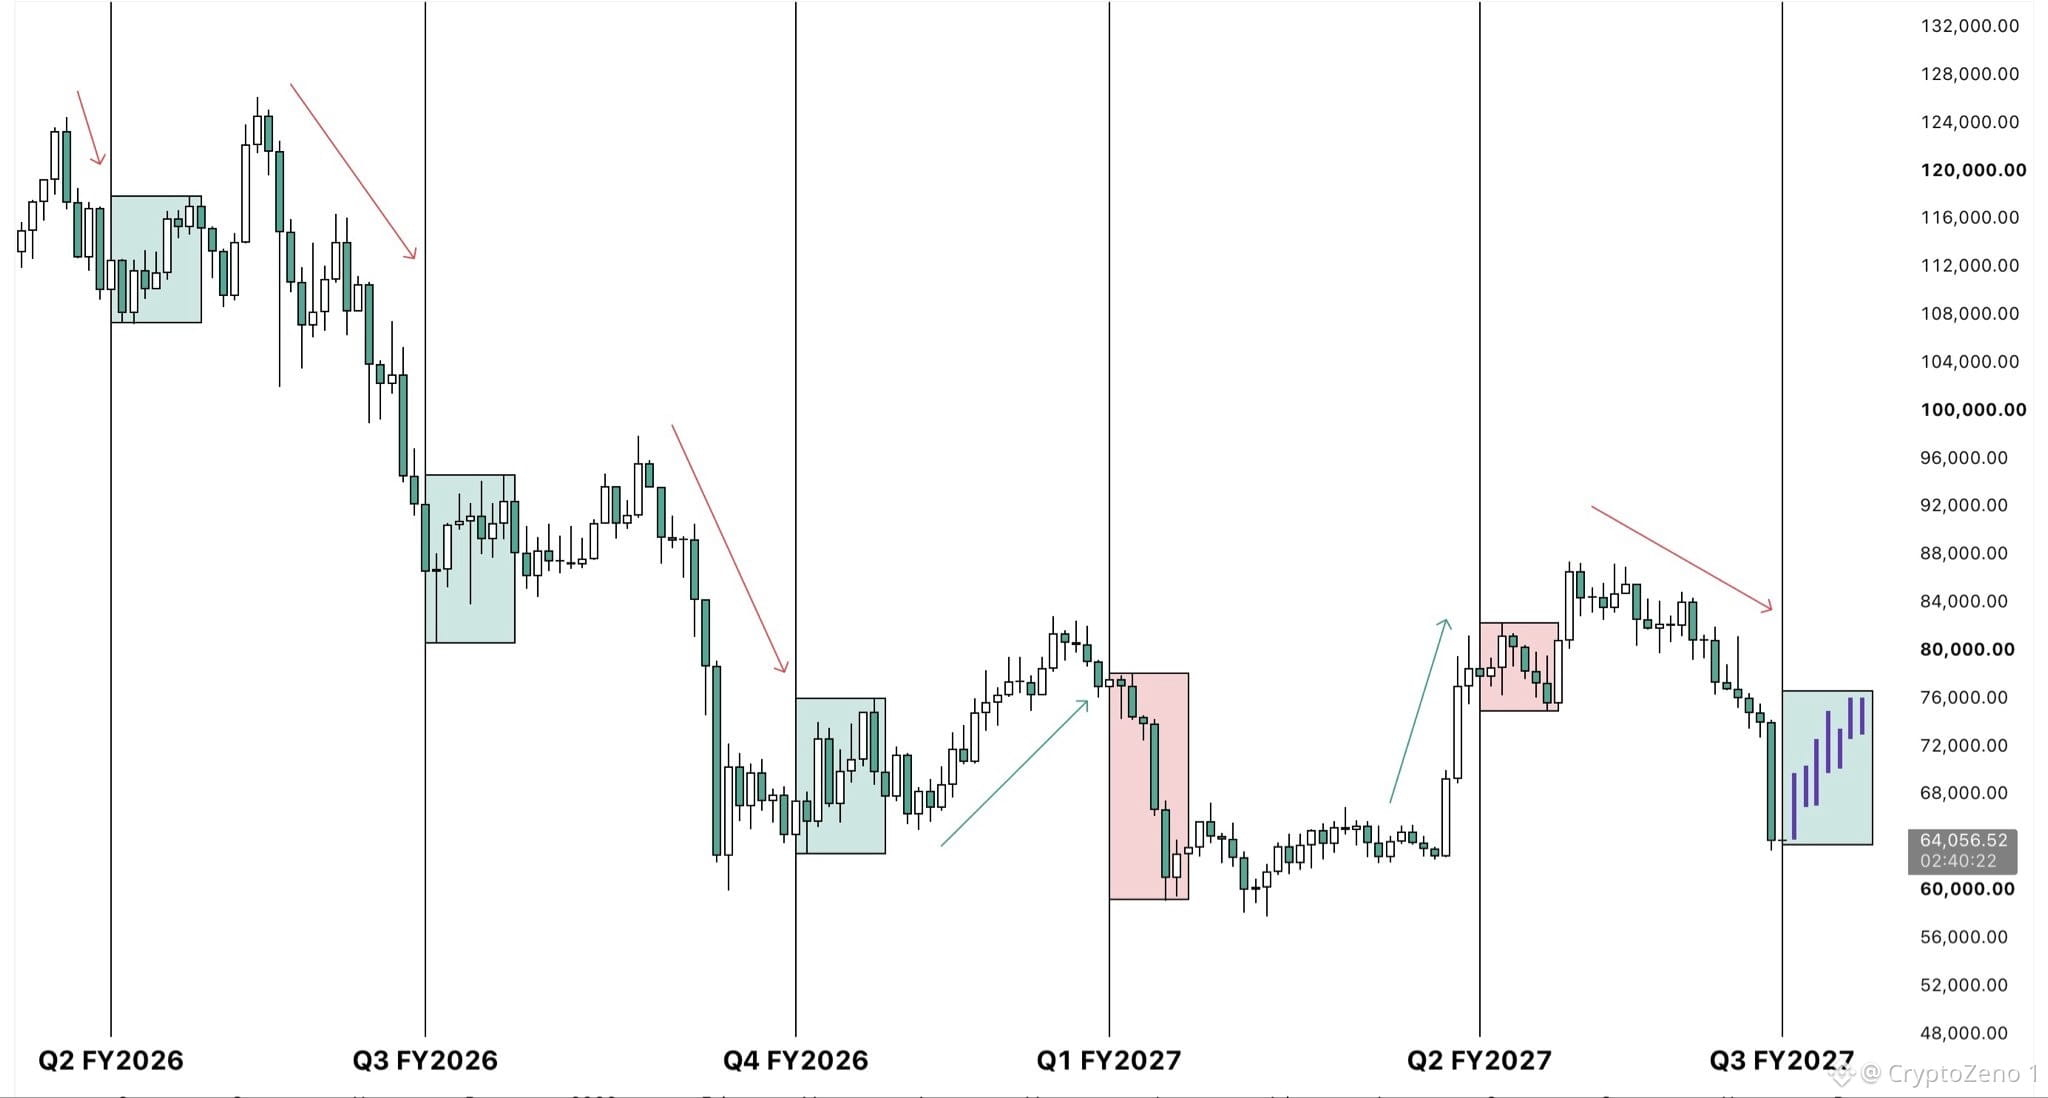
$BTC Interesting. Looking at the past few NVIDIA earnings calls, I noticed a pretty clear pattern.
The move leading into the event has repeatedly had a tendency of getting reversed shortly after.
Whenever BTC rallied into earnings, price moved lower afterwards, while selloffs ahead of the event were followed by a
move back to the upside.
Considering how aggressively BTC has been selling off ahead of today’s release, it will be interesting to see if this
pattern repeats once again.
If it does, we could finally see a decent relief bounce from here. #BTC Price Analysis# #Macro Insights#
$BTC Interesting. Looking at the past few NVIDIA earnings calls, I noticed a pretty clear pattern.
The move leading into the event has repeatedly had a tendency of getting reversed shortly after.
Whenever BTC rallied into earnings, price moved lower afterwards, while selloffs ahead of the event were followed by a
move back to the upside.
Considering how aggressively BTC has been selling off ahead of today’s release, it will be interesting to see if this
pattern repeats once again.
If it does, we could finally see a decent relief bounce from here. #BTC Price Analysis# #Macro Insights#
The move leading into the event has repeatedly had a tendency of getting reversed shortly after.
Whenever BTC rallied into earnings, price moved lower afterwards, while selloffs ahead of the event were followed by a
move back to the upside.
Considering how aggressively BTC has been selling off ahead of today’s release, it will be interesting to see if this
pattern repeats once again.
If it does, we could finally see a decent relief bounce from here. #BTC Price Analysis# #Macro Insights#
64
·
--
Lihat terjemahan
$BTC
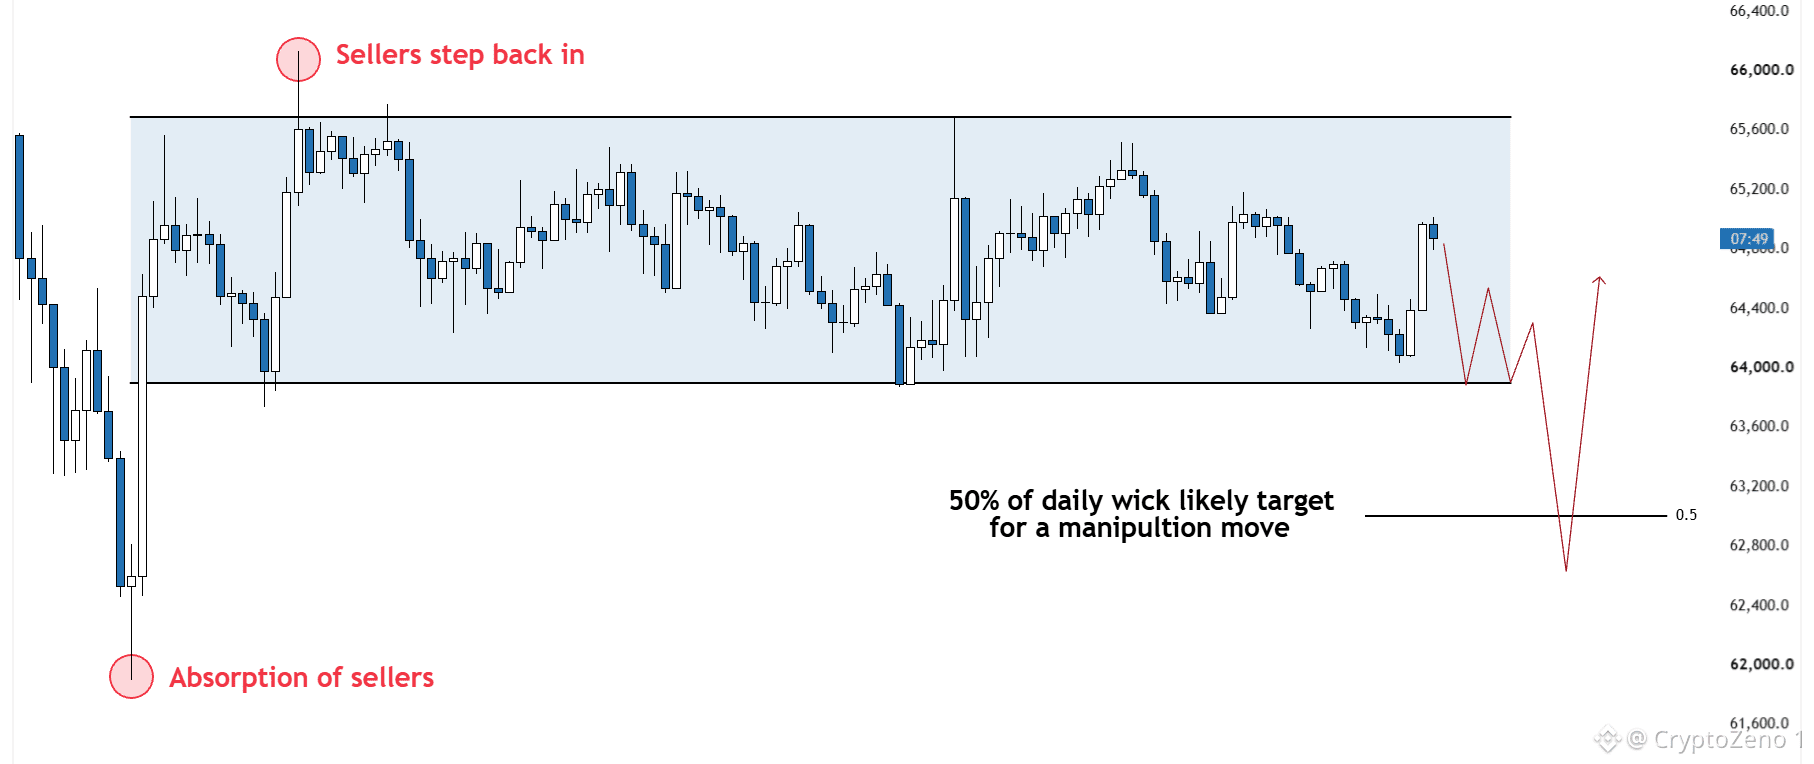
Be careful here.
Aggressive sellers were absorbed by passive buyers around $62K, resulting in a large daily wick.
Since then, BTC has been consolidating with strong bid support below, just as I outlined yesterday.
During ranges, fakeouts and liquidity sweeps are pretty common, especially when market sentiment is extremely emotional.
One possible scenario is a test of the 50% level of the daily wick.
Price often revisits areas where it moved quickly and relatively little trading took place, making that level an interesting target.
With that in mind, I'd be careful trading breakouts here. There's a good chance we see some deceptive price action before the next larger move. #BTC Price Analysis# #Macro Insights#
$BTC
Be careful here.
Aggressive sellers were absorbed by passive buyers around $62K, resulting in a large daily wick.
Since then, BTC has been consolidating with strong bid support below, just as I outlined yesterday.
During ranges, fakeouts and liquidity sweeps are pretty common, especially when market sentiment is extremely emotional.
One possible scenario is a test of the 50% level of the daily wick.
Price often revisits areas where it moved quickly and relatively little trading took place, making that level an interesting target.
With that in mind, I'd be careful trading breakouts here. There's a good chance we see some deceptive price action before the next larger move. #BTC Price Analysis# #Macro Insights#
Be careful here.
Aggressive sellers were absorbed by passive buyers around $62K, resulting in a large daily wick.
Since then, BTC has been consolidating with strong bid support below, just as I outlined yesterday.
During ranges, fakeouts and liquidity sweeps are pretty common, especially when market sentiment is extremely emotional.
One possible scenario is a test of the 50% level of the daily wick.
Price often revisits areas where it moved quickly and relatively little trading took place, making that level an interesting target.
With that in mind, I'd be careful trading breakouts here. There's a good chance we see some deceptive price action before the next larger move. #BTC Price Analysis# #Macro Insights#
50
·
--
Lihat terjemahan
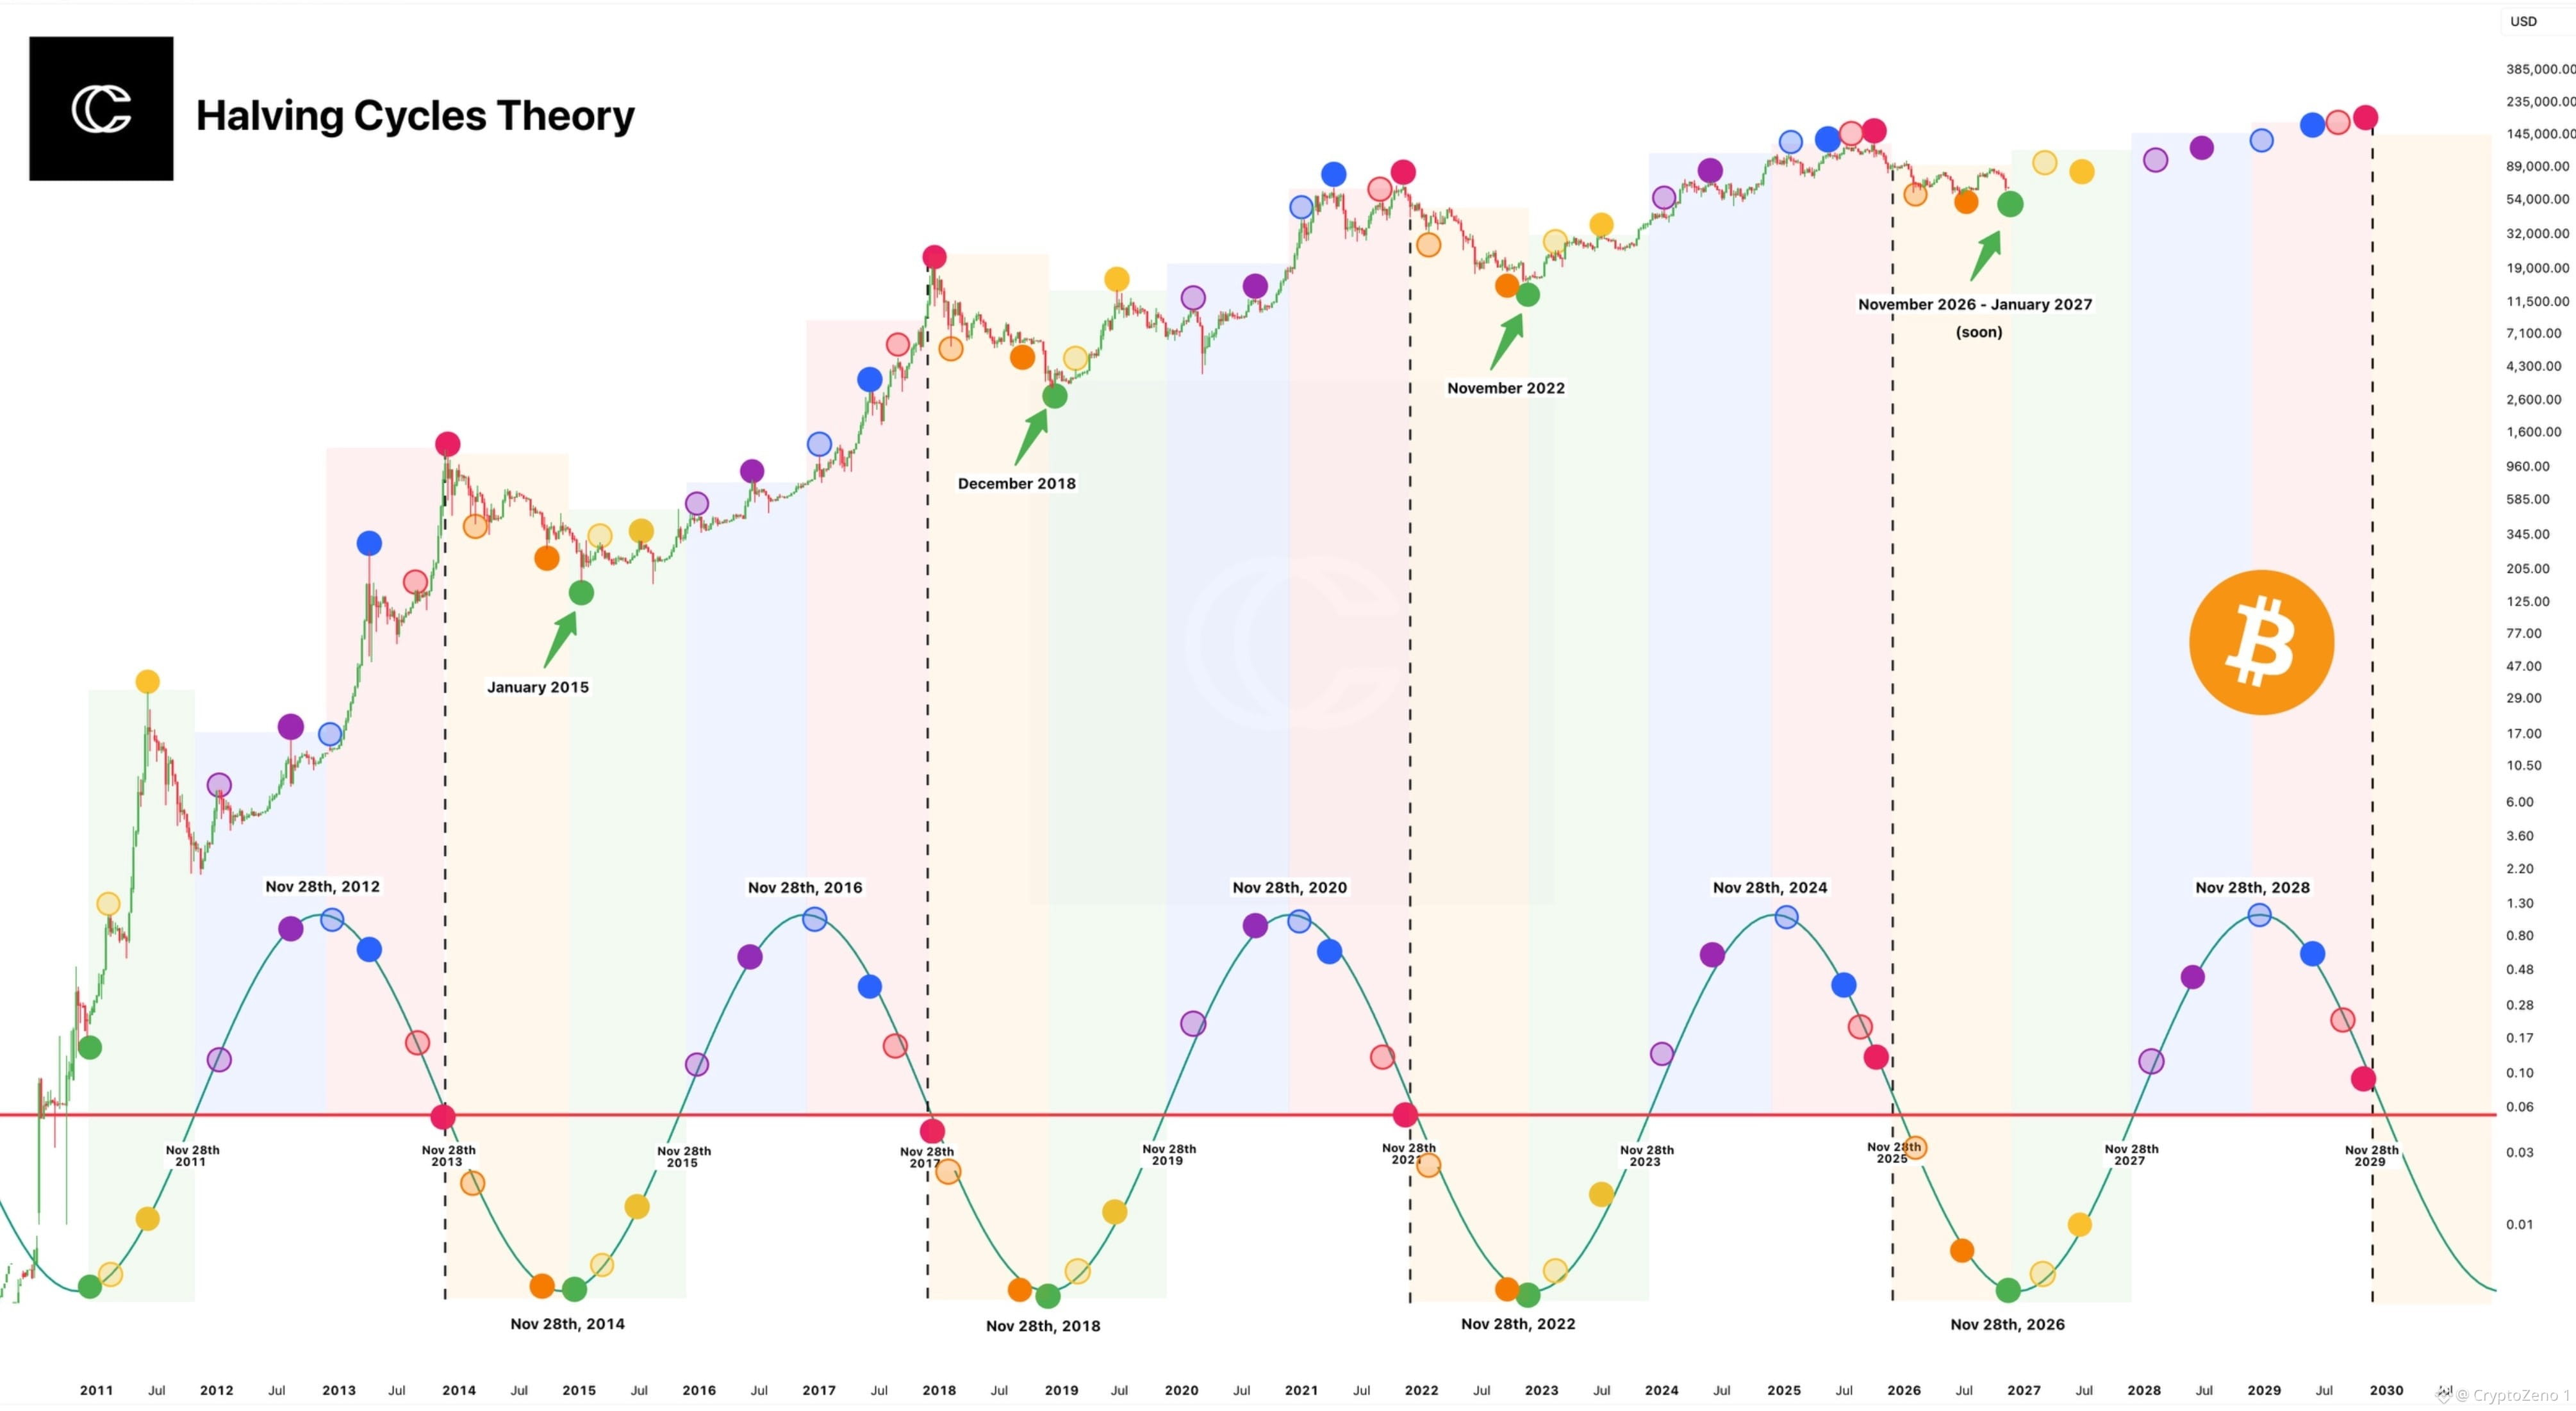
🚨 $BTC 4-YEAR HALVING CYCLE IS APPROACHING A CRITICAL TURNING POINT! Bitcoin historical price structure continues to reveal a striking pattern around its four-year halving cycles. Since 2012, major market peaks have repeatedly been followed by prolonged corrections, accumulation phases and powerful recoveries. The 2014, 2018 and 2022 bear market bottoms all emerged within a remarkably similar cycle structure. The most important window now is November 2026 to January 2027. According to this historical cycle model, Bitcoin could be approaching another major bottoming phase, potentially marking the transition from bearish pressure into long-term accumulation. The timing closely mirrors previous post-halving corrections, although the pattern is not guaranteed to repeat precisely. Looking further ahead, the November 28, 2028 halving could become the foundation for the next major expansion, with the model projecting a potential market peak around 2028–2029 before another cyclical downturn develops. The key takeaway is that Bitcoin may be moving through the most important transition of its current four-year cycle. If historical fractals remain relevant, 2026–2027 could define the accumulation window for the next major bull market. #BTC Price Analysis# #Macro Insights# #BNBChain#
🚨 $BTC 4-YEAR HALVING CYCLE IS APPROACHING A CRITICAL TURNING POINT! Bitcoin historical price structure continues to reveal a striking pattern around its four-year halving cycles. Since 2012, major market peaks have repeatedly been followed by prolonged corrections, accumulation phases and powerful recoveries. The 2014, 2018 and 2022 bear market bottoms all emerged within a remarkably similar cycle structure. The most important window now is November 2026 to January 2027. According to this historical cycle model, Bitcoin could be approaching another major bottoming phase, potentially marking the transition from bearish pressure into long-term accumulation. The timing closely mirrors previous post-halving corrections, although the pattern is not guaranteed to repeat precisely. Looking further ahead, the November 28, 2028 halving could become the foundation for the next major expansion, with the model projecting a potential market peak around 2028–2029 before another cyclical downturn develops. The key takeaway is that Bitcoin may be moving through the most important transition of its current four-year cycle. If historical fractals remain relevant, 2026–2027 could define the accumulation window for the next major bull market. #BTC Price Analysis# #Macro Insights# #BNBChain#
·
--
Lihat terjemahan
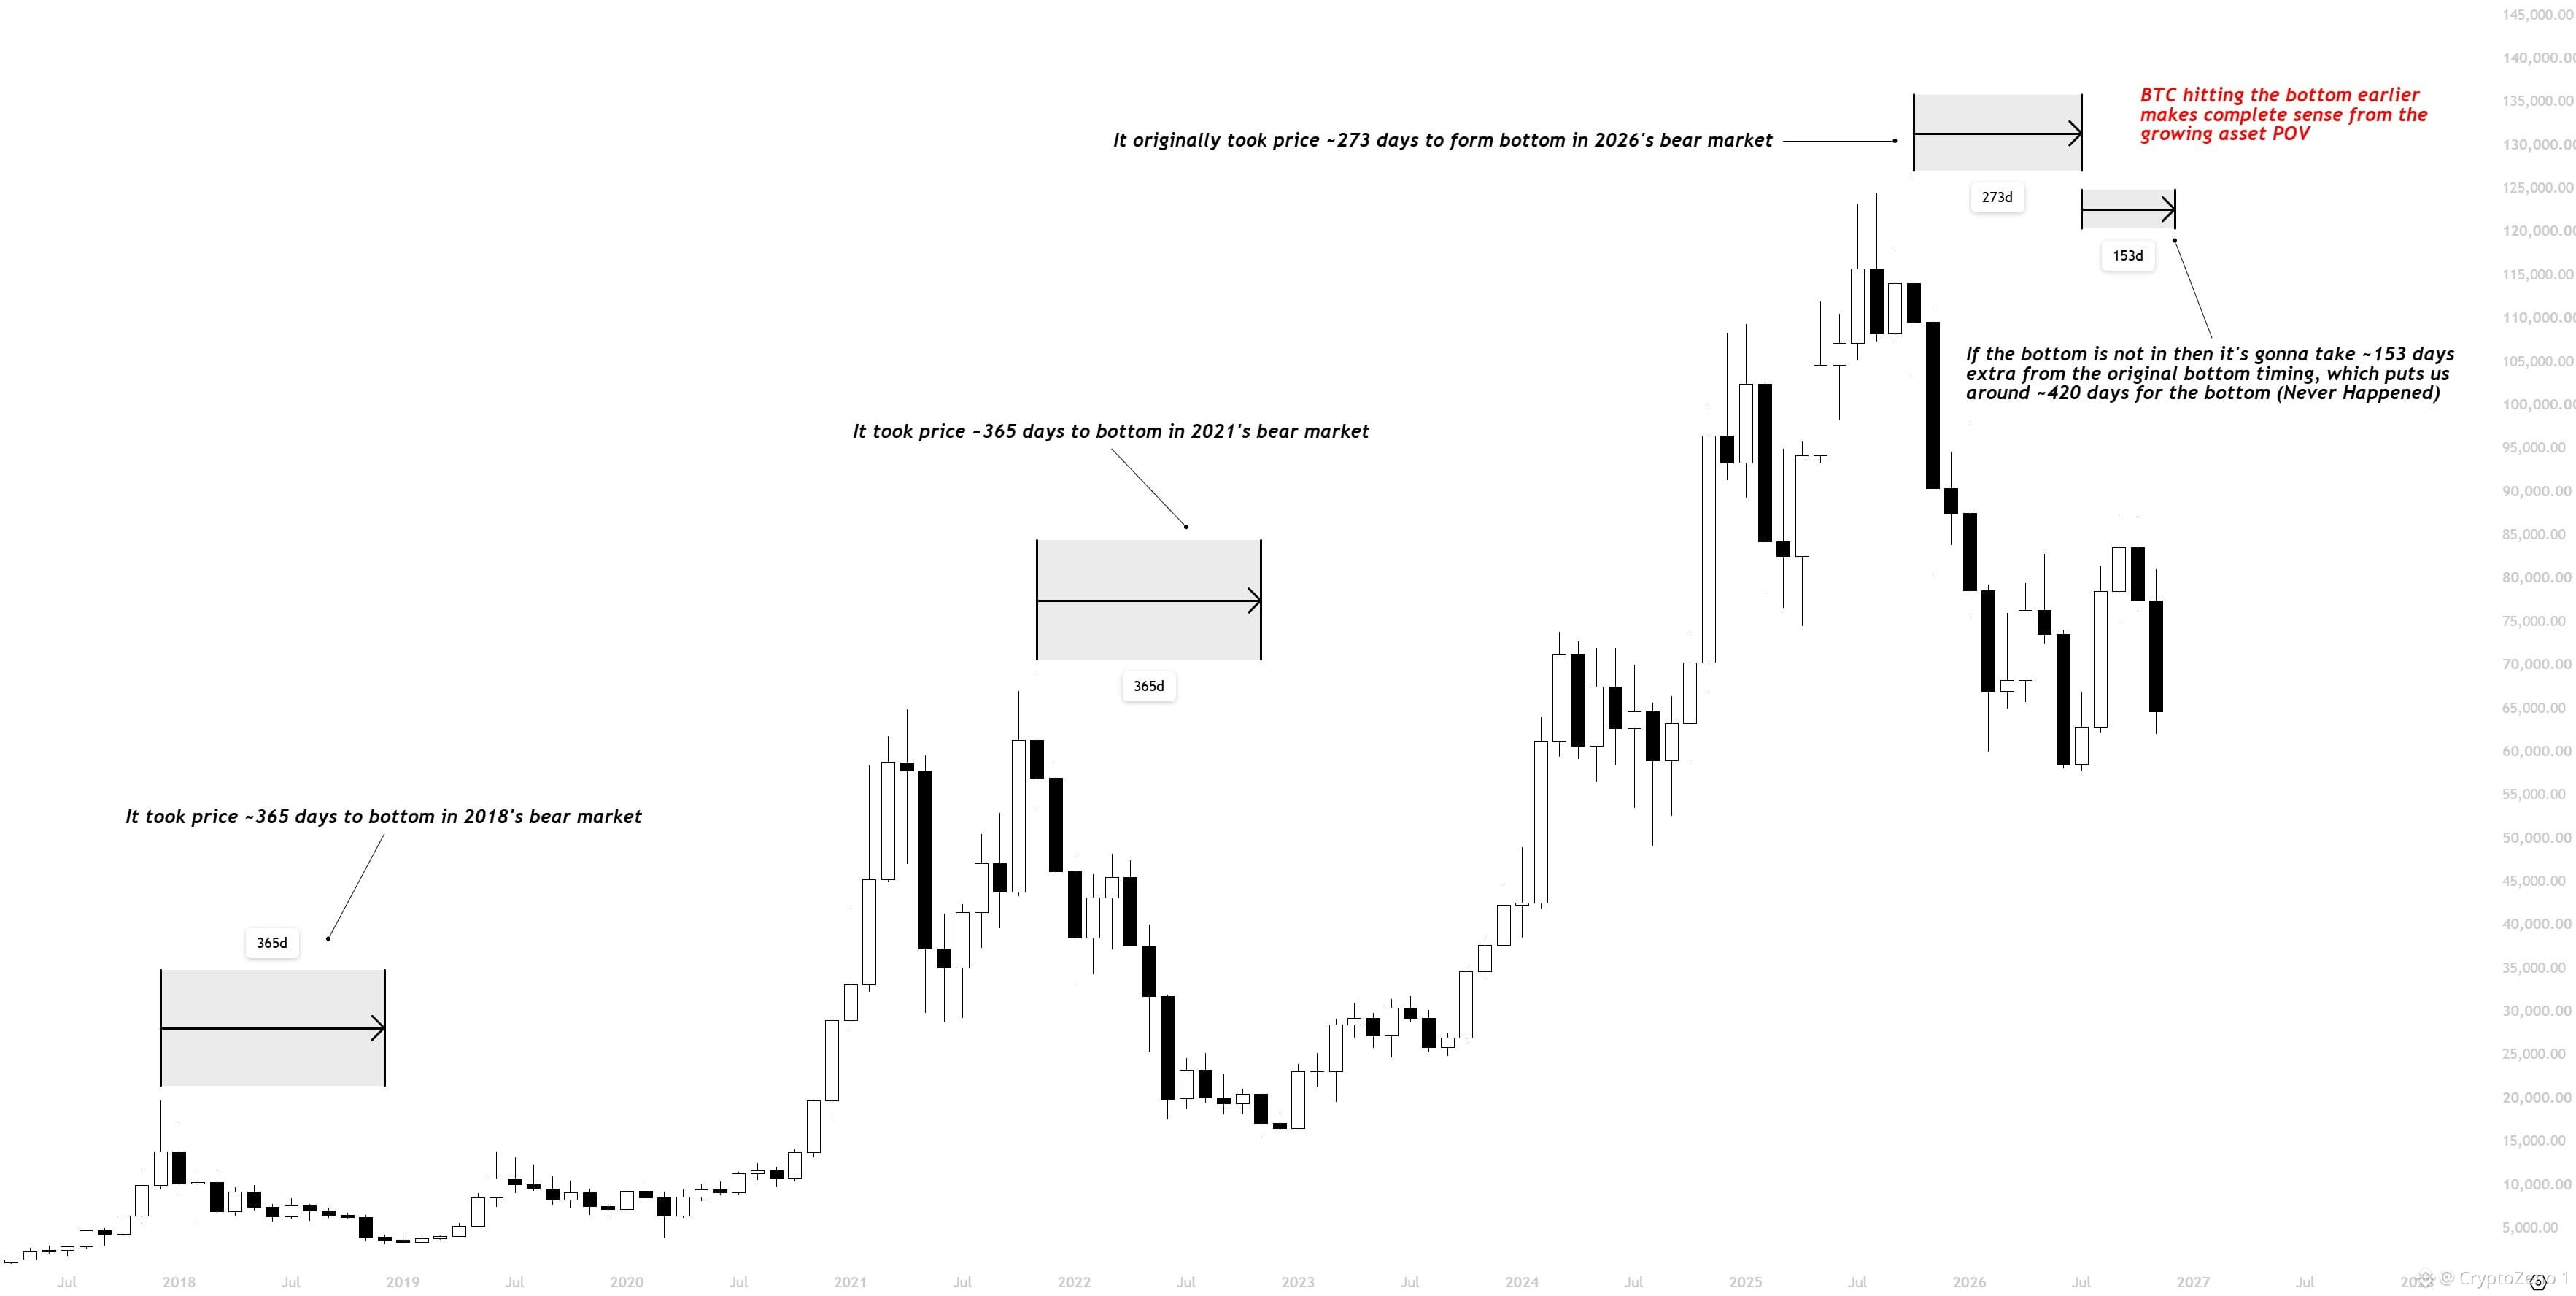
$BTC It took price ~365 days to bottom in both 2018's bear market and 2021's bear market,
Logically as the value/market cap of an asset grows the downside starts to get limited and the bottoms are in quicker than before.
Which means if price creates a new low following the original one around 57.7k then it's gonna be a complete anomaly seeing the historical timings.
I won't bet against the odds. #BTC Price Analysis# #Macro Insights#
$BTC It took price ~365 days to bottom in both 2018's bear market and 2021's bear market,
Logically as the value/market cap of an asset grows the downside starts to get limited and the bottoms are in quicker than before.
Which means if price creates a new low following the original one around 57.7k then it's gonna be a complete anomaly seeing the historical timings.
I won't bet against the odds. #BTC Price Analysis# #Macro Insights#
Logically as the value/market cap of an asset grows the downside starts to get limited and the bottoms are in quicker than before.
Which means if price creates a new low following the original one around 57.7k then it's gonna be a complete anomaly seeing the historical timings.
I won't bet against the odds. #BTC Price Analysis# #Macro Insights#
53
·
--
Lihat terjemahan
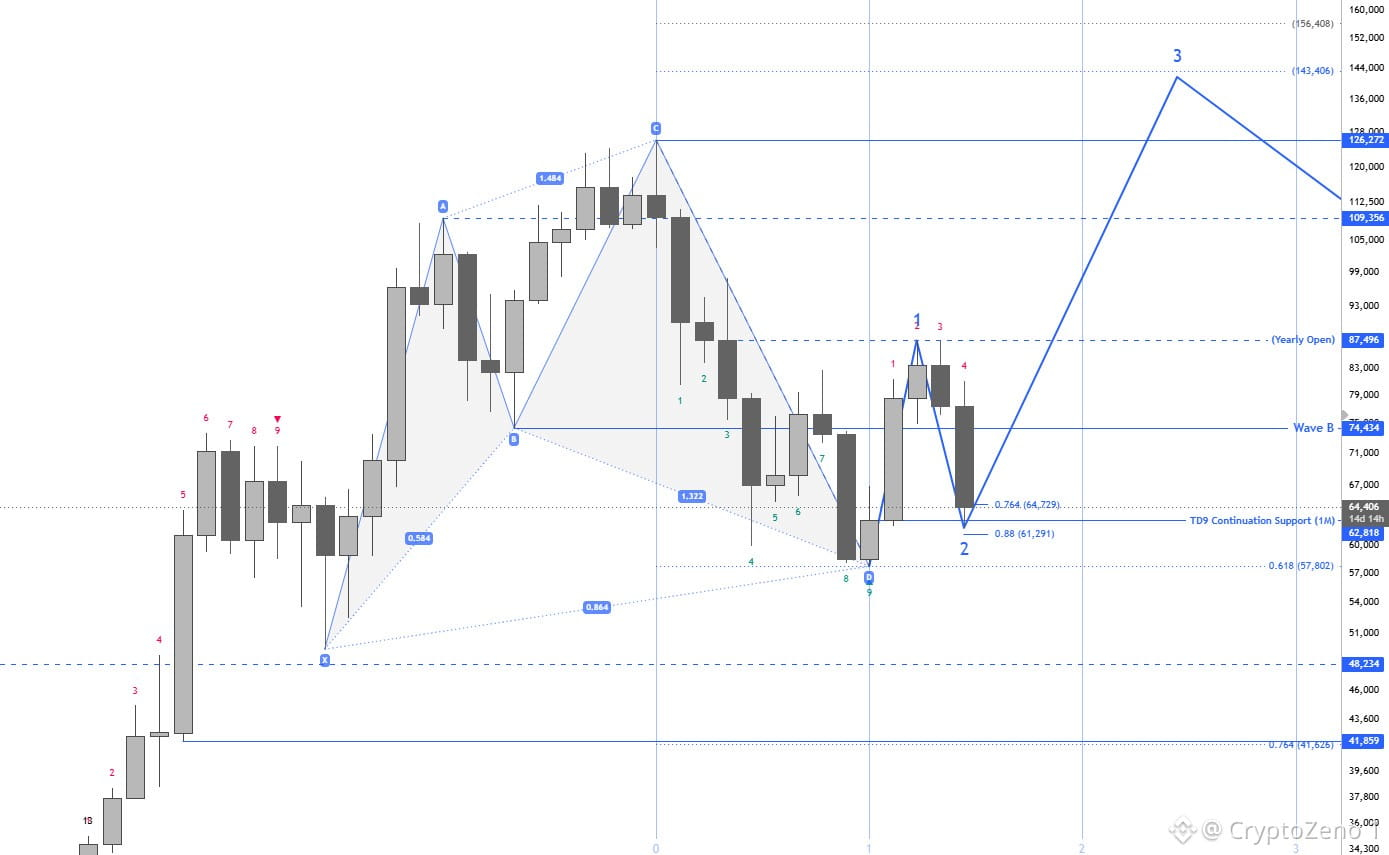
$BTC This move down has invalidated some of the historical fractals everyone was looking at, including myself. But that doesn't mean the bullish structure itself is invalidated.
Right now, We're inside Wave 2 & a bearish Setup Phase on the Monthly. The September close gave us a bullish CHoCH, and this move down so far is simply our bullish pullback.
What we want to see now is price holding the 62.8k region, where we've also seen a bounce for now. As long as we hold this level, The structure remains bullish on the Monthly.
For the Wave count, A true invalidation would be a break below 57.7k, which is our current low.
The LTF trend is showing signs of exhaustion here, and the key support to observe is the 64.1k-63.2k region.
Ideally, We want to see a bounce from this region at the start of the week, followed by a continuation towards the upside. #BTC Price Analysis# #Macro Insights#
$BTC This move down has invalidated some of the historical fractals everyone was looking at, including myself. But that doesn't mean the bullish structure itself is invalidated.
Right now, We're inside Wave 2 & a bearish Setup Phase on the Monthly. The September close gave us a bullish CHoCH, and this move down so far is simply our bullish pullback.
What we want to see now is price holding the 62.8k region, where we've also seen a bounce for now. As long as we hold this level, The structure remains bullish on the Monthly.
For the Wave count, A true invalidation would be a break below 57.7k, which is our current low.
The LTF trend is showing signs of exhaustion here, and the key support to observe is the 64.1k-63.2k region.
Ideally, We want to see a bounce from this region at the start of the week, followed by a continuation towards the upside. #BTC Price Analysis# #Macro Insights#
Right now, We're inside Wave 2 & a bearish Setup Phase on the Monthly. The September close gave us a bullish CHoCH, and this move down so far is simply our bullish pullback.
What we want to see now is price holding the 62.8k region, where we've also seen a bounce for now. As long as we hold this level, The structure remains bullish on the Monthly.
For the Wave count, A true invalidation would be a break below 57.7k, which is our current low.
The LTF trend is showing signs of exhaustion here, and the key support to observe is the 64.1k-63.2k region.
Ideally, We want to see a bounce from this region at the start of the week, followed by a continuation towards the upside. #BTC Price Analysis# #Macro Insights#
68
·
--
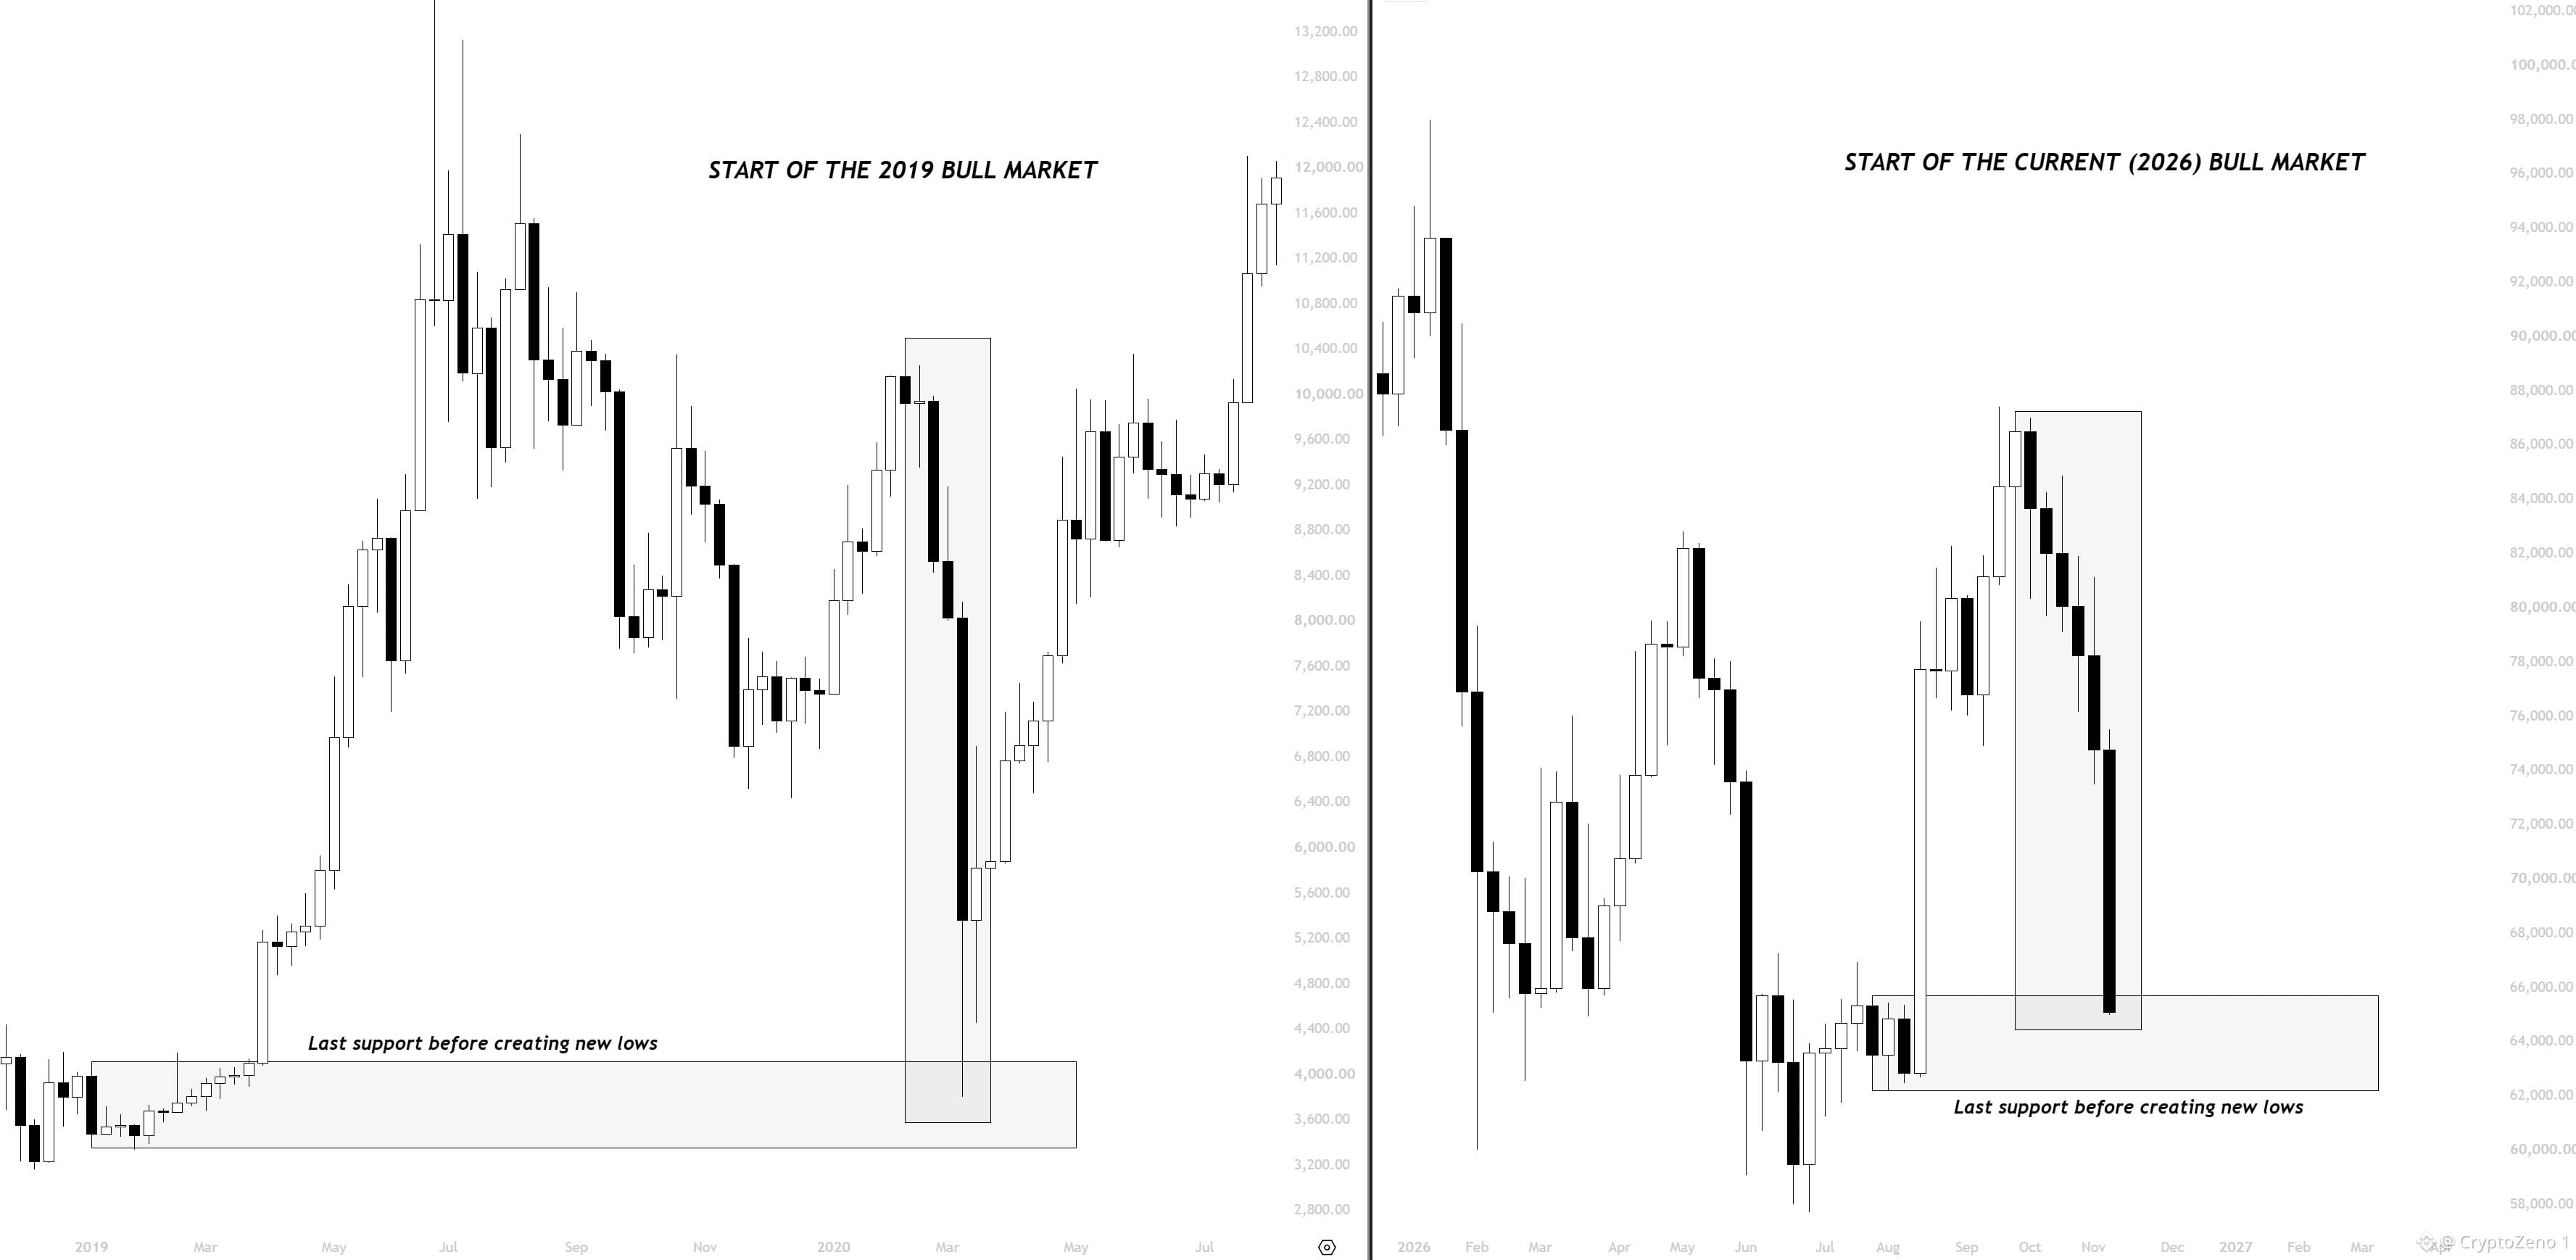
$BTC Harga sedang menguji zona support terakhir,
Jika kita melihat awal pasar bullish 2019, ada penurunan serupa sebelum harga naik menuju ATH.
Saat ini harga sedang menguji POC dari "rentang" yang kita bentuk di HTF,
Dan ini adalah zona terakhir tempat bull run masih berpeluang berlanjut.
Jika harga gagal bertahan di sini dan menembus ke bawah, harga tidak akan berhenti sampai kisaran 50 ribuan, tempat kita berpotensi membentuk titik terendah berikutnya. #Analisis Harga BTC# #Wawasan Makro#
$BTC Harga sedang menguji zona support terakhir,
Jika kita melihat awal pasar bullish 2019, ada penurunan serupa sebelum harga naik menuju ATH.
Saat ini harga sedang menguji POC dari "rentang" yang kita bentuk di HTF,
Dan ini adalah zona terakhir tempat bull run masih berpeluang berlanjut.
Jika harga gagal bertahan di sini dan menembus ke bawah, harga tidak akan berhenti sampai kisaran 50 ribuan, tempat kita berpotensi membentuk titik terendah berikutnya. #Analisis Harga BTC# #Wawasan Makro#
Jika kita melihat awal pasar bullish 2019, ada penurunan serupa sebelum harga naik menuju ATH.
Saat ini harga sedang menguji POC dari "rentang" yang kita bentuk di HTF,
Dan ini adalah zona terakhir tempat bull run masih berpeluang berlanjut.
Jika harga gagal bertahan di sini dan menembus ke bawah, harga tidak akan berhenti sampai kisaran 50 ribuan, tempat kita berpotensi membentuk titik terendah berikutnya. #Analisis Harga BTC# #Wawasan Makro#
49
·
--
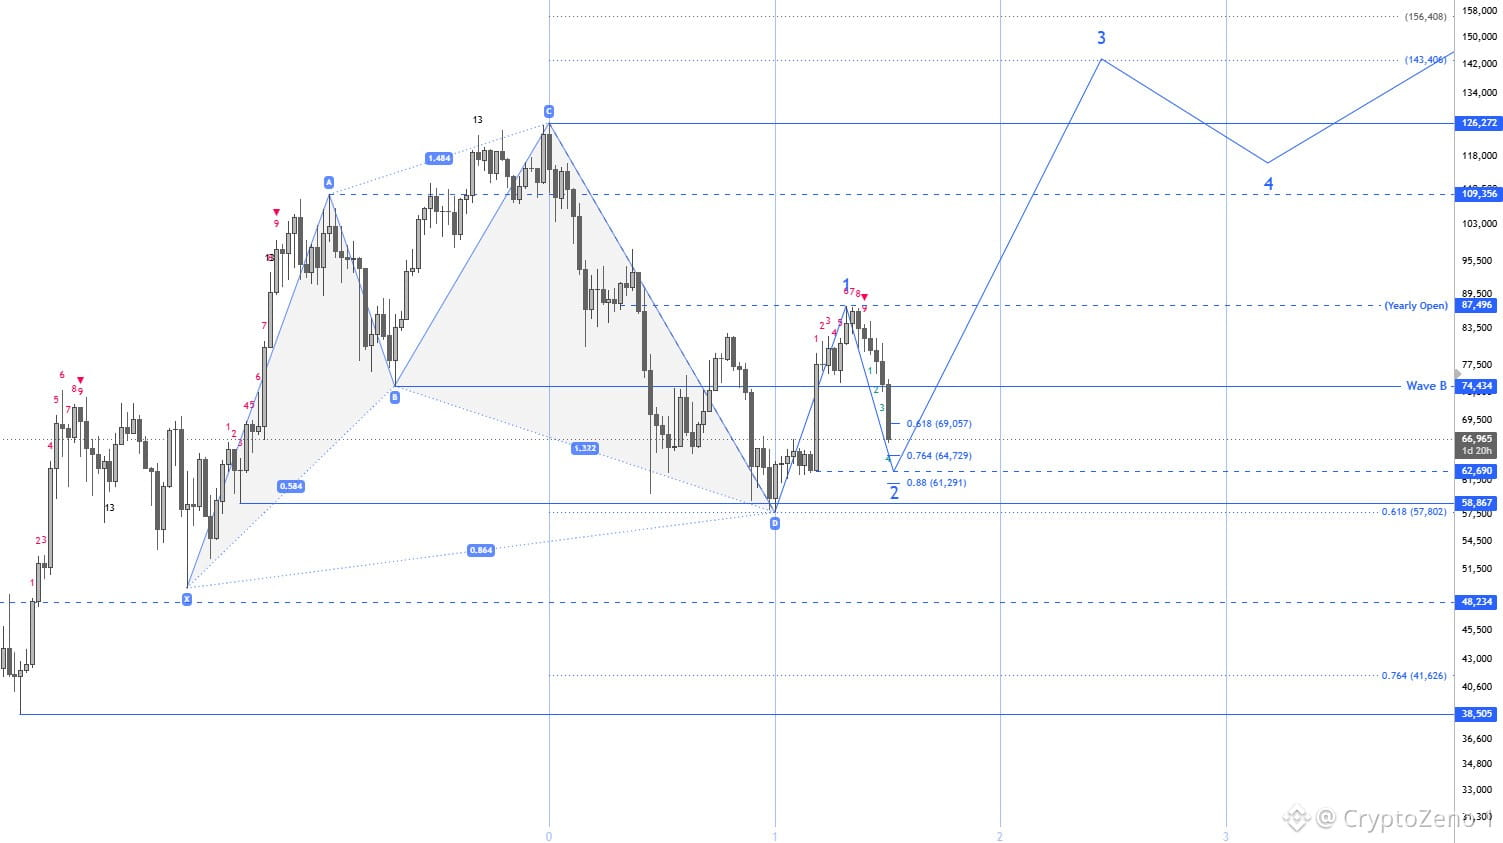
$BTC Spot ditutup dengan profit kecil, sekitar titik impas.
Tidak masalah, karena kemungkinan kita akan mendapatkan titik masuk yang lebih baik, dengan 62.6k sebagai area pertama yang saya perhatikan.
Secara teori, Wave 2 pada grafik mingguan tetap valid selama kita tidak menembus ke bawah Wave 1, dan zona support dengan konfluensi tinggi berikutnya untuk Wave 2 berada di sekitar 62.6k, yang kemungkinan menjadi tujuan kita berikutnya.
Jika level itu ditembus, hitungan Wave ini tidak lagi valid dan level berikutnya yang akan kita lihat adalah 48.2k, yang akan lebih baik lagi dari perspektif pembelian jangka panjang.
Untuk saat ini, saya sepenuhnya menepi, dan sejujurnya itu adalah berkah dalam kondisi pergerakan harga ini...
Tren sudah kehabisan tenaga, dan para bear berusaha sebaik mungkin untuk mencegah bull mengambil kendali selama mungkin.
Namun, kehabisan tenaga bukan berarti pembalikan arah terjadi seketika. Terkadang, kita bisa melihat ekor pelemahan yang brutal akibat kehabisan tenaga (aksi jual untuk keluar) sebelum titik terendah terbentuk. Sepertinya para bull sedang mengundangnya saat ini, karena sejauh ini mereka tidak menunjukkan tanda-tanda kekuatan.
Saya akan membagikan pembaruan lengkap pada hari Senin dengan prospek terbaru! #Analisis Harga BTC# #Wawasan Makro#
$BTC Spot ditutup dengan profit kecil, sekitar titik impas.
Tidak masalah, karena kemungkinan kita akan mendapatkan titik masuk yang lebih baik, dengan 62.6k sebagai area pertama yang saya perhatikan.
Secara teori, Wave 2 pada grafik mingguan tetap valid selama kita tidak menembus ke bawah Wave 1, dan zona support dengan konfluensi tinggi berikutnya untuk Wave 2 berada di sekitar 62.6k, yang kemungkinan menjadi tujuan kita berikutnya.
Jika level itu ditembus, hitungan Wave ini tidak lagi valid dan level berikutnya yang akan kita lihat adalah 48.2k, yang akan lebih baik lagi dari perspektif pembelian jangka panjang.
Untuk saat ini, saya sepenuhnya menepi, dan sejujurnya itu adalah berkah dalam kondisi pergerakan harga ini...
Tren sudah kehabisan tenaga, dan para bear berusaha sebaik mungkin untuk mencegah bull mengambil kendali selama mungkin.
Namun, kehabisan tenaga bukan berarti pembalikan arah terjadi seketika. Terkadang, kita bisa melihat ekor pelemahan yang brutal akibat kehabisan tenaga (aksi jual untuk keluar) sebelum titik terendah terbentuk. Sepertinya para bull sedang mengundangnya saat ini, karena sejauh ini mereka tidak menunjukkan tanda-tanda kekuatan.
Saya akan membagikan pembaruan lengkap pada hari Senin dengan prospek terbaru! #Analisis Harga BTC# #Wawasan Makro#
Tidak masalah, karena kemungkinan kita akan mendapatkan titik masuk yang lebih baik, dengan 62.6k sebagai area pertama yang saya perhatikan.
Secara teori, Wave 2 pada grafik mingguan tetap valid selama kita tidak menembus ke bawah Wave 1, dan zona support dengan konfluensi tinggi berikutnya untuk Wave 2 berada di sekitar 62.6k, yang kemungkinan menjadi tujuan kita berikutnya.
Jika level itu ditembus, hitungan Wave ini tidak lagi valid dan level berikutnya yang akan kita lihat adalah 48.2k, yang akan lebih baik lagi dari perspektif pembelian jangka panjang.
Untuk saat ini, saya sepenuhnya menepi, dan sejujurnya itu adalah berkah dalam kondisi pergerakan harga ini...
Tren sudah kehabisan tenaga, dan para bear berusaha sebaik mungkin untuk mencegah bull mengambil kendali selama mungkin.
Namun, kehabisan tenaga bukan berarti pembalikan arah terjadi seketika. Terkadang, kita bisa melihat ekor pelemahan yang brutal akibat kehabisan tenaga (aksi jual untuk keluar) sebelum titik terendah terbentuk. Sepertinya para bull sedang mengundangnya saat ini, karena sejauh ini mereka tidak menunjukkan tanda-tanda kekuatan.
Saya akan membagikan pembaruan lengkap pada hari Senin dengan prospek terbaru! #Analisis Harga BTC# #Wawasan Makro#
74
·
--
Lihat terjemahan
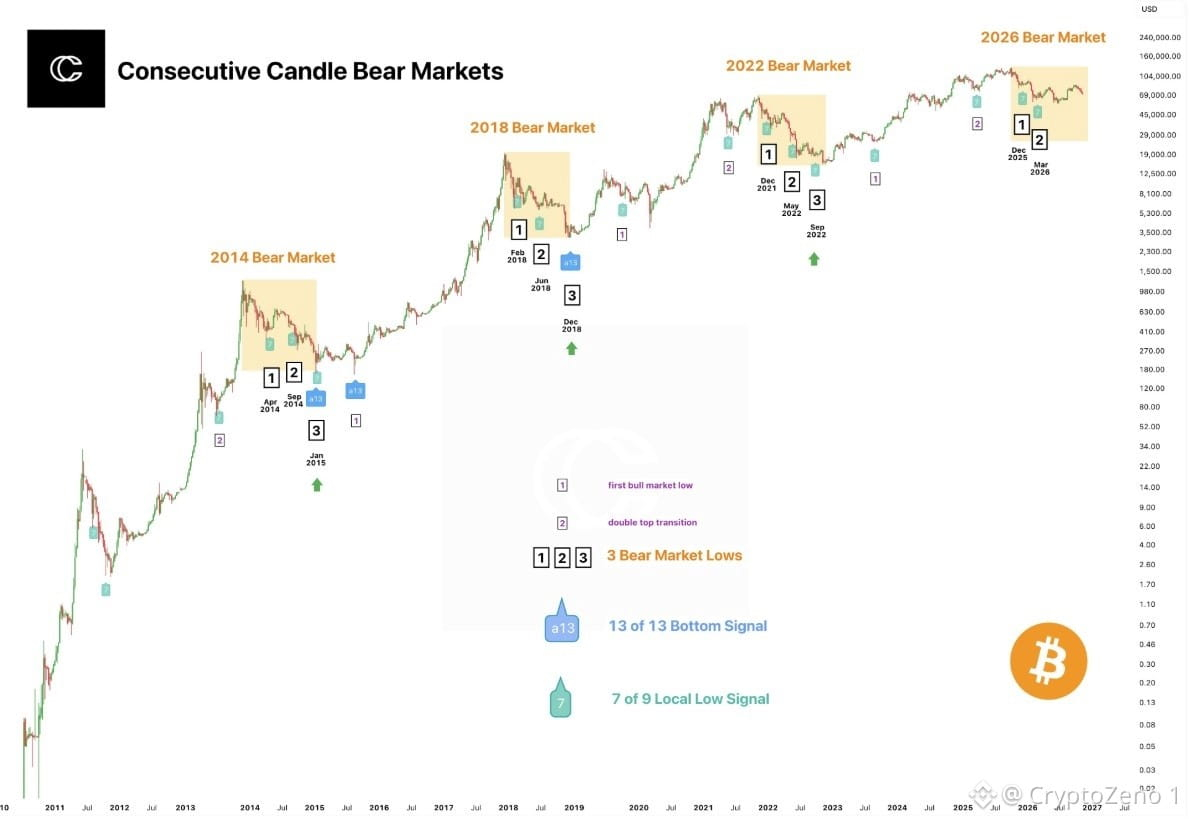
🚨 $BTC BEAR MARKET HISTORY IS REPEATING: THE THIRD BOTTOM COULD BE THE BIGGEST TURNING POINT! Bitcoin’s previous bear markets in 2014, 2018, and 2022 reveal a striking recurring structure: three distinct downside lows before a sustainable recovery takes shape. The chart highlights how these cycles developed through an initial bottom, a double top transition, and a final capitulation phase before the next major bullish expansion. 2026 IS NOW ENTERING THE CRITICAL ZONE. The current cycle has already marked two important downside phases in December 2025 and March 2026. If historical fractal behavior continues, another major bottoming event could still be part of the process before the next bullish structure fully emerges. The historical signals add another layer of significance. The 13 of 13 Bottom Signal record and 7 of 9 Local Low Signal record suggest these indicators have tracked important cycle turning points with notable consistency. However, a historical pattern is not a guaranteed forecast, and confirmation through price structure remains essential. THE KEY TAKEAWAY: Bitcoin may not have completed its bear market structure yet. The next major low could determine whether 2026 becomes another prolonged accumulation phase or the foundation for the next powerful bull market. #BTC Price Analysis# #Macro Insights#
🚨 $BTC BEAR MARKET HISTORY IS REPEATING: THE THIRD BOTTOM COULD BE THE BIGGEST TURNING POINT! Bitcoin’s previous bear markets in 2014, 2018, and 2022 reveal a striking recurring structure: three distinct downside lows before a sustainable recovery takes shape. The chart highlights how these cycles developed through an initial bottom, a double top transition, and a final capitulation phase before the next major bullish expansion. 2026 IS NOW ENTERING THE CRITICAL ZONE. The current cycle has already marked two important downside phases in December 2025 and March 2026. If historical fractal behavior continues, another major bottoming event could still be part of the process before the next bullish structure fully emerges. The historical signals add another layer of significance. The 13 of 13 Bottom Signal record and 7 of 9 Local Low Signal record suggest these indicators have tracked important cycle turning points with notable consistency. However, a historical pattern is not a guaranteed forecast, and confirmation through price structure remains essential. THE KEY TAKEAWAY: Bitcoin may not have completed its bear market structure yet. The next major low could determine whether 2026 becomes another prolonged accumulation phase or the foundation for the next powerful bull market. #BTC Price Analysis# #Macro Insights#
66
·
--
Peretas Korea Utara meluncurkan MEMECOIN untuk mencuci uang hasil peretasan Binance senilai $6.3 Miliar.
Perusahaan analitik blockchain Elliptic menemukan enam memecoin semacam itu, yang dibuat antara 5 dan 7 November, masing-masing berharga sekitar $90.
Caranya sederhana. Peretas membuat kumpulan likuiditas di bursa DeFi, memasangkan memecoin dengan kripto sungguhan seperti NEAR.
Satu dompet peretas membeli memecoin dengan NEAR curian, sementara dompet lain menjualnya kembali ke kumpulan yang sama untuk mendapatkan NEAR.
Ini membuat dompet penerima tampak seolah memperoleh uang dari perdagangan biasa. Mereka sudah memindahkan $430,000 dengan cara ini di jaringan NEAR, dan trik yang sama juga terlihat di Tron dan Solana.
Ini membuat kripto curian lebih sulit dilacak.
USDT dan USDC curian dapat dibekukan oleh penerbitnya, tetapi BTC, ETH, dan NEAR tidak dikendalikan secara terpusat dan dapat ditransfer.
Peretas menggunakan proses yang sama persis dalam pembobolan Bybit pada 2025, pencurian kripto terbesar sebelum Binance.
$BTC #Analisis Harga BTC# #BNBChain# #Wawasan Makro#
Peretas Korea Utara meluncurkan MEMECOIN untuk mencuci uang hasil peretasan Binance senilai $6.3 Miliar.
Perusahaan analitik blockchain Elliptic menemukan enam memecoin semacam itu, yang dibuat antara 5 dan 7 November, masing-masing berharga sekitar $90.
Caranya sederhana. Peretas membuat kumpulan likuiditas di bursa DeFi, memasangkan memecoin dengan kripto sungguhan seperti NEAR.
Satu dompet peretas membeli memecoin dengan NEAR curian, sementara dompet lain menjualnya kembali ke kumpulan yang sama untuk mendapatkan NEAR.
Ini membuat dompet penerima tampak seolah memperoleh uang dari perdagangan biasa. Mereka sudah memindahkan $430,000 dengan cara ini di jaringan NEAR, dan trik yang sama juga terlihat di Tron dan Solana.
Ini membuat kripto curian lebih sulit dilacak.
USDT dan USDC curian dapat dibekukan oleh penerbitnya, tetapi BTC, ETH, dan NEAR tidak dikendalikan secara terpusat dan dapat ditransfer.
Peretas menggunakan proses yang sama persis dalam pembobolan Bybit pada 2025, pencurian kripto terbesar sebelum Binance.
$BTC #Analisis Harga BTC# #BNBChain# #Wawasan Makro#
Perusahaan analitik blockchain Elliptic menemukan enam memecoin semacam itu, yang dibuat antara 5 dan 7 November, masing-masing berharga sekitar $90.
Caranya sederhana. Peretas membuat kumpulan likuiditas di bursa DeFi, memasangkan memecoin dengan kripto sungguhan seperti NEAR.
Satu dompet peretas membeli memecoin dengan NEAR curian, sementara dompet lain menjualnya kembali ke kumpulan yang sama untuk mendapatkan NEAR.
Ini membuat dompet penerima tampak seolah memperoleh uang dari perdagangan biasa. Mereka sudah memindahkan $430,000 dengan cara ini di jaringan NEAR, dan trik yang sama juga terlihat di Tron dan Solana.
Ini membuat kripto curian lebih sulit dilacak.
USDT dan USDC curian dapat dibekukan oleh penerbitnya, tetapi BTC, ETH, dan NEAR tidak dikendalikan secara terpusat dan dapat ditransfer.
Peretas menggunakan proses yang sama persis dalam pembobolan Bybit pada 2025, pencurian kripto terbesar sebelum Binance.
$BTC #Analisis Harga BTC# #BNBChain# #Wawasan Makro#


55
·
--
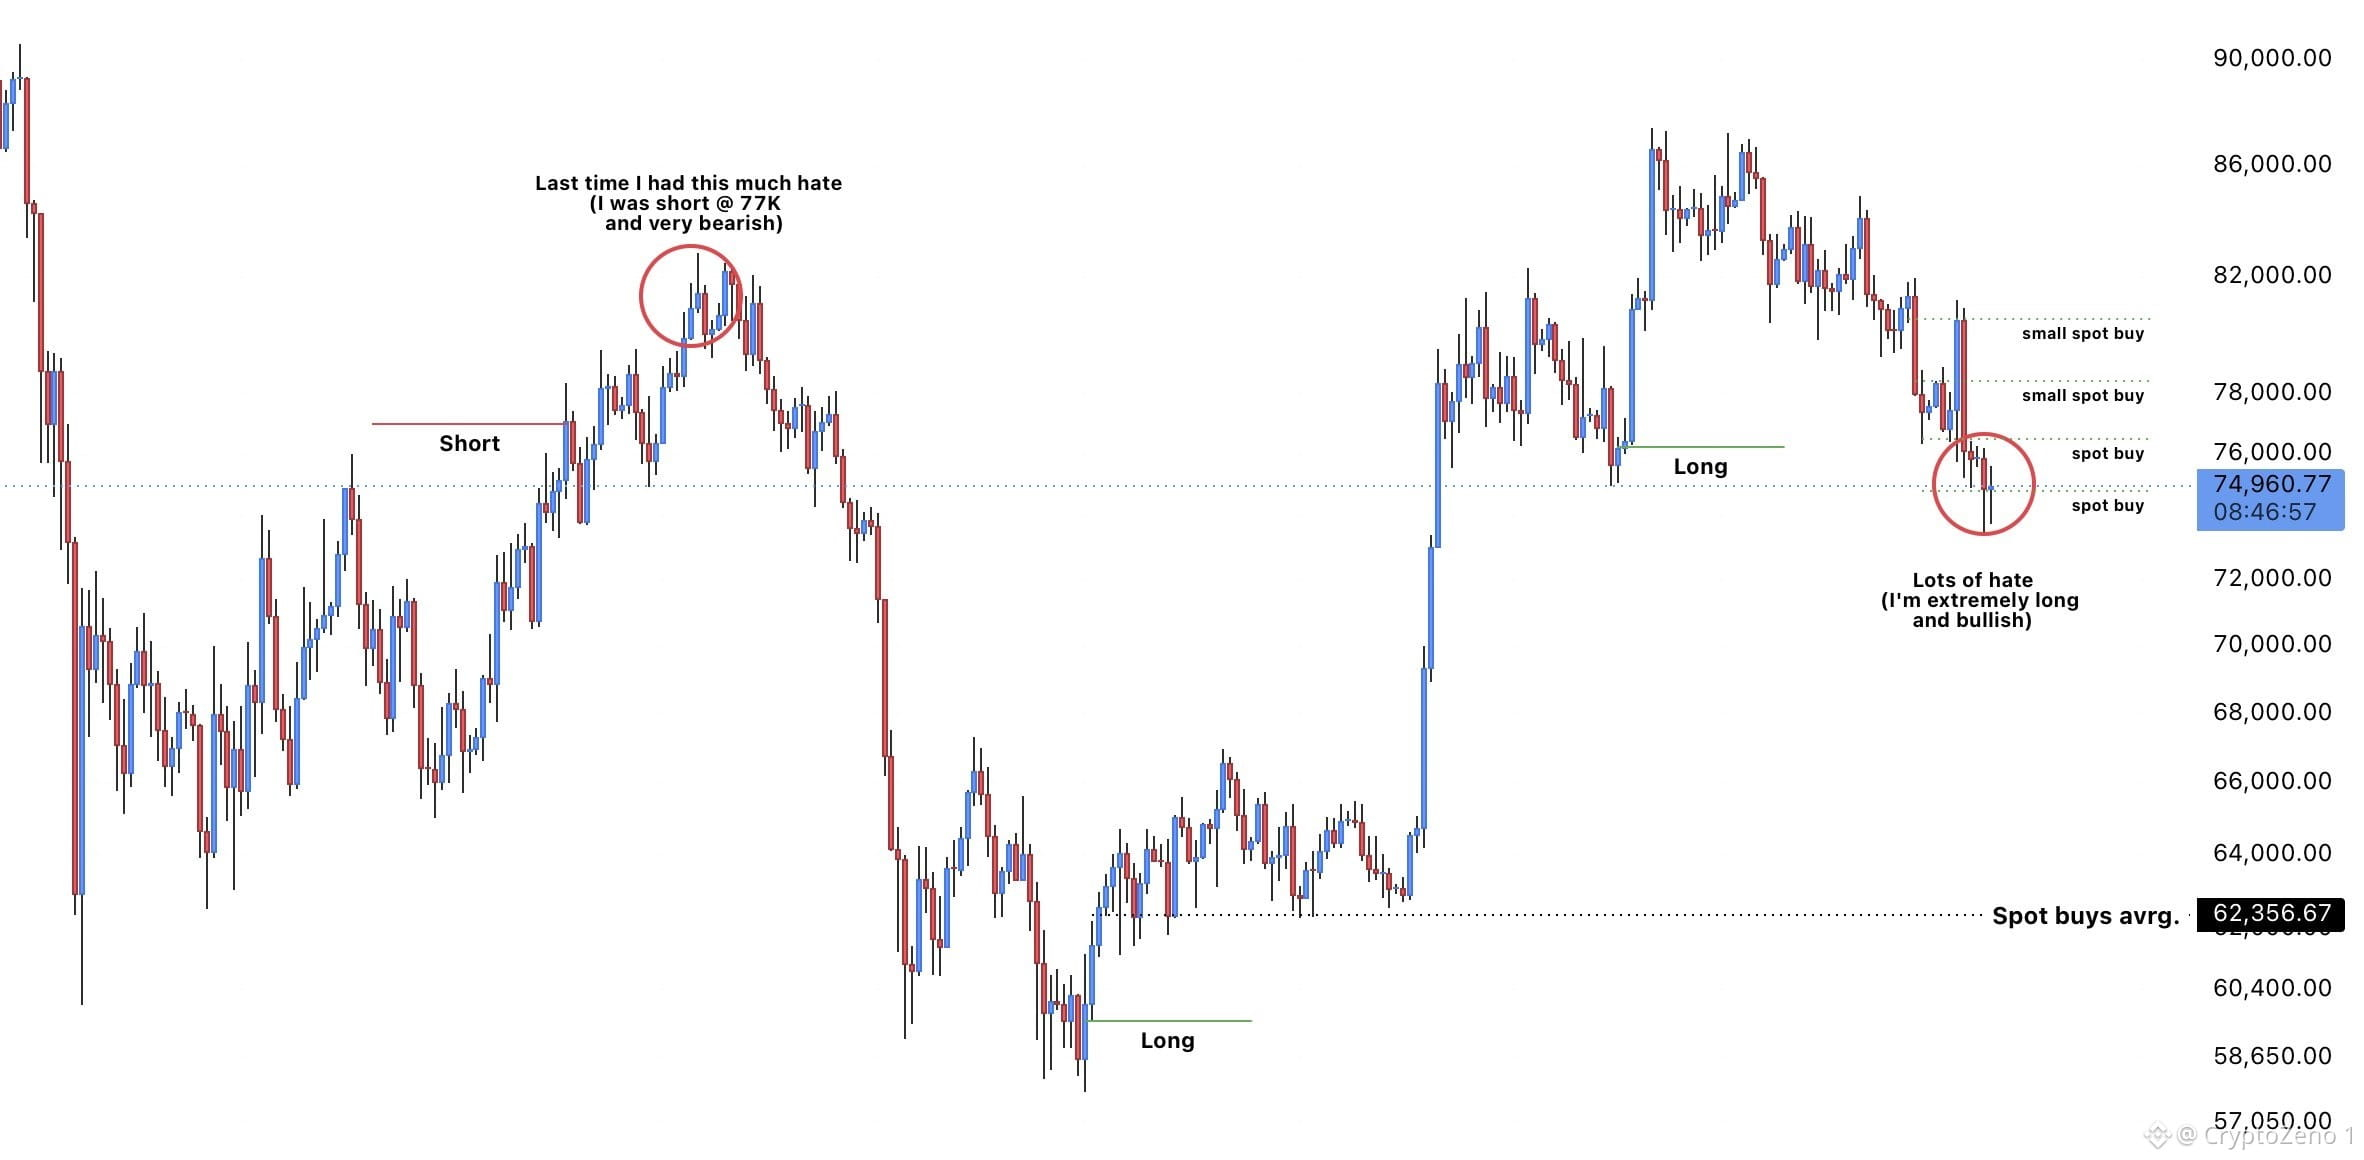
$BTC
Terakhir kali saya menerima kebencian sebanyak ini adalah saat harga berada di 80K, ketika reli pasar bearish. Harga terus naik melawan posisi short saya, dan pada akhirnya prediksi saya terbukti.
Hal yang sama terjadi sekarang, hanya saja saya berada di sisi yang berlawanan. Saya sangat bullish, tetapi harga terus turun melawan posisi long dan pembelian spot saya.
Saya selalu mengambil posisi sedikit lebih awal. Menangkap titik terendah yang tepat bukanlah tujuannya. Tujuannya adalah menangkap pergerakan yang lebih besar.
Saya jauh lebih memilih beberapa posisi saya mengalami penurunan beberapa persen sementara saya bersiap menghadapi ekspansi besar berikutnya, daripada hanya menunggu di pinggir lapangan demi entry yang sempurna dan berisiko melewatkan seluruh kenaikan harga.
Strateginya tidak berubah. Saya siap masuk lebih awal, siap melewati volatilitas, dan siap bertahan hingga harga jauh lebih tinggi.
Waktu yang akan menjawab. 🃏 #BTC Analisis Harga# #Wawasan Makro#
$BTC
Terakhir kali saya menerima kebencian sebanyak ini adalah saat harga berada di 80K, ketika reli pasar bearish. Harga terus naik melawan posisi short saya, dan pada akhirnya prediksi saya terbukti.
Hal yang sama terjadi sekarang, hanya saja saya berada di sisi yang berlawanan. Saya sangat bullish, tetapi harga terus turun melawan posisi long dan pembelian spot saya.
Saya selalu mengambil posisi sedikit lebih awal. Menangkap titik terendah yang tepat bukanlah tujuannya. Tujuannya adalah menangkap pergerakan yang lebih besar.
Saya jauh lebih memilih beberapa posisi saya mengalami penurunan beberapa persen sementara saya bersiap menghadapi ekspansi besar berikutnya, daripada hanya menunggu di pinggir lapangan demi entry yang sempurna dan berisiko melewatkan seluruh kenaikan harga.
Strateginya tidak berubah. Saya siap masuk lebih awal, siap melewati volatilitas, dan siap bertahan hingga harga jauh lebih tinggi.
Waktu yang akan menjawab. 🃏 #BTC Analisis Harga# #Wawasan Makro#
Terakhir kali saya menerima kebencian sebanyak ini adalah saat harga berada di 80K, ketika reli pasar bearish. Harga terus naik melawan posisi short saya, dan pada akhirnya prediksi saya terbukti.
Hal yang sama terjadi sekarang, hanya saja saya berada di sisi yang berlawanan. Saya sangat bullish, tetapi harga terus turun melawan posisi long dan pembelian spot saya.
Saya selalu mengambil posisi sedikit lebih awal. Menangkap titik terendah yang tepat bukanlah tujuannya. Tujuannya adalah menangkap pergerakan yang lebih besar.
Saya jauh lebih memilih beberapa posisi saya mengalami penurunan beberapa persen sementara saya bersiap menghadapi ekspansi besar berikutnya, daripada hanya menunggu di pinggir lapangan demi entry yang sempurna dan berisiko melewatkan seluruh kenaikan harga.
Strateginya tidak berubah. Saya siap masuk lebih awal, siap melewati volatilitas, dan siap bertahan hingga harga jauh lebih tinggi.
Waktu yang akan menjawab. 🃏 #BTC Analisis Harga# #Wawasan Makro#
69
·
--
Binance dan CZ telah memanggil Kevin O'Leary melalui subpoena dalam gugatan FTX senilai $1,76 miliar yang masih berlangsung $BTC
Sengketa hukum ini berpusat pada kesepakatan tahun 2021, ketika FTX membeli kembali kepemilikan saham Binance
Administrator kebangkrutan menuduh bahwa transaksi tersebut didanai menggunakan aset nasabah yang disalahgunakan
Binance dan CZ membantah melakukan pelanggaran dan berupaya menggugurkan gugatan tersebut. Mereka berargumen bahwa Sam Bankman-Fried bertanggung jawab atas keruntuhan FTX
Pada bulan Juli, seorang hakim kepailitan AS memutuskan bahwa klaim pemulihan senilai $1,76 miliar dapat dilanjutkan, sehingga sengketa ini tetap berlanjut #Analisis Harga BTC# #Wawasan Makro# #BNBChain#
Binance dan CZ telah memanggil Kevin O'Leary melalui subpoena dalam gugatan FTX senilai $1,76 miliar yang masih berlangsung $BTC
Sengketa hukum ini berpusat pada kesepakatan tahun 2021, ketika FTX membeli kembali kepemilikan saham Binance
Administrator kebangkrutan menuduh bahwa transaksi tersebut didanai menggunakan aset nasabah yang disalahgunakan
Binance dan CZ membantah melakukan pelanggaran dan berupaya menggugurkan gugatan tersebut. Mereka berargumen bahwa Sam Bankman-Fried bertanggung jawab atas keruntuhan FTX
Pada bulan Juli, seorang hakim kepailitan AS memutuskan bahwa klaim pemulihan senilai $1,76 miliar dapat dilanjutkan, sehingga sengketa ini tetap berlanjut #Analisis Harga BTC# #Wawasan Makro# #BNBChain#
Sengketa hukum ini berpusat pada kesepakatan tahun 2021, ketika FTX membeli kembali kepemilikan saham Binance
Administrator kebangkrutan menuduh bahwa transaksi tersebut didanai menggunakan aset nasabah yang disalahgunakan
Binance dan CZ membantah melakukan pelanggaran dan berupaya menggugurkan gugatan tersebut. Mereka berargumen bahwa Sam Bankman-Fried bertanggung jawab atas keruntuhan FTX
Pada bulan Juli, seorang hakim kepailitan AS memutuskan bahwa klaim pemulihan senilai $1,76 miliar dapat dilanjutkan, sehingga sengketa ini tetap berlanjut #Analisis Harga BTC# #Wawasan Makro# #BNBChain#


64
·
--
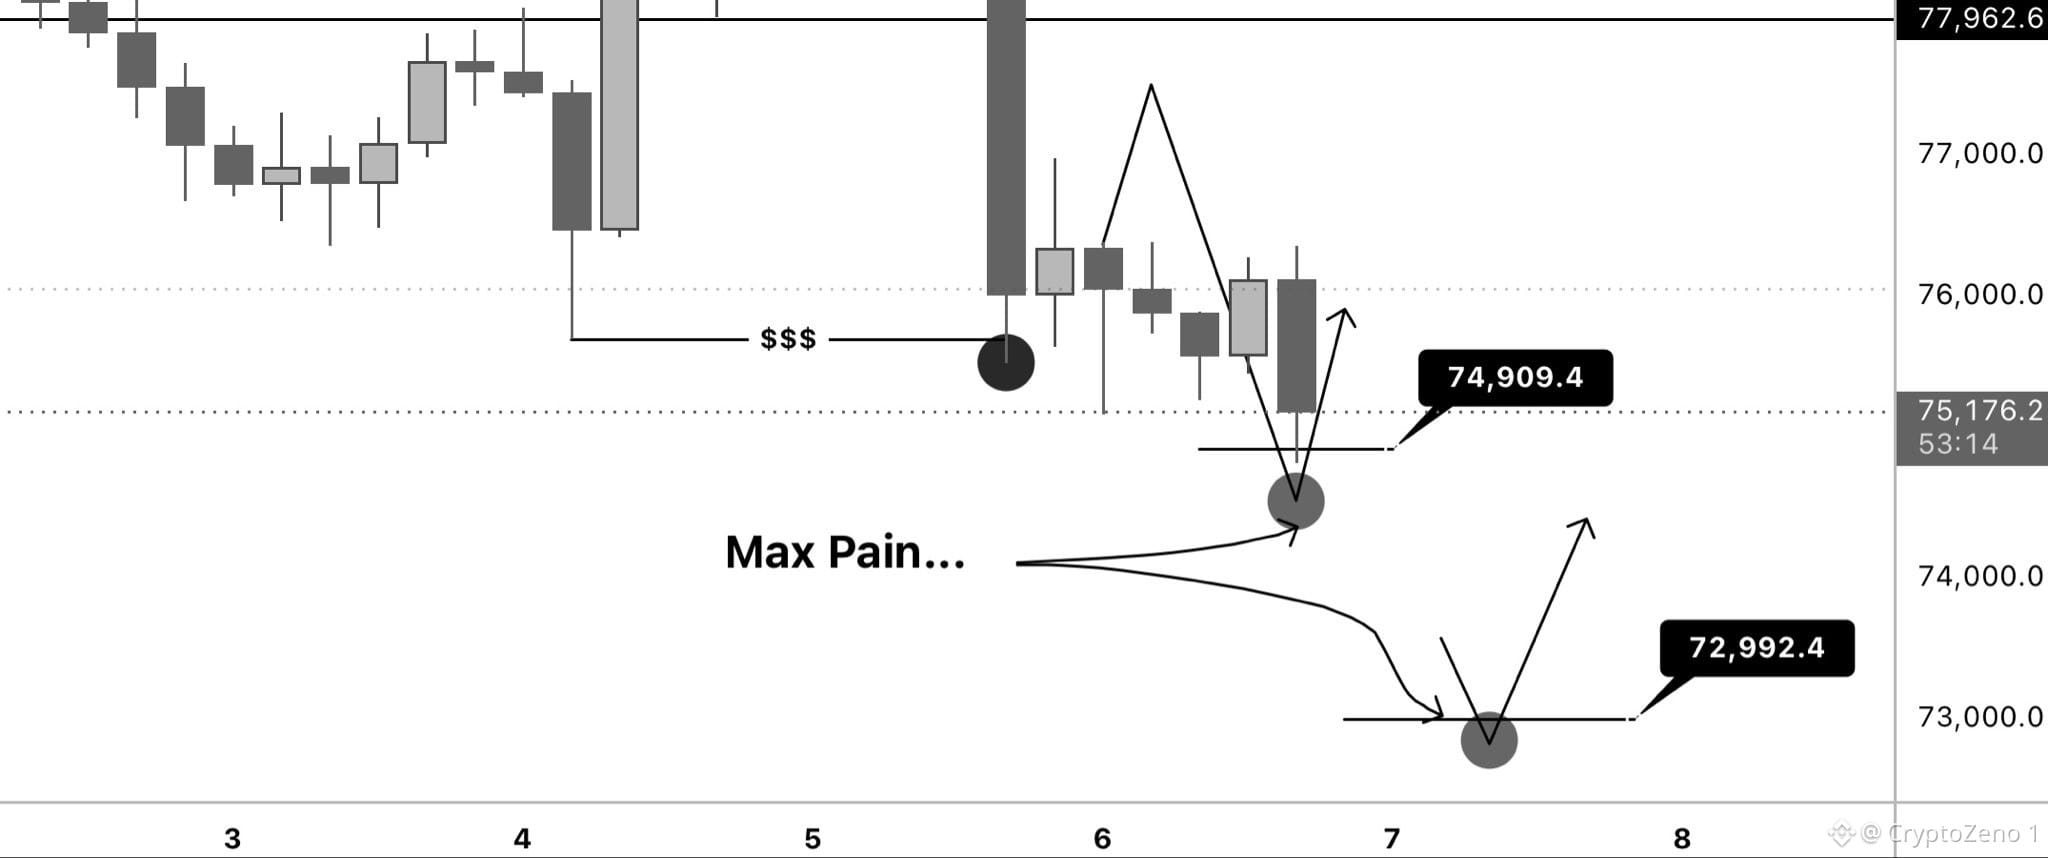
$BTC Mendapatkan sweep ke FVG Bulanan. Jika Anda mengingat pembaruan sebelumnya yang saya bagikan, ini adalah Zona Retest Ideal & Skenario Max Pain. Sekarang, saya mengharapkan reaksi bullish yang cepat dari zona ini. Kita tidak ingin melihat para bull kesulitan di sini. #Analisis Harga BTC# #Wawasan Makro#
$BTC Mendapatkan sweep ke FVG Bulanan. Jika Anda mengingat pembaruan sebelumnya yang saya bagikan, ini adalah Zona Retest Ideal & Skenario Max Pain. Sekarang, saya mengharapkan reaksi bullish yang cepat dari zona ini. Kita tidak ingin melihat para bull kesulitan di sini. #Analisis Harga BTC# #Wawasan Makro#
42
·
--
Indikator Siklus Bitcoin Menunjukkan Koreksi Mungkin Belum Berakhir
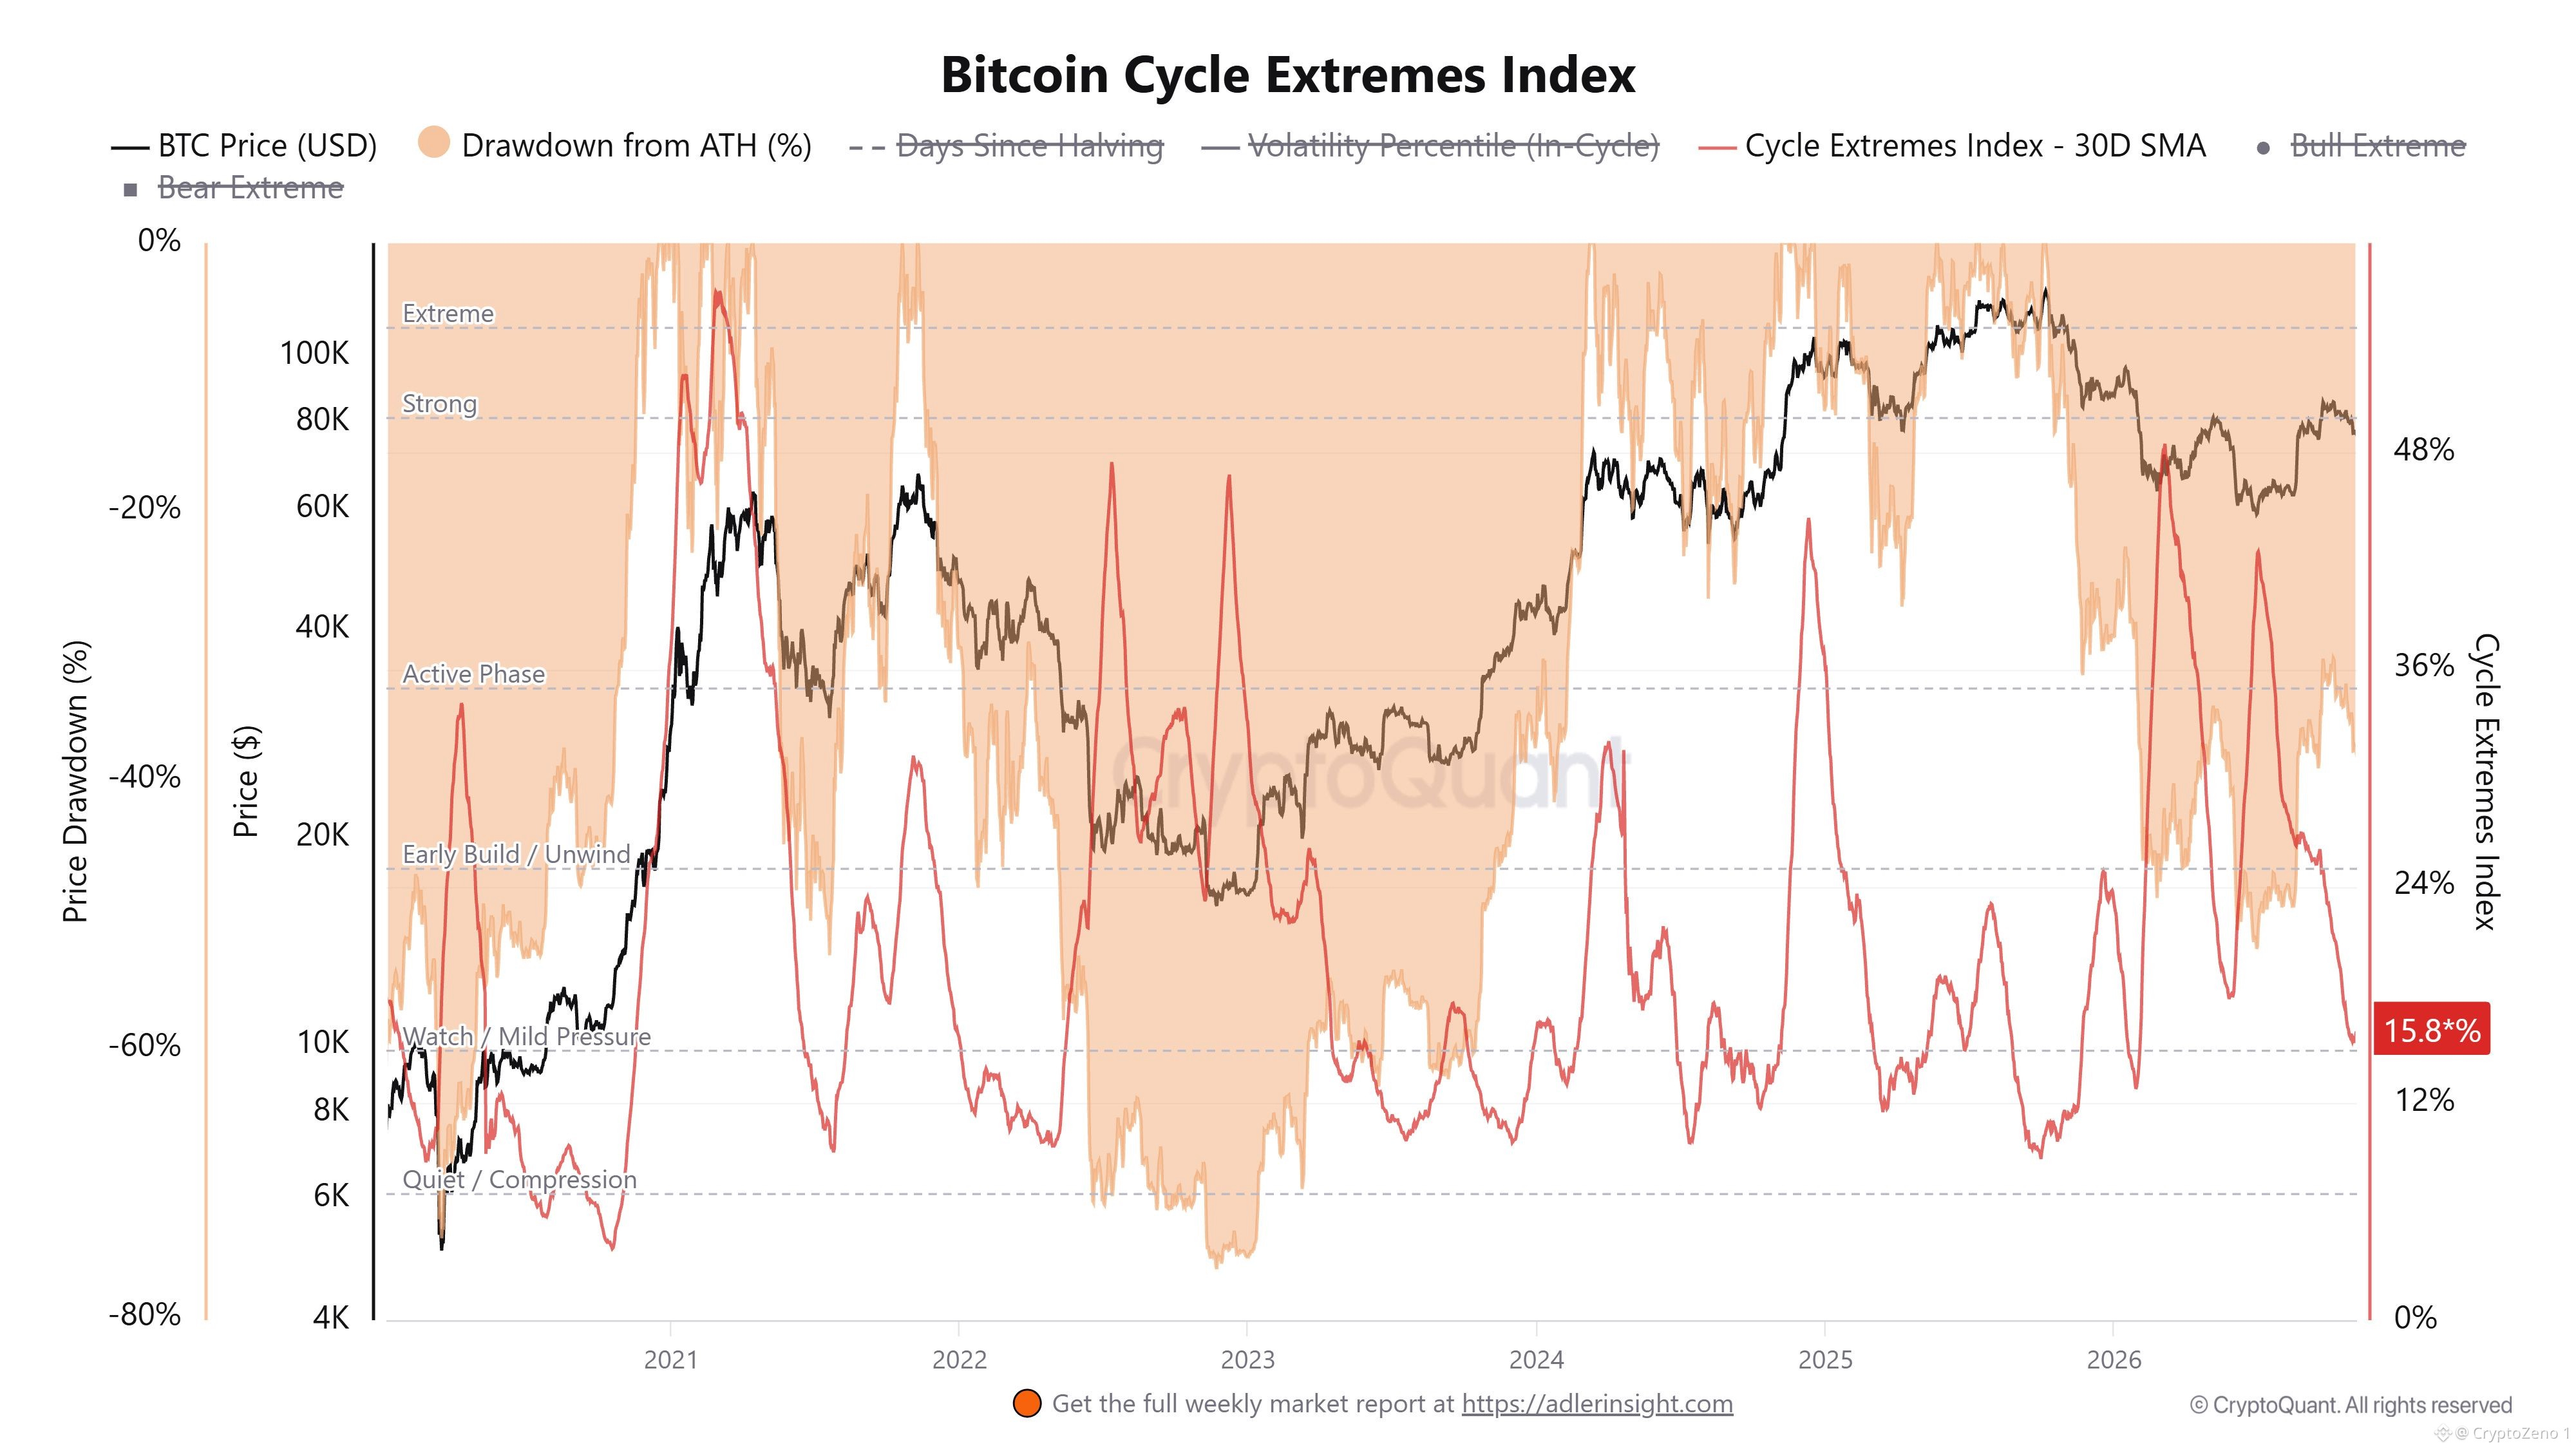
Struktur pasar $BTC menunjukkan siklus yang mendingin, tetapi belum mencapai kondisi ekstrem yang sering terlihat menjelang titik balik besar. Bitcoin Cycle Extremes Index turun ke 15.8% pada rata-rata pergerakan 30 harinya, menempatkannya di zona Waspada / Tekanan Ringan. BTC diperdagangkan di sekitar $80,000, sekitar 46% di bawah rekor tertinggi sebelumnya. Penurunannya cukup besar, tetapi indeks masih jauh di bawah level yang terkait dengan fase aktif atau ekstrem.
Riwayat memberikan konteks yang berguna. Selama siklus 2021, indeks mencatat lonjakan tajam saat Bitcoin mendekati puncaknya dan volatilitas meningkat. Lonjakan serupa muncul selama kenaikan 2024–2025, mencerminkan periode aktivitas pasar yang intens. Pembacaan saat ini berbeda: intensitas siklus telah mereda secara signifikan. Ini menunjukkan tekanan yang berkurang, tetapi bukan berarti risiko penurunan telah hilang.
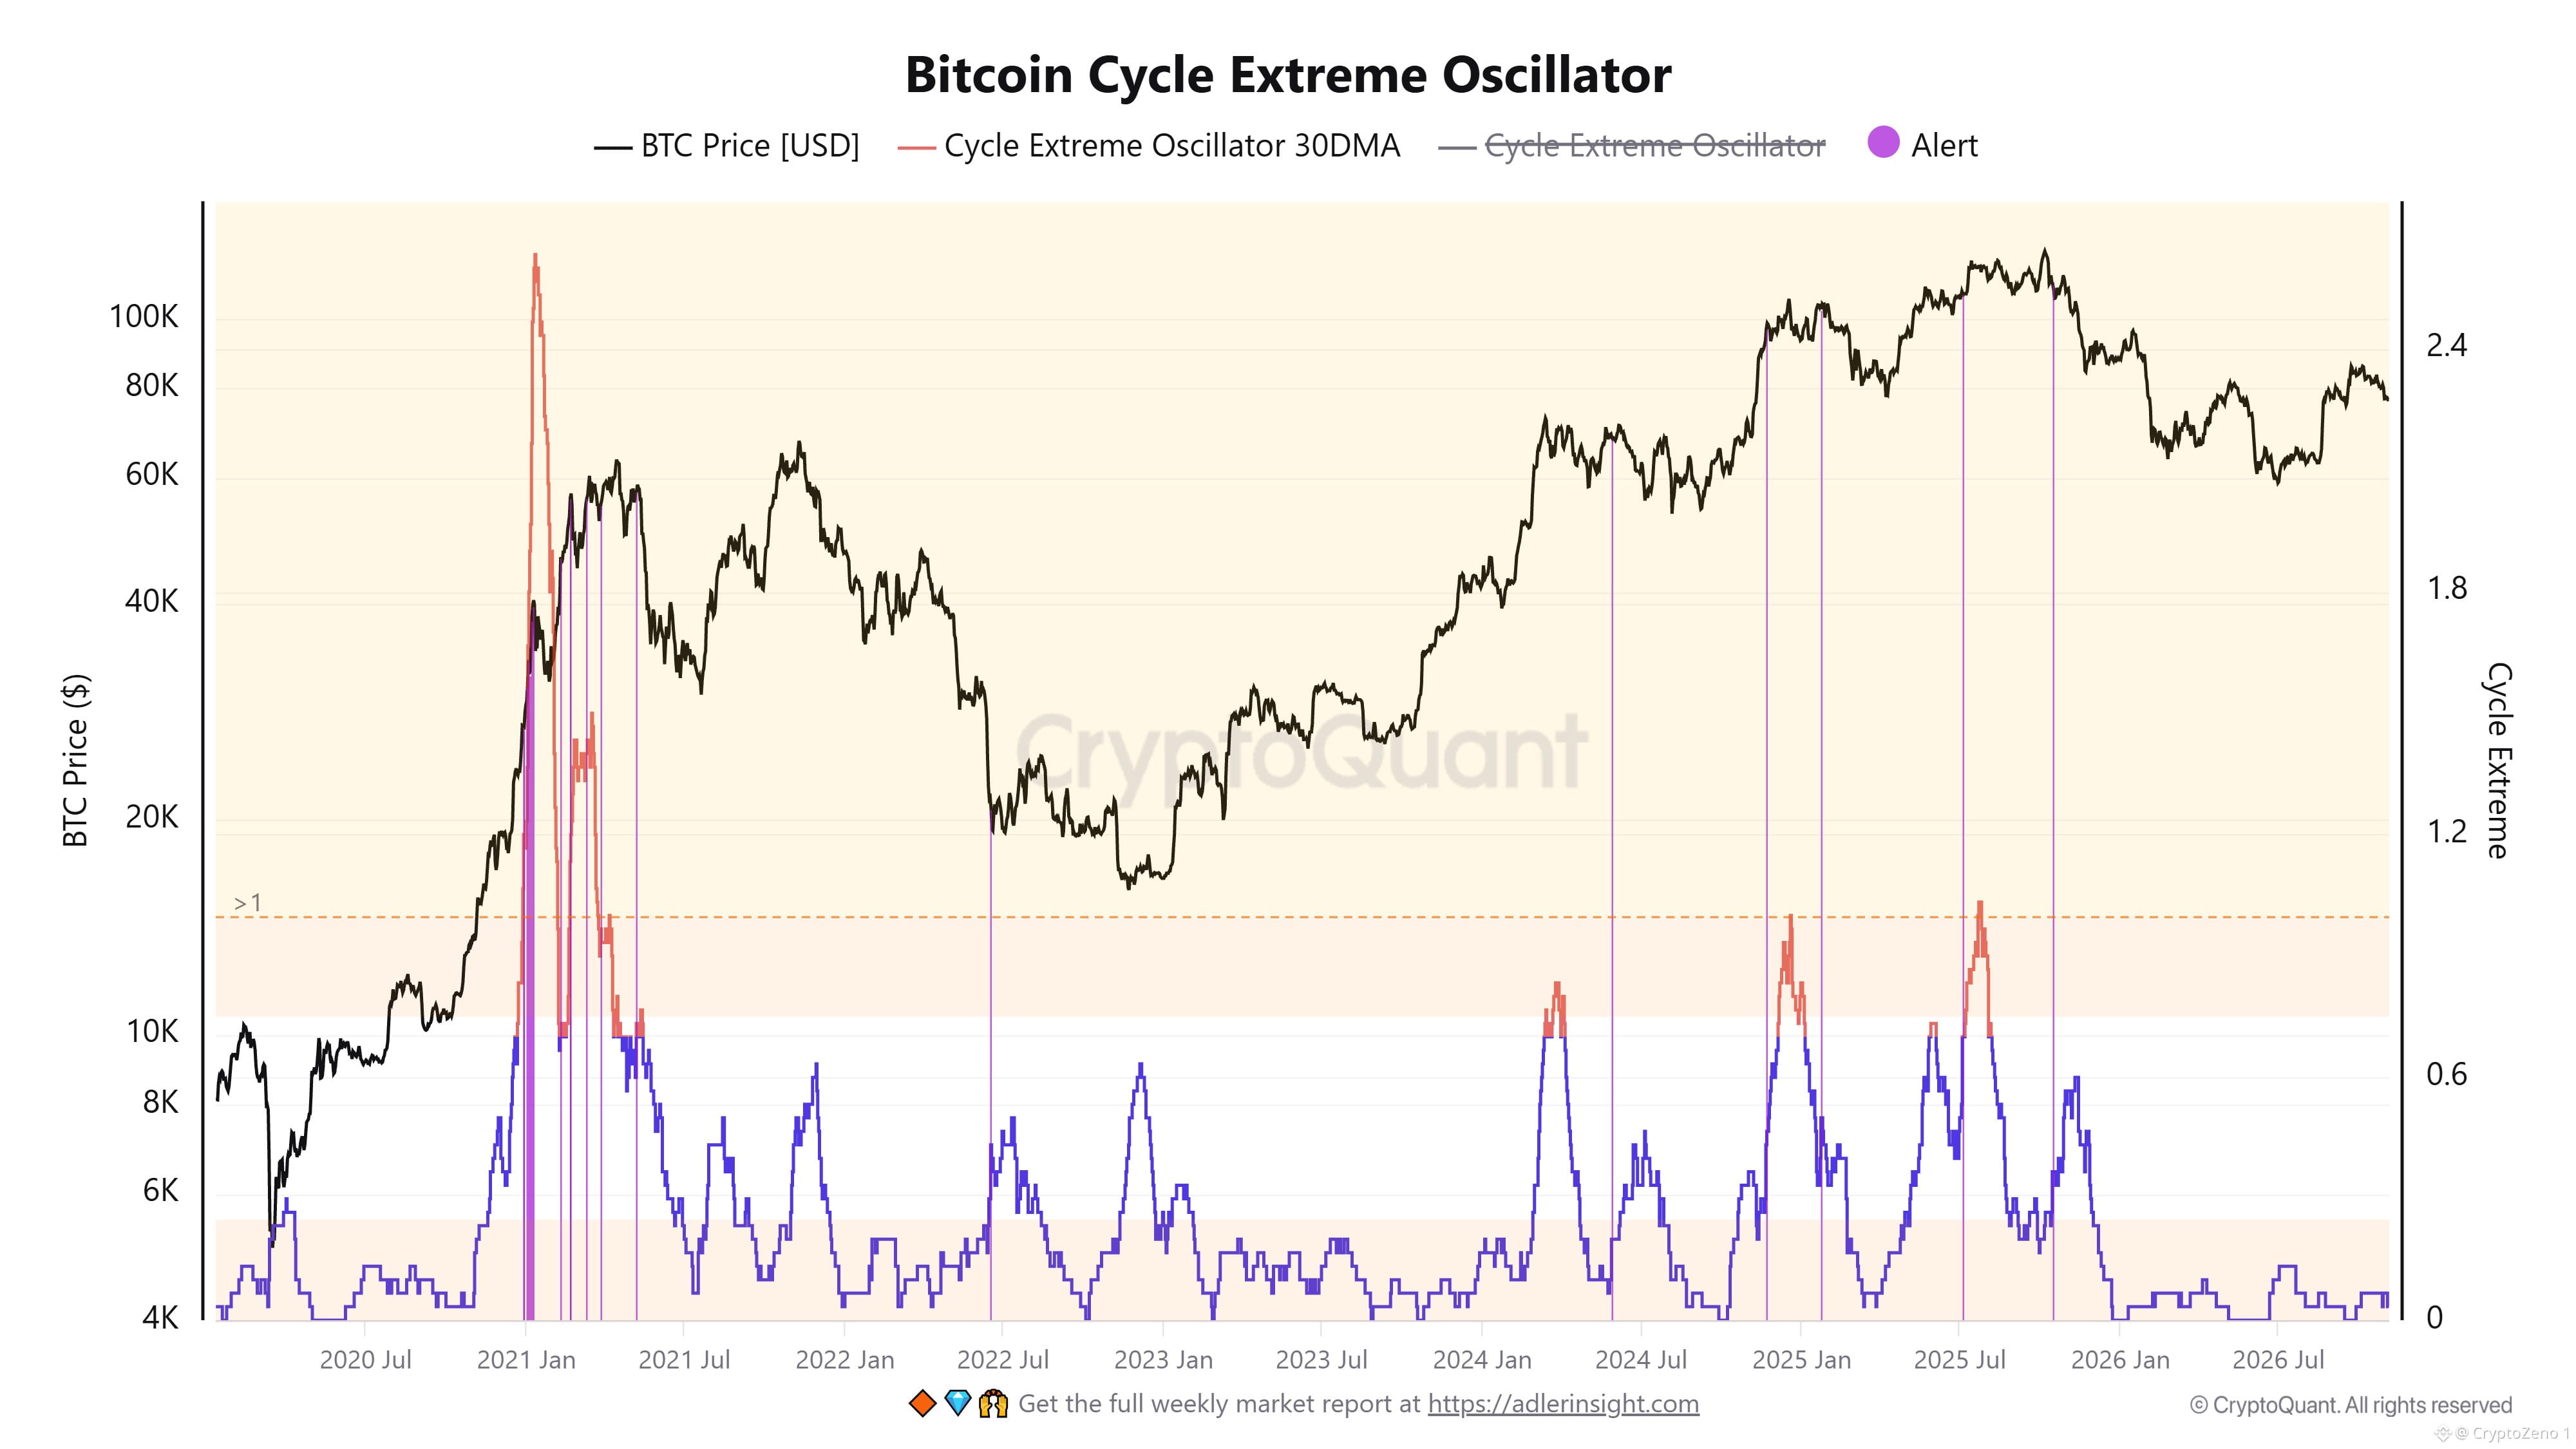
Cycle Extreme Oscillator mendukung pandangan yang berhati-hati ini. Rata-rata pergerakan 30 harinya berada dekat batas bawah rentang historis dan masih jauh di bawah ambang 1.0. Dalam siklus sebelumnya, pembacaan di atas level ini muncul selama pergerakan pasar yang signifikan, termasuk pada awal 2021 dan beberapa fase pada 2024–2025. Saat ini tidak terlihat kenaikan yang sebanding. Karena itu, oscillator hanya memberikan sedikit bukti adanya sinyal ekstrem siklus yang tegas.
Indikator menunjukkan Bitcoin berada dalam fase korektif yang lesu, bukan pada titik dasar siklus yang telah terkonfirmasi. Penurunan hampir 46% cukup signifikan, tetapi pembacaan yang rendah saja tidak dapat memastikan bahwa tekanan jual telah habis. Konsolidasi lebih lanjut atau penurunan lanjutan masih mungkin terjadi sebelum pemulihan yang berkelanjutan terbentuk. Sinyal utama yang perlu diperhatikan adalah kenaikan berkelanjutan pada Cycle Extremes Index menuju Fase Aktif, disertai pemulihan oscillator. Sampai saat itu, kondisi siklus yang mendingin tidak boleh disalahartikan sebagai pembalikan pasar yang telah terkonfirmasi. #Analisis Harga BTC# #Wawasan Makro#
Indikator Siklus Bitcoin Menunjukkan Koreksi Mungkin Belum Berakhir
Struktur pasar $BTC menunjukkan siklus yang mendingin, tetapi belum mencapai kondisi ekstrem yang sering terlihat menjelang titik balik besar. Bitcoin Cycle Extremes Index turun ke 15.8% pada rata-rata pergerakan 30 harinya, menempatkannya di zona Waspada / Tekanan Ringan. BTC diperdagangkan di sekitar $80,000, sekitar 46% di bawah rekor tertinggi sebelumnya. Penurunannya cukup besar, tetapi indeks masih jauh di bawah level yang terkait dengan fase aktif atau ekstrem.
Riwayat memberikan konteks yang berguna. Selama siklus 2021, indeks mencatat lonjakan tajam saat Bitcoin mendekati puncaknya dan volatilitas meningkat. Lonjakan serupa muncul selama kenaikan 2024–2025, mencerminkan periode aktivitas pasar yang intens. Pembacaan saat ini berbeda: intensitas siklus telah mereda secara signifikan. Ini menunjukkan tekanan yang berkurang, tetapi bukan berarti risiko penurunan telah hilang.
Cycle Extreme Oscillator mendukung pandangan yang berhati-hati ini. Rata-rata pergerakan 30 harinya berada dekat batas bawah rentang historis dan masih jauh di bawah ambang 1.0. Dalam siklus sebelumnya, pembacaan di atas level ini muncul selama pergerakan pasar yang signifikan, termasuk pada awal 2021 dan beberapa fase pada 2024–2025. Saat ini tidak terlihat kenaikan yang sebanding. Karena itu, oscillator hanya memberikan sedikit bukti adanya sinyal ekstrem siklus yang tegas.
Indikator menunjukkan Bitcoin berada dalam fase korektif yang lesu, bukan pada titik dasar siklus yang telah terkonfirmasi. Penurunan hampir 46% cukup signifikan, tetapi pembacaan yang rendah saja tidak dapat memastikan bahwa tekanan jual telah habis. Konsolidasi lebih lanjut atau penurunan lanjutan masih mungkin terjadi sebelum pemulihan yang berkelanjutan terbentuk. Sinyal utama yang perlu diperhatikan adalah kenaikan berkelanjutan pada Cycle Extremes Index menuju Fase Aktif, disertai pemulihan oscillator. Sampai saat itu, kondisi siklus yang mendingin tidak boleh disalahartikan sebagai pembalikan pasar yang telah terkonfirmasi. #Analisis Harga BTC# #Wawasan Makro#
Struktur pasar $BTC menunjukkan siklus yang mendingin, tetapi belum mencapai kondisi ekstrem yang sering terlihat menjelang titik balik besar. Bitcoin Cycle Extremes Index turun ke 15.8% pada rata-rata pergerakan 30 harinya, menempatkannya di zona Waspada / Tekanan Ringan. BTC diperdagangkan di sekitar $80,000, sekitar 46% di bawah rekor tertinggi sebelumnya. Penurunannya cukup besar, tetapi indeks masih jauh di bawah level yang terkait dengan fase aktif atau ekstrem.
Riwayat memberikan konteks yang berguna. Selama siklus 2021, indeks mencatat lonjakan tajam saat Bitcoin mendekati puncaknya dan volatilitas meningkat. Lonjakan serupa muncul selama kenaikan 2024–2025, mencerminkan periode aktivitas pasar yang intens. Pembacaan saat ini berbeda: intensitas siklus telah mereda secara signifikan. Ini menunjukkan tekanan yang berkurang, tetapi bukan berarti risiko penurunan telah hilang.
Cycle Extreme Oscillator mendukung pandangan yang berhati-hati ini. Rata-rata pergerakan 30 harinya berada dekat batas bawah rentang historis dan masih jauh di bawah ambang 1.0. Dalam siklus sebelumnya, pembacaan di atas level ini muncul selama pergerakan pasar yang signifikan, termasuk pada awal 2021 dan beberapa fase pada 2024–2025. Saat ini tidak terlihat kenaikan yang sebanding. Karena itu, oscillator hanya memberikan sedikit bukti adanya sinyal ekstrem siklus yang tegas.
Indikator menunjukkan Bitcoin berada dalam fase korektif yang lesu, bukan pada titik dasar siklus yang telah terkonfirmasi. Penurunan hampir 46% cukup signifikan, tetapi pembacaan yang rendah saja tidak dapat memastikan bahwa tekanan jual telah habis. Konsolidasi lebih lanjut atau penurunan lanjutan masih mungkin terjadi sebelum pemulihan yang berkelanjutan terbentuk. Sinyal utama yang perlu diperhatikan adalah kenaikan berkelanjutan pada Cycle Extremes Index menuju Fase Aktif, disertai pemulihan oscillator. Sampai saat itu, kondisi siklus yang mendingin tidak boleh disalahartikan sebagai pembalikan pasar yang telah terkonfirmasi. #Analisis Harga BTC# #Wawasan Makro#
57
·
--
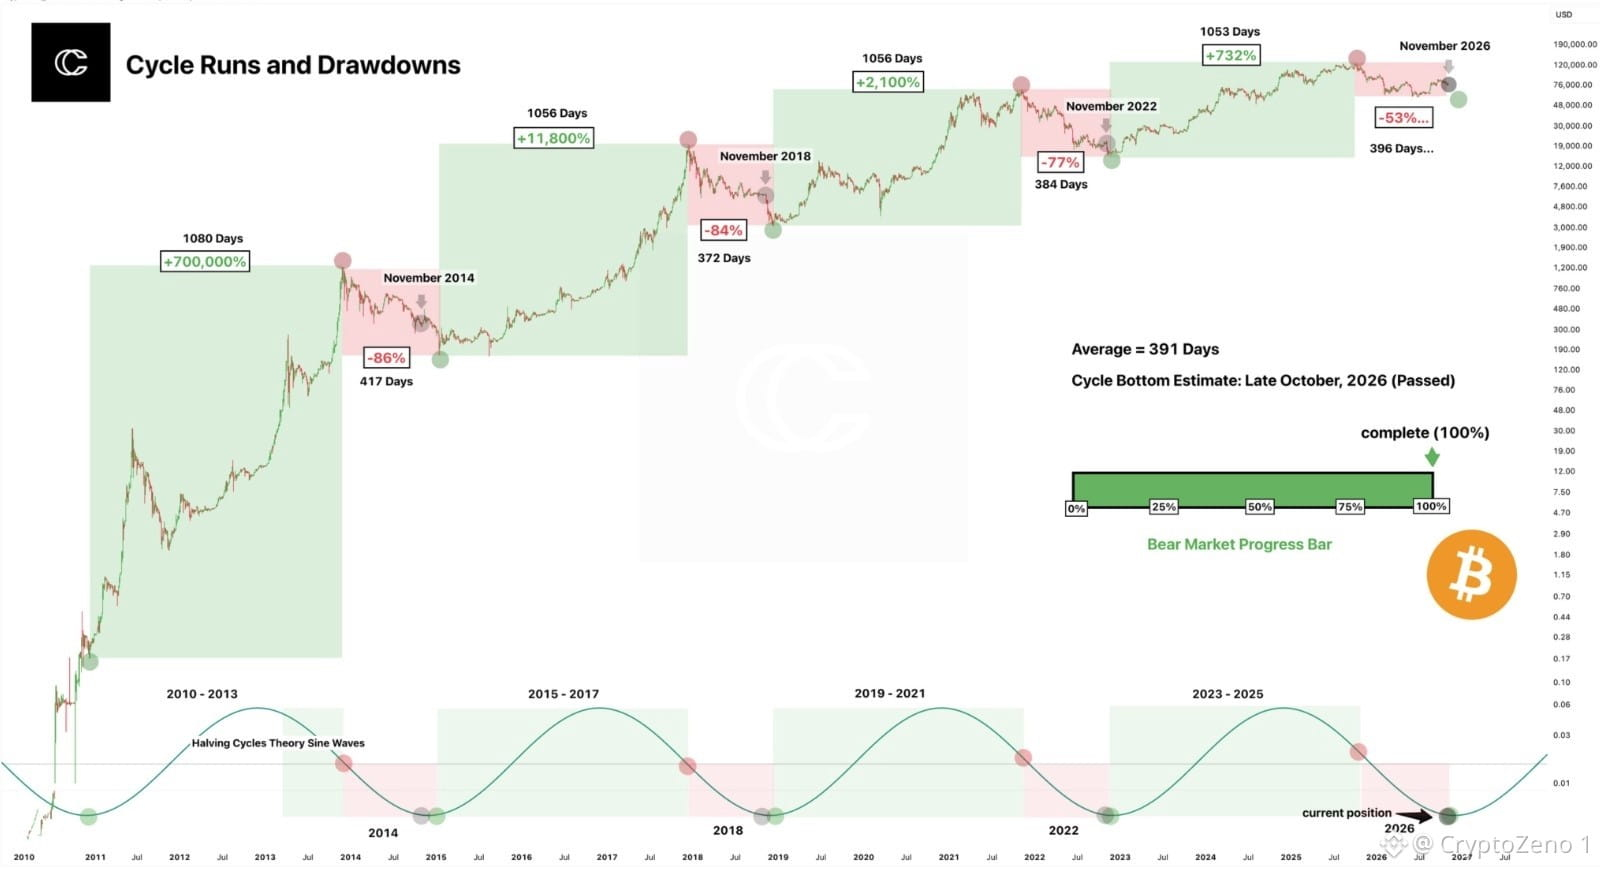
⚠️ $BTC PASAR BEAR MUNGKIN SUDAH MEMASUKI HITUNG MUNDUR TERAKHIRNYA! 🔥 Struktur siklus historis #Bitcoin menunjukkan sinyal penting. Dalam siklus-siklus sebelumnya, pasar bull berlangsung sekitar 1.050–1.080 hari, sementara pasar bear rata-rata membutuhkan 391 hari untuk mencapai titik terendahnya. Siklus terbaru mengikuti linimasa yang sangat mirip, dengan penurunan saat ini telah mencapai 396 hari. POLA HISTORIS INI SULIT DIABAIKAN. Pasar bear sebelumnya mencatat koreksi sebesar -86% pada 2014, -84% pada 2018, dan -77% pada 2022. Sejauh ini, siklus ini telah turun sekitar 53%, jauh lebih dangkal dibandingkan penurunan sebelumnya. Lebih penting lagi, model durasi historis memperkirakan titik terendah akan tercapai sekitar akhir Oktober 2026, tanggal yang telah berlalu. SINYAL BESAR: BILAH PROGRES PASAR BEAR TELAH MENCAPAI 100%. Dari segi waktu, rentang koreksi historis tampaknya telah selesai. Jika siklus ini terus mengikuti ritme historisnya, Bitcoin mungkin sedang mendekati fase akumulasi besar dan fondasi pemulihan makro berikutnya. Namun, tercapainya ambang waktu historis tidak menjamin bahwa titik terendah harga telah terkonfirmasi. Sinyal penting berikutnya adalah apakah BTC dapat membentuk basis yang bertahan lama, merebut kembali level resistansi utama, dan menunjukkan perubahan struktur pasar yang nyata. Waktunya mungkin telah habis, tetapi pasar masih perlu mengonfirmasi pembalikan arah. #Analisis Harga BTC# #Wawasan Makro#
⚠️ $BTC PASAR BEAR MUNGKIN SUDAH MEMASUKI HITUNG MUNDUR TERAKHIRNYA! 🔥 Struktur siklus historis #Bitcoin menunjukkan sinyal penting. Dalam siklus-siklus sebelumnya, pasar bull berlangsung sekitar 1.050–1.080 hari, sementara pasar bear rata-rata membutuhkan 391 hari untuk mencapai titik terendahnya. Siklus terbaru mengikuti linimasa yang sangat mirip, dengan penurunan saat ini telah mencapai 396 hari. POLA HISTORIS INI SULIT DIABAIKAN. Pasar bear sebelumnya mencatat koreksi sebesar -86% pada 2014, -84% pada 2018, dan -77% pada 2022. Sejauh ini, siklus ini telah turun sekitar 53%, jauh lebih dangkal dibandingkan penurunan sebelumnya. Lebih penting lagi, model durasi historis memperkirakan titik terendah akan tercapai sekitar akhir Oktober 2026, tanggal yang telah berlalu. SINYAL BESAR: BILAH PROGRES PASAR BEAR TELAH MENCAPAI 100%. Dari segi waktu, rentang koreksi historis tampaknya telah selesai. Jika siklus ini terus mengikuti ritme historisnya, Bitcoin mungkin sedang mendekati fase akumulasi besar dan fondasi pemulihan makro berikutnya. Namun, tercapainya ambang waktu historis tidak menjamin bahwa titik terendah harga telah terkonfirmasi. Sinyal penting berikutnya adalah apakah BTC dapat membentuk basis yang bertahan lama, merebut kembali level resistansi utama, dan menunjukkan perubahan struktur pasar yang nyata. Waktunya mungkin telah habis, tetapi pasar masih perlu mengonfirmasi pembalikan arah. #Analisis Harga BTC# #Wawasan Makro#
59
Masuk untuk menjelajahi konten lainnya
Bergabunglah dengan pengguna kripto global di Binance Square
⚡️ Dapatkan informasi terbaru dan berguna tentang kripto.
💬 Dipercayai oleh bursa kripto terbesar di dunia.
👍 Temukan wawasan nyata dari kreator terverifikasi.
Email/Nomor Ponsel
Topik Sedang Tren
NvidiaLoses$2.7TrillionInMonthAndAHalf
26,783 penayangan
153 Berdiskusi
Nilai Pasar Nvidia Anjlok $2,7 Triliun: Saat Narasi Mengalahkan Angka 📉
Crypto With Faisal
·Disukai 7 Kali
·6k penayangan
CanBTCReboundAfterFallingBelow60K?
831,663 penayangan
3,123 Berdiskusi
GlobalStocksFaceLongestLosingStreakSince2023
309,960 penayangan
2,087 Berdiskusi