$ETH Volatility: Why Risk Management Matters More Than Prediction
Ethereum's November 20 daily candle provides an important lesson about market volatility.
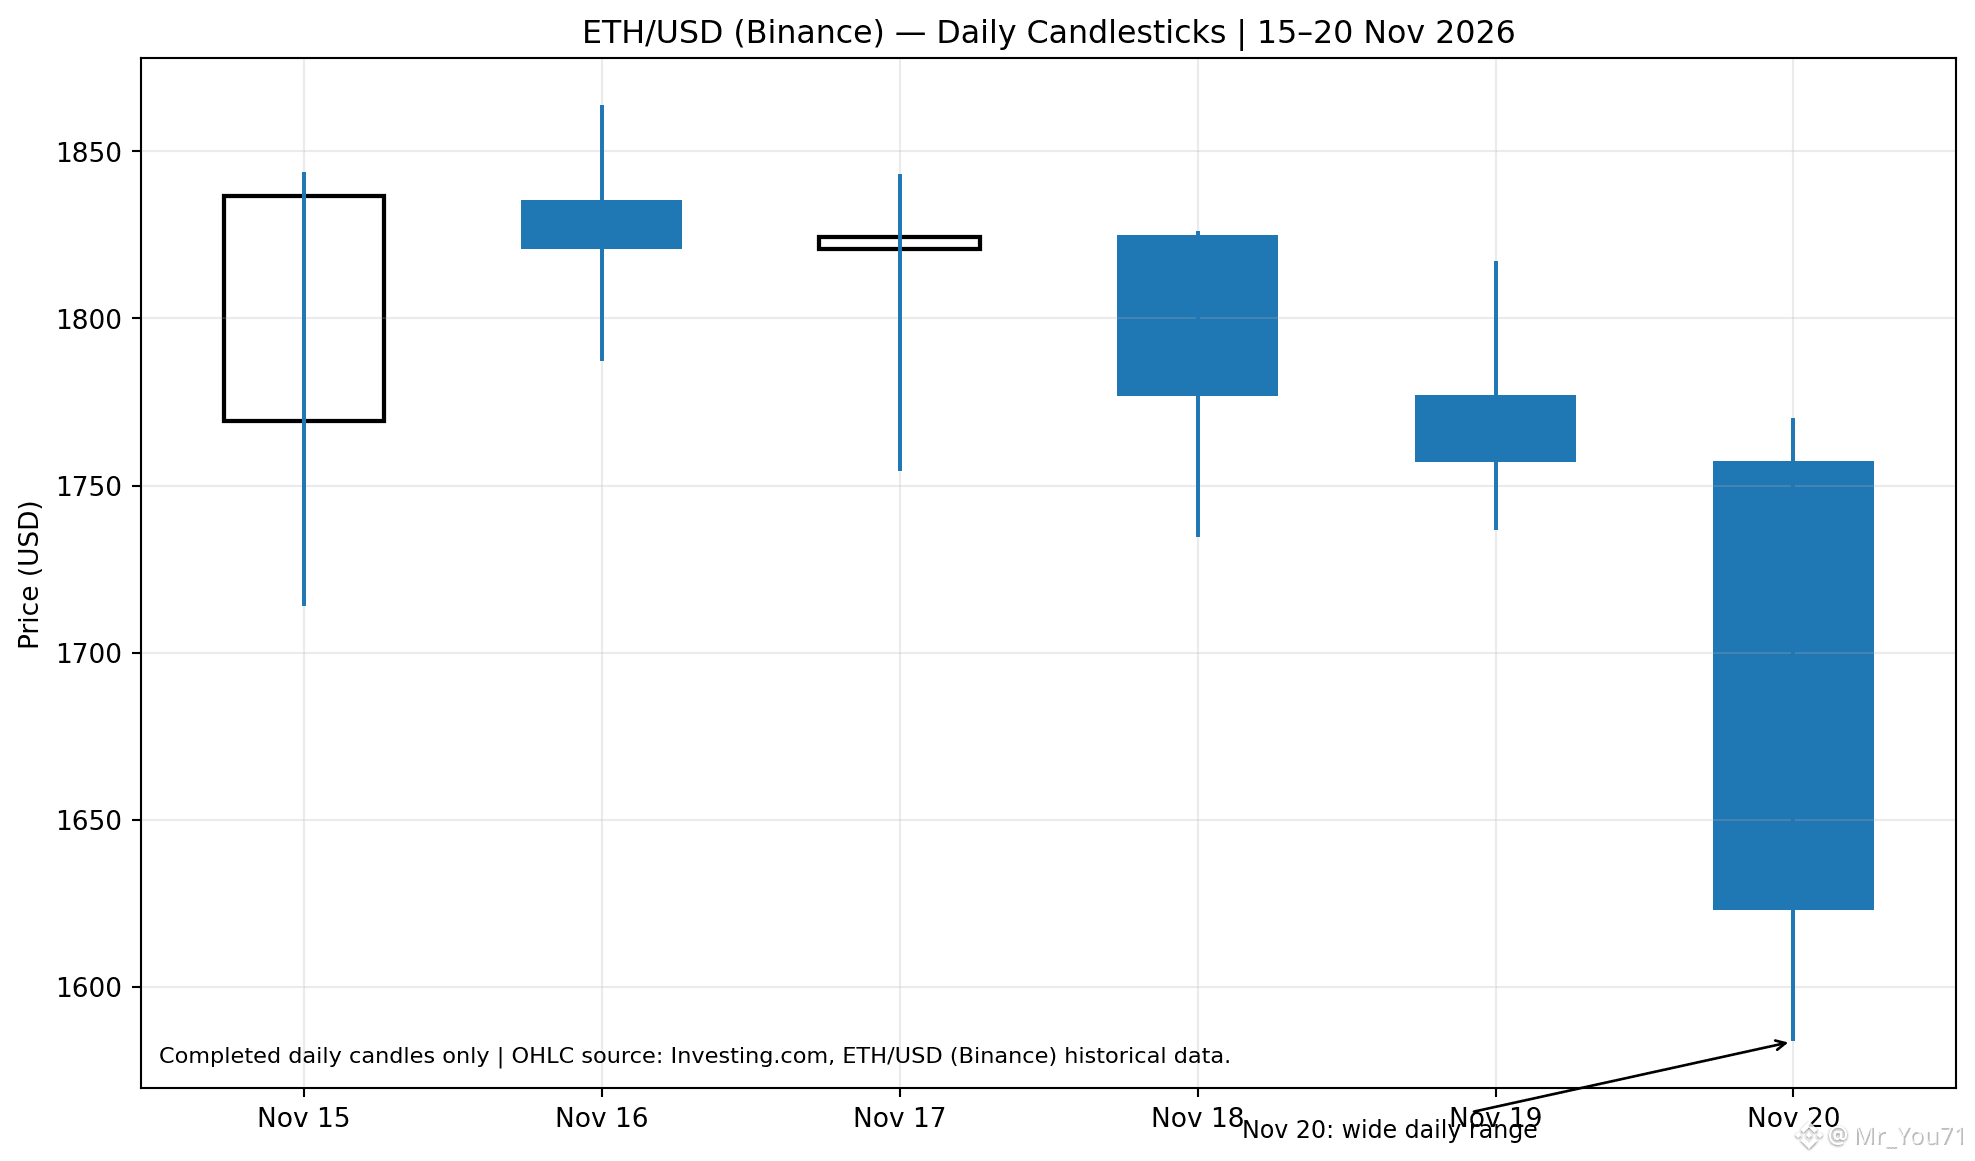
$ETH opened at $1,757.32, reached a high of $1,770.36, dropped to $1,583.64, and closed at $1,623.05. The day's high-to-low range was $186.72, showing significant price movement.
A wide trading range does not tell us exactly where the market will move next. It reminds us that risk management is essential. Traders should define their acceptable risk before entering a position.
One useful method is to calculate position size based on the distance between the entry price and the stop-loss level. When the stop distance increases, position size should be adjusted accordingly.
💡 Key Takeaway: Control your risk first. You do not need to predict every market move to become a disciplined trader.
📊 Chart Details
Coin: ETH/USDT
Timeframe: 1 Day
Chart Date: November 21, 2026
Historical Data: November 15–20
Chart Caption: Ethereum's November 20 candle shows a wide daily trading range and a close near the session low. This highlights volatility, not a guaranteed future direction.
⚠️ Risk Disclaimer: This content is for educational purposes only, not financial advice. Cryptocurrency trading involves substantial risk. Always do your own research.
#Ethereum #RiskManagement #CryptoEducation #CryptoEducatio #BinanceSquare
Ethereum's November 20 daily candle provides an important lesson about market volatility.
$ETH opened at $1,757.32, reached a high of $1,770.36, dropped to $1,583.64, and closed at $1,623.05. The day's high-to-low range was $186.72, showing significant price movement.
A wide trading range does not tell us exactly where the market will move next. It reminds us that risk management is essential. Traders should define their acceptable risk before entering a position.
One useful method is to calculate position size based on the distance between the entry price and the stop-loss level. When the stop distance increases, position size should be adjusted accordingly.
💡 Key Takeaway: Control your risk first. You do not need to predict every market move to become a disciplined trader.
📊 Chart Details
Coin: ETH/USDT
Timeframe: 1 Day
Chart Date: November 21, 2026
Historical Data: November 15–20
Chart Caption: Ethereum's November 20 candle shows a wide daily trading range and a close near the session low. This highlights volatility, not a guaranteed future direction.
⚠️ Risk Disclaimer: This content is for educational purposes only, not financial advice. Cryptocurrency trading involves substantial risk. Always do your own research.
#Ethereum #RiskManagement #CryptoEducation #CryptoEducatio #BinanceSquare