
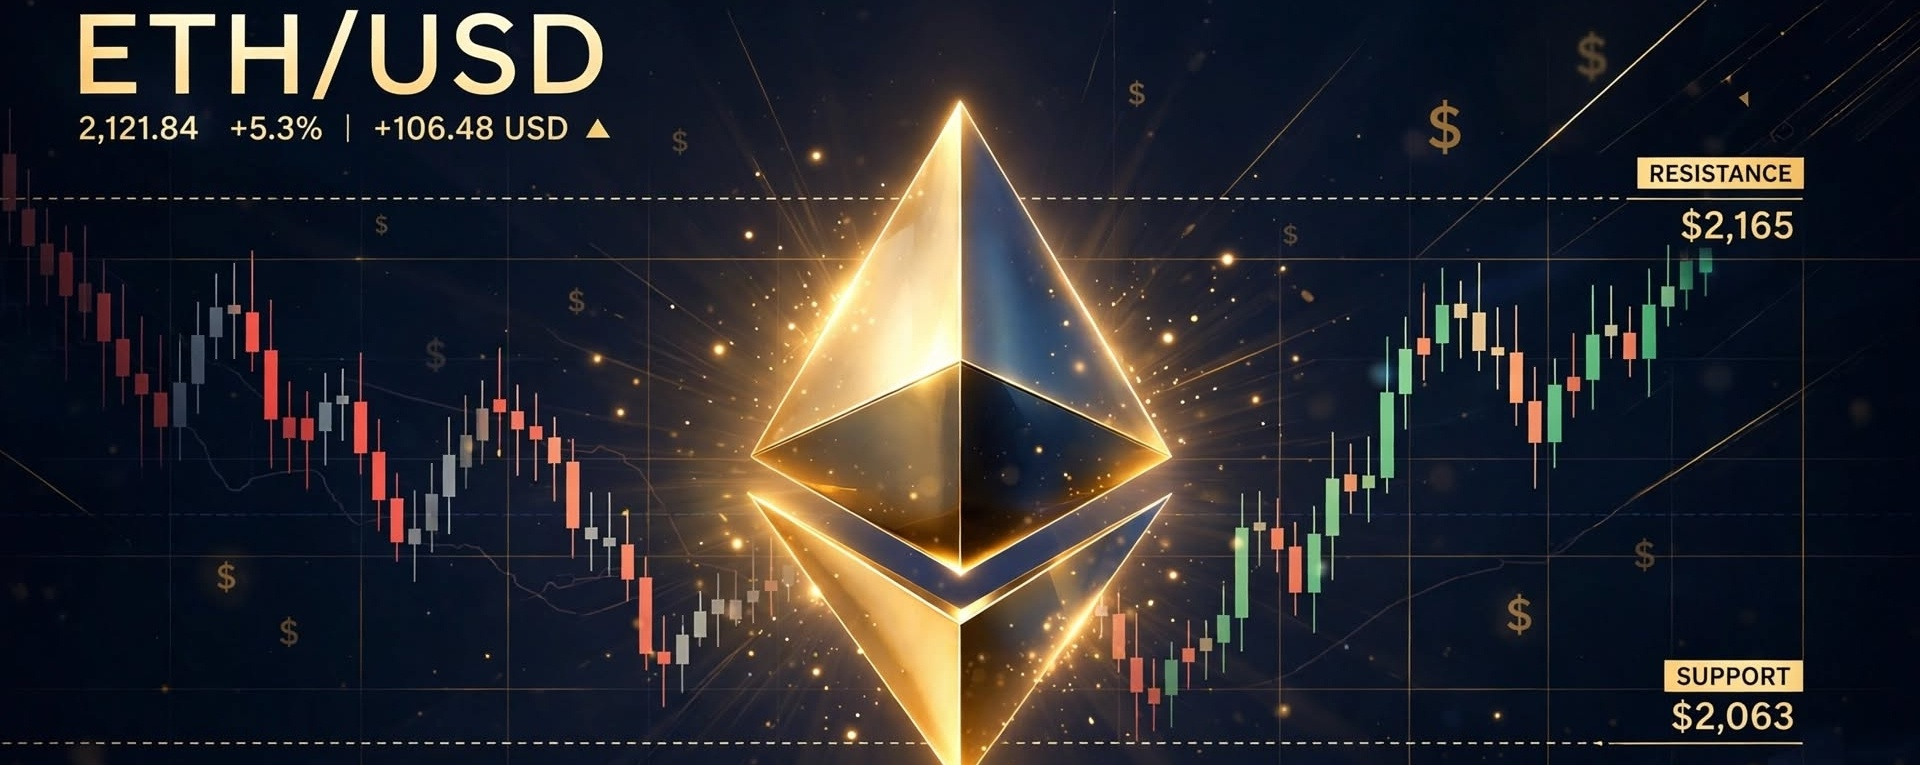

$ETH / USD - Complete Analysis
As of Nov 11, 2026 - Morning

1. Current Price Snapshot
Price: ~ $2,020 - $2,055
24h Change: -3.3% to -6.0% depending on exchange, after a sharp sell-off on Nov 10
Day Range: $2,006 Low / $2,133 High
Previous Close: ∼$2,126
Market Cap: ∼$258.25B
Circulating Supply: ∼122.2M ETH
Consensus: Proof-of-Stake
Performance:
5 sessions: -6.71%
1 Month: -17.7%
6 Months: -10.77%
Year-to-Date: -30.5%
1 Year: -38.91% / -43.2% on some feeds
1-Year Range: $1,567.50 (Jun 25, 2026 low) to $3,584.17 (Nov 9, 2025 high)
$ETH is in a clear medium-term downtrend in 2026, despite strong fundamentals.
2. Why Is It Falling Right Now?
a) Macro - US CPI:
ETH dipped below $2,100 on Monday as traders waited for the October US CPI report scheduled for Nov 10. Risk assets sold off into the data.
b) ETF Outflows:
Recent ETH spot ETF net outflows totaled $365.3M, even as large holders accumulated. In October alone, spot Ethereum ETFs lost close to $1B, with one week seeing $320.1M outflows, 93.4% from BlackRock's ETHA.
c) Market Sentiment:
Fear & Greed reads 32 - Fear. AI signal on Nov 10 was Neutral 61%, while other signals flipped to HOLD leaning bearish / Sell.
3. Technical Analysis
Overall Bias: BEARISH short-term, OVERSOLD bounce possible
$ETH is trading below all key moving averages:
50-EMA: ∼$2,209
200-EMA / 200-day EMA: ∼$2,369 / $2,301
MA-20 (H4): $2,228, MA-50 (H4): $2,273
Price broke below the upward-sloping support trendline at $2,229
Momentum Indicators:
RSI: 23.8 - Deeply Oversold - This is extreme. Historically, RSI this low often leads to a short-term relief bounce, but not necessarily a trend reversal.
MACD: -53.38 - Death Cross confirmed, bearish momentum dominating
Bollinger Bands: Price at $2,022 inside band, lower band $2,010, upper band $2,306
Key Levels
| Type | Level | Importance |
| --- | --- | --- |
| Immediate Support | $2,030 - $2,044 | Nearest support, must hold today |
| Major Support | $2,063 | 30-day low / breakdown level. Daily close under this = next leg down |
| Strong Support | $1,949 - $1,950 | Next major demand zone if $2,063 breaks |
| Deep Support | $1,849 / $1,800 / $1,567 | $1,849 is next target after $2,063 break, $1,567 is 2026 low |
| Immediate Resistance | $2,100 - $2,165 | Nearest resistance + Ichimoku Kijun at $2,161 |
| Major Resistance | $2,174 - $2,229 | Breakdown point, reclaim needed to turn bullish |
| Strong Resistance | $2,370 - $2,390 / $2,580 | 200-EMA zone + 30-day high |
Sources: Nearest support $2,030 and resistance $2,100 as of Nov 10, 23:00 UTC, support at $2,063 and resistance at $2,174 on 1D, projected range $1,955 to $2,304.
4. Fundamentals - Why Long-Term Is Different From Price
This is the divergence in ETH right now: Price is bearish, fundamentals are the strongest ever.
a) Staking Supply Squeeze:
~ 30% - 35.86M ETH is now staked, locking away nearly 30% of total supply. Staking crossed 30.1% in early Feb 2026. That ETH cannot be sold easily.
b) Staking ETFs - Game Changer:
SEC cleared staking structures in Jan 2026
BlackRock launched ETHB, first major US staking-enabled ETH ETF on Nasdaq in March 2026, distributing 1.9-2.2% net annual yield monthly, planning to stake 70%-95% of holdings
Fidelity filed to stake 100% of its ETF holdings
Validators earning ∼2.8% in rewards
c) Upgrades:
Pectra (May 2025): Max validator balance 32 ETH -> 2,048 ETH
Fusaka (Dec 3, 2025): Major scalability upgrade
Glamsterdam (Live late May 2026): Pushed L1 to ATH daily transactions, slashed gas fees by ∼78%, aims for 10,000 TPS
Hegota: Scheduled for 2027, focused on privacy + post-quantum security
d) Institutional Flows YTD:
Despite recent outflows, ETPs tracking ETH drew $12.7B net inflows YTD in 2026, with US spot ETFs accounting for $12.4B.
e) Dominance:
ETH still dominates DeFi / RWA tokenization, with ∼$70B in TVL, and is the leading chain for tokenization.
5. Scenarios
Bullish Scenario (30% probability short-term):
Hold $2,030-$2,063 -> Bounce to $2,165 -> Reclaim $2,229 -> Target $2,370-$2,390, then $2,580
Trigger: Better-than-expected CPI, ETF inflows return, RSI oversold bounce.
Bearish Scenario (50% probability short-term):
Daily close below $2,063 -> Drop to $1,949 -> If that breaks, $1,849, then $1,800
Trigger: Hot CPI, continued ETF outflows, Bitcoin weakness.
Sideways Scenario (20% probability):
Chop between $2,030 - $2,165 for next 3 days. Projected range from analysts: $2,026 to $2,265 / $1,955 to $2,304.
6. What To Watch
Daily close vs $2,063 - The single most important level this week
US CPI reaction - Already released Nov 10, market digesting it
ETF flows - Are outflows slowing or accelerating?
Bitcoin dominance - ETH rarely rallies alone when Bitcoin is weak
Staking queue - More ETH entering staking = less sell pressure
7. Bottom Line
Short-term (days-weeks): Bearish + Oversold. ETH is beaten down, RSI at 23.8 suggests a bounce is due, but trend is down until it reclaims $2,174-$2,229.
Medium-term (months): Neutral to Cautiously Bullish. If $1,949 holds, the combination of 30% staked supply + staking ETFs + Glamsterdam low fees creates a strong supply squeeze setup.
Long-term (2027+): Bullish on fundamentals. The network has never been stronger technically, but price needs macro + ETF flows to turn.
This is not financial advice. Crypto is highly volatile. Never invest more than you can afford to lose, and consider DCA instead of lump-sum buying at these levels.
#Ethereum #ETHUSDT #ETHAnalysis #TrendingPredictions #viralpost