

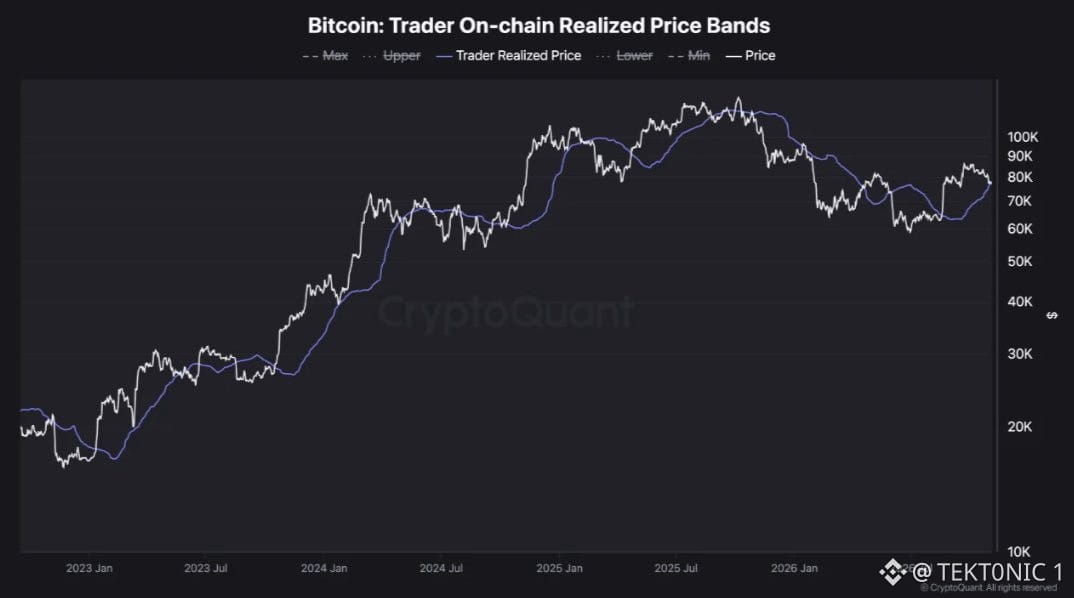
bitcoin is testing the trader realized price, the average cost basis of coins that last moved one to three months ago. this metric isolates the acquisition price of relatively recent market participants. when $BTC stays above the level in a constructive structure, pullbacks toward it have often found support because traders near breakeven have little reason to sell. if price loses the level, those same participants move underwater, and the cost basis can later flip to resistance as they exit on a return to break-even. cryptoquant’s chart shows the gap between price and the trader realized price has narrowed sharply during the recent pullback. the line has continued to rise while $BTC corrected, so the two are now converging around the high-$70,000s. the outer bands mark fixed profit and loss margins around this central cost basis, with the upper band historically linked to elevated profit-taking. holding the trader realized price would indicate that the average cost basis of recent participants is still functioning as support. a sustained break below it would put those buyers into unrealized losses and change how the level is likely to be treated. the reaction around this area will show whether current demand is absorbing supply near recent cost basis. #BTC Price Analysis# #Bitcoin Price Prediction: What is Bitcoins next move?# $XRP
Bergabunglah dengan pengguna kripto global di Binance Square
⚡️ Dapatkan informasi terbaru dan berguna tentang kripto.
💬 Dipercayai oleh bursa kripto terbesar di dunia.
👍 Temukan wawasan nyata dari kreator terverifikasi.
Email/Nomor Ponsel