
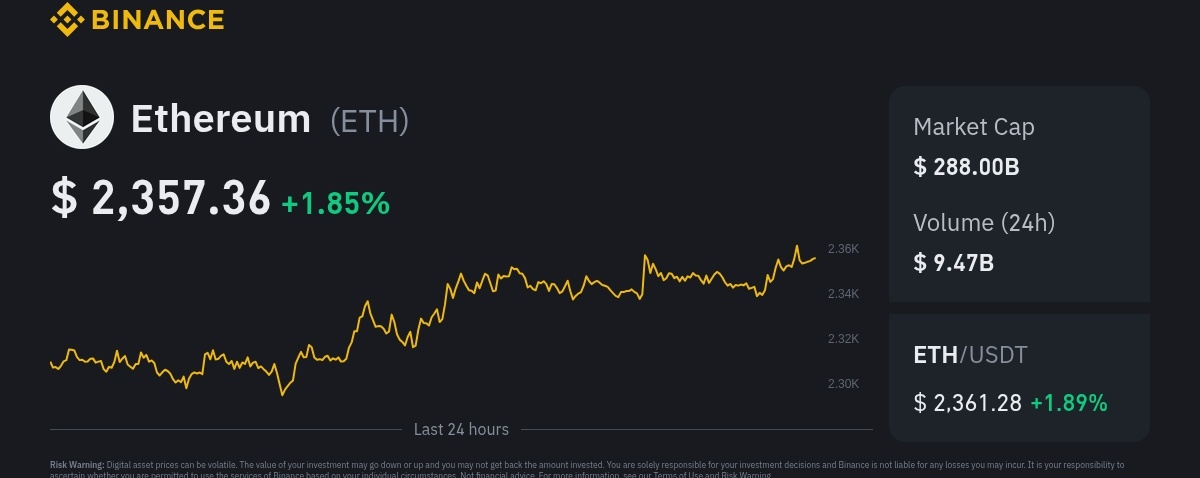

$ETH /USD Analysis — November 4, 2026
Ethereum · Intraday and short-term technical outlook

$ETH Ethereum is showing short-term bearish momentum, with the price around $2,280–$2,290 in recent market data. The price is below important short-term moving averages, while momentum indicators suggest sellers remain in control. Borearis +1

### $2,287
Approximate reference price; verify your exchange for the live quote.
Short-term bearish
### 1\. Key support and resistance levels
| Level | Price (USD) | Significance |
| --------------- | ----------- | ------------------------- |
| Resistance 3 | $2,361 | Stronger breakout level |
| Resistance 2 | $2,343 | Near-term resistance |
| Resistance 1 | $2,314 | Immediate pivot |
| Reference price | $2,287 | Current market area |
| Support 1 | $2,224 | Immediate support |
| Support 2 | $2,207 | Secondary support |
| Support 3 | $2,188 | Important downside target |
These levels are based on a technical snapshot updated November 4, 2026. Borearis
### 2\. $ETH /USD trading scenarios
Bullish scenario — Buy setup
If ETH breaks above $2,314 and holds that level with strong buying volume:
* Target 1: $2,343
* Target 2: $2,361
* Bullish confirmation: sustained move above $2,361
Bearish scenario — Sell setup
If ETH breaks below $2,224 and fails to recover:
* Target 1: $2,207
* Target 2: $2,188
* Further weakness could expose lower support zones.
Sideways scenario
If ETH stays between $2,224 and $2,314, expect possible consolidation until a confirmed breakout or breakdown.
### 3\. Technical indicators
* RSI: Recent readings around 37–39 suggest weak momentum, approaching oversold territory but not necessarily signaling a reversal.
* Moving averages: ETH remains below its 50-day moving average, indicating short-term selling pressure.
* MACD: Bearish momentum remains a concern.
* Bitcoin correlation: A sharp BTC decline could increase downside pressure on ETH.
Borearis +1
### 4\. My trading plan
| Setup | Confirmation | Potential target |
| ----- | ------------------------------ | --------------------- |
| Buy | Break and hold above $2,314 | $2,343–$2,361 |
| Sell | Break below $2,224 | $2,207–$2,188 |
| Wait | Price remains inside the range | Wait for confirmation |
Final outlook: ETH/USD is bearish in the short term while below $2,314. A break below $2,224 could open the way toward $2,207 and $2,188. A sustained recovery above $2,361 would improve the bullish outlook.
These are technical scenarios, not guaranteed outcomes. Use a stop-loss, manage position size car
efully, and confirm prices on your trading platform before entering a trade.