


Let's take a closer look at BTTC because the chart is showing something interesting!
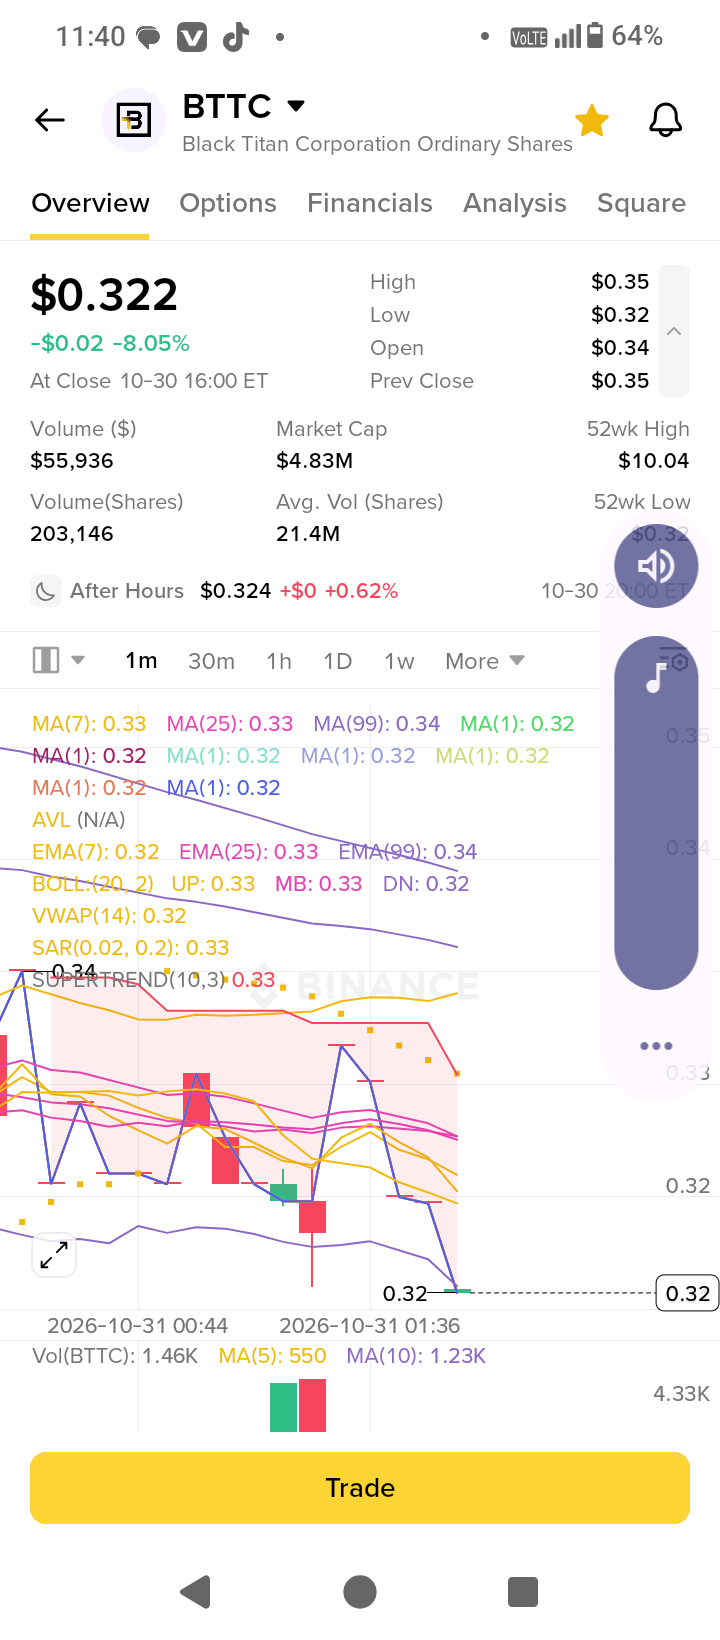
Black Titan Corporation (BTTC) is currently trading around $0.322, after a sharp 8.05% decline at the latest close.
📊 What the chart is telling us:
🔹 Current price: $0.322
🔹 After-hours: $0.324 (+0.62%)
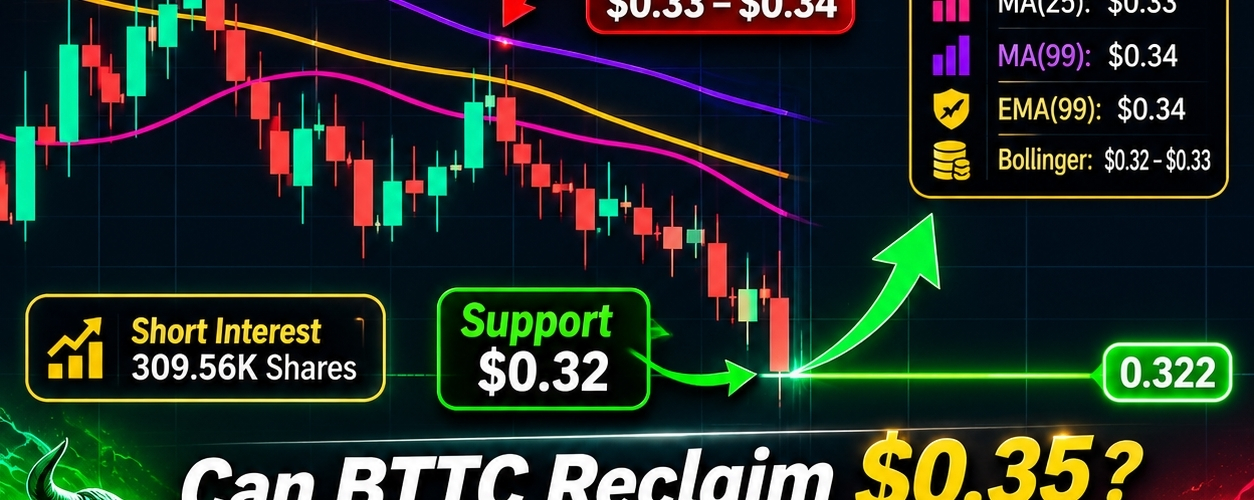
🔹 MA(7): $0.33
🔹 MA(25): $0.33
🔹 MA(99): $0.34
🔹 EMA(99): $0.34
🔹 Bollinger Bands: $0.32–$0.33
🔹 Short interest: 309.56K shares
📉 Technical Outlook:
Right now, BTTC is trading below its major moving averages, suggesting that sellers still have the upper hand.
🟢 Resistance to watch: $0.33–$0.34
🔴 Support to watch: $0.32
A strong move above $0.33 could be the first sign of recovery, while losing $0.32 may increase downside pressure.
🔥 Here's what I want to know:
Can BTTC reclaim $0.35 in the next few sessions, or are we looking at another bearish move?
👇 Bullish or Bearish? Tell me your target price in the comments!
Let's see who reads this chart correctly! 📈
#BTTC #TechnicalAnalysis #StockTrading #TradingSignals #MarketWatch