$HYPE MARKET UPDATE: The Rally Is Cooling Off. What's Next?
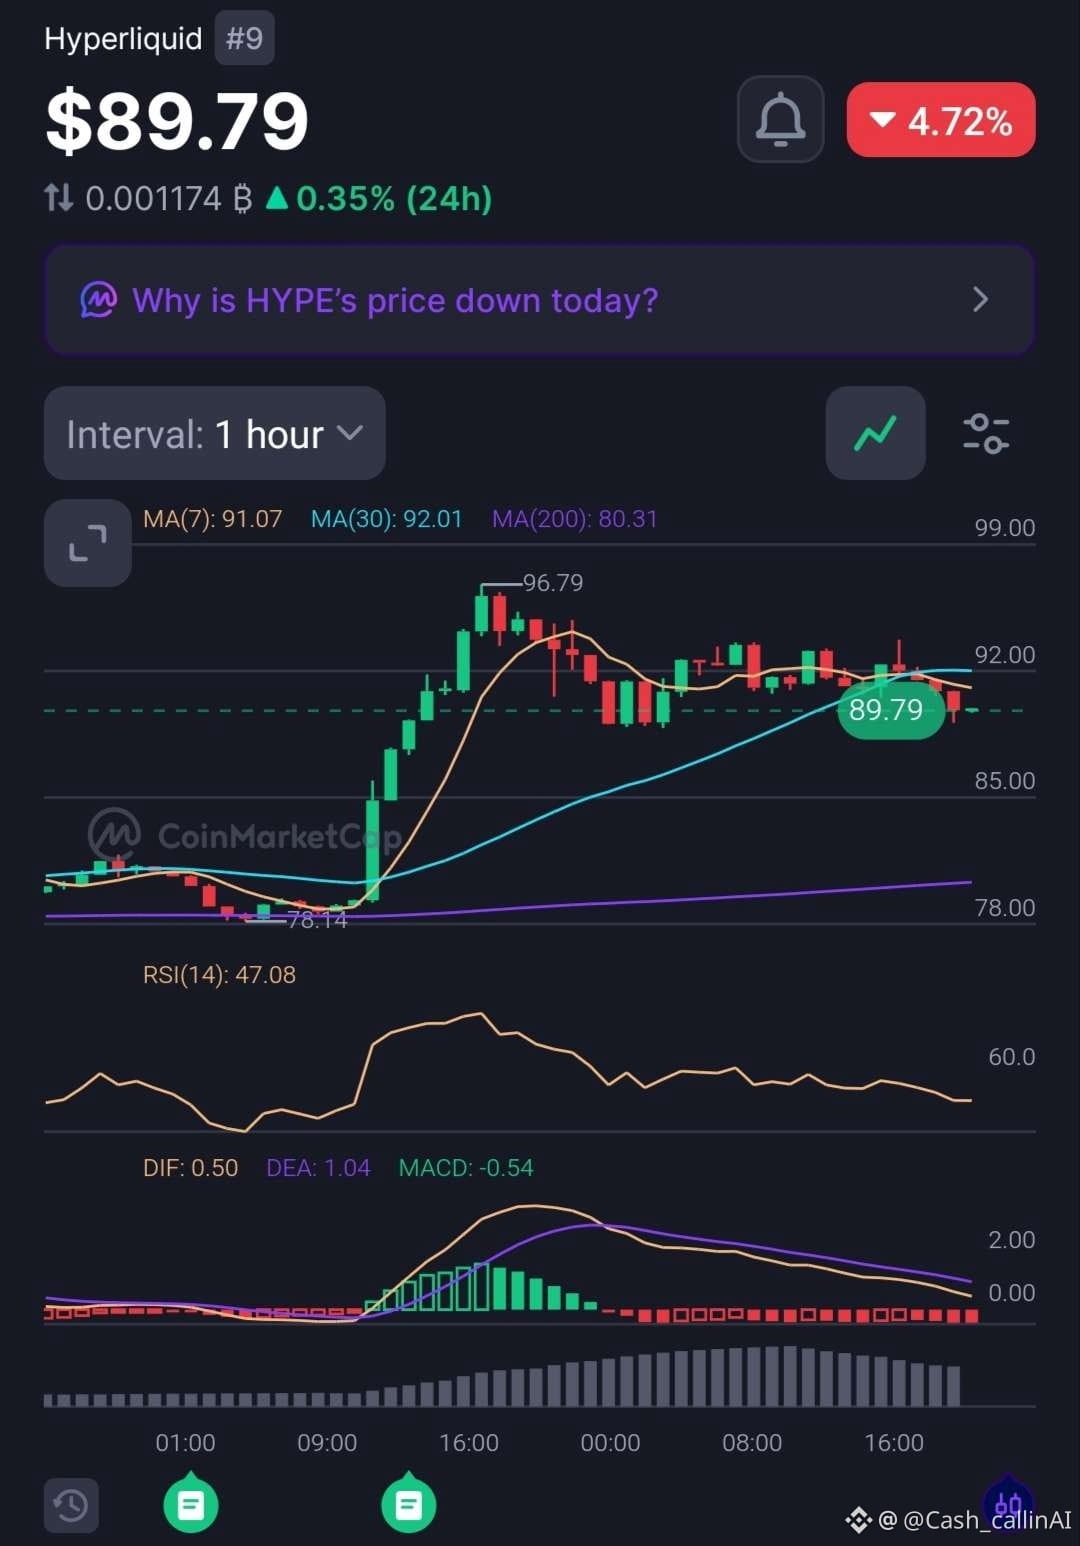
Hyperliquid ( $HYPE) is trading around $89.79 on this chart snapshot, down approximately 4.72% over 24 hours. After its sharp rally from the $78 area to a recent high of $96.79, price is now showing signs of consolidation and weakening short-term momentum.
Here is what I'm watching on the 1-hour chart:
📉 Moving averages: Price is below the 7-period MA at $91.07 and the 30-period MA at $92.01. Both levels are potential overhead resistance until price reclaims them.
📊 RSI: 47.08. Momentum is close to neutral but slightly below the 50 midpoint, suggesting buyers have not established clear short-term control.
🔻 MACD: -0.54. The negative reading points to bearish momentum after the previous rally. A change in momentum would need confirmation from subsequent candles.
🎯 Levels to watch:
• $91–$92: First reclaim zone.
• $96.79: Previous local high and potential upside test if bullish momentum returns.
• $85: An area to monitor if the current consolidation breaks lower.
• $80.31: The 200-period moving average, a longer-term reference on this chart.
My read: HYPE has pulled back from its recent high, but a pullback alone does not confirm a trend reversal. Reclaiming the short-term moving averages would strengthen the recovery case. Losing nearby support could expose lower levels.
I'm watching price confirmation, not guessing the next candle.
What matters next: Can $HYPE reclaim $91–$92, or will sellers maintain control?
CashCalling™ 📊
Hyperliquid ( $HYPE) is trading around $89.79 on this chart snapshot, down approximately 4.72% over 24 hours. After its sharp rally from the $78 area to a recent high of $96.79, price is now showing signs of consolidation and weakening short-term momentum.
Here is what I'm watching on the 1-hour chart:
📉 Moving averages: Price is below the 7-period MA at $91.07 and the 30-period MA at $92.01. Both levels are potential overhead resistance until price reclaims them.
📊 RSI: 47.08. Momentum is close to neutral but slightly below the 50 midpoint, suggesting buyers have not established clear short-term control.
🔻 MACD: -0.54. The negative reading points to bearish momentum after the previous rally. A change in momentum would need confirmation from subsequent candles.
🎯 Levels to watch:
• $91–$92: First reclaim zone.
• $96.79: Previous local high and potential upside test if bullish momentum returns.
• $85: An area to monitor if the current consolidation breaks lower.
• $80.31: The 200-period moving average, a longer-term reference on this chart.
My read: HYPE has pulled back from its recent high, but a pullback alone does not confirm a trend reversal. Reclaiming the short-term moving averages would strengthen the recovery case. Losing nearby support could expose lower levels.
I'm watching price confirmation, not guessing the next candle.
What matters next: Can $HYPE reclaim $91–$92, or will sellers maintain control?
CashCalling™ 📊