

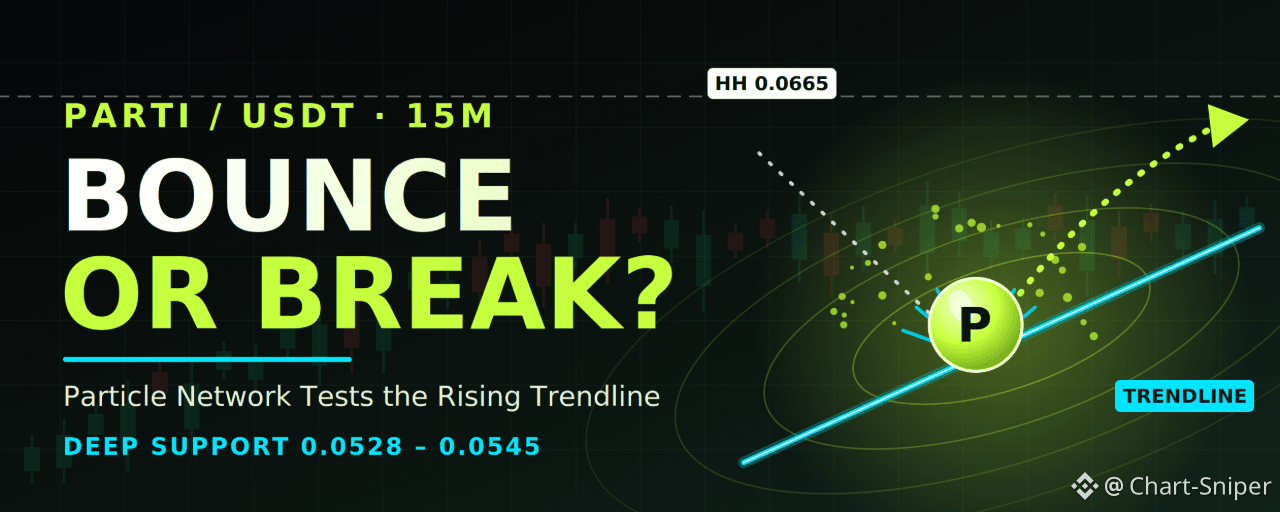


Chart: PARTI/USDT, 15m, Binance spot. Last price 0.0586 (−0.34%). Time: Oct 29, 20:55 UTC.
Short answer: a bounce is plausible, but this is a high-risk setup. PARTI has roughly doubled in a few hours and is now sitting on its rising trendline. That trendline is where the next move gets decided.
What the chart shows
PARTI traded flat around 0.039 for hours, then dumped about 20% in one candle to a Lower Low near 0.031 around 13:30 UTC. From there it staged a huge rally:
Reversal impulse: price climbed from about 0.031 to a Higher High near 0.0665 by 18:30, taking out the earlier Lower High near 0.049 on the way.
Rising trendline: the rally has respected a steep ascending line, and price is sitting right on it at 0.0586.
Consolidation: since the high, PARTI has ranged between about 0.0568 and 0.061, with small-bodied candles and a recent red one. That is a pause, not a clear reversal.
Retracement levels: measured from the 0.0665 high to the 0.031 low, they sit at about 0.0528 (38.2%), 0.0486 (50%) and 0.0444 (61.8%).
Bullish FVGs: stacked gaps sit between roughly 0.048 and 0.055, with more unfilled gaps lower down around 0.033–0.036.
Note that the price axis on this chart is logarithmic, so my level readings are close approximations. Verify exact levels on your own screen.
Will it bounce?
Reasons for a bounce:
Price is holding the ascending trendline, and each dip so far has been bought. The 19:20 wick touched about 0.0527, right at the 38.2% fib, and recovered.
Several bullish FVGs sit underneath, so there is demand layered below.
Reasons for caution:
A roughly 2x move in hours is parabolic. Moves like that often retrace 50% or more before any continuation.
The trendline is very steep, so it is easily broken and gives little cushion.
Recent candles near the line are small, which suggests momentum is fading, not building.
This is a small-cap token. My search found it trading around $0.029 on October 18 with a market cap near $6.8M, so liquidity is thin and moves can be violent. I found no news catalyst behind today’s surge.
So a short-term bounce off the line is possible, but the bigger risk is a deeper pullback.
Trade plan (long bias, small size)
Setup A: trendline bounce
Trigger: a 15m candle close above 0.0595 after holding the line
Entry zone: 0.0575–0.0590
Stop loss: 0.0558, below the recent swing low and the trendline
TP1: 0.0612
TP2: 0.0665, the Higher High
TP3: 0.0700
Setup B: deeper pullback entry (preferred)
Entry zone: 0.0528–0.0545, the 38.2% retracement inside the FVG
Stop loss: 0.0495, below the lower FVG, and above the 50% level
TP1: 0.0586
TP2: 0.0665
TP3: 0.0700
Setup C: breakout entry (smaller size)
Entry: a 15m candle close above 0.0665, ideally with a retest as support
Stop loss: 0.0630
Targets: 0.0700, then 0.0750, then 0.0800
Measured from 0.0580 to the 0.0558 stop, Setup A pays about 1.5R at TP1 and about 3.9R at TP2. Setup B, from 0.0535 to the 0.0495 stop, pays about 1.3R at TP1 and about 3.3R at TP2. After the first target, move the stop to breakeven.
What invalidates the idea
A 15m close below the trendline and 0.0558 means the bounce failed. Expect a move to 0.0528.
A close below 0.0486 (the 50% level) means the rally is failing, with 0.0444 and the unfilled gaps near 0.033–0.036 as lower targets.
A strong rejection at 0.0665 followed by a lower high would show the surge is exhausted.
Live cross-check
I searched for a live PARTI price. Most pages were stale or forecast-style pages, but dated figures I found, $0.0346 on October 7 and $0.02925 on October 18, are consistent with the chart’s pre-surge base near 0.031. I could not find a quote for today’s trading, so I used the timestamped Binance chart price of 0.0586 as the reference. Confirm the current price on Binance before entering. On a thin 15m chart, levels can shift in minutes.
Bottom line
Will it bounce? Possibly, at the trendline, but don’t count on it. Entry is safer on a confirmed close above 0.0595, or better, on a deeper pullback to 0.0528–0.0545. Keep size small, because a near-doubling in hours can reverse just as fast. A 15m close below 0.0558 cancels the trendline idea.
⚠️ Disclaimer: This is not financial advice. This analysis is for educational and informational purposes only. Crypto markets are highly volatile, and you can lose your capital. Always do your own research, manage your risk, and never trade with money you can’t afford to lose.
@Binance Square Official #FedWatch #EarningsSeason #USMidtermElections #Binance #ChartSniper