

Pair: DEEP/USDT Perpetual | Timeframe: 1H | Exchange: Binance | Chart date: Oct 14–15, 2026 (UTC)
Market Overview
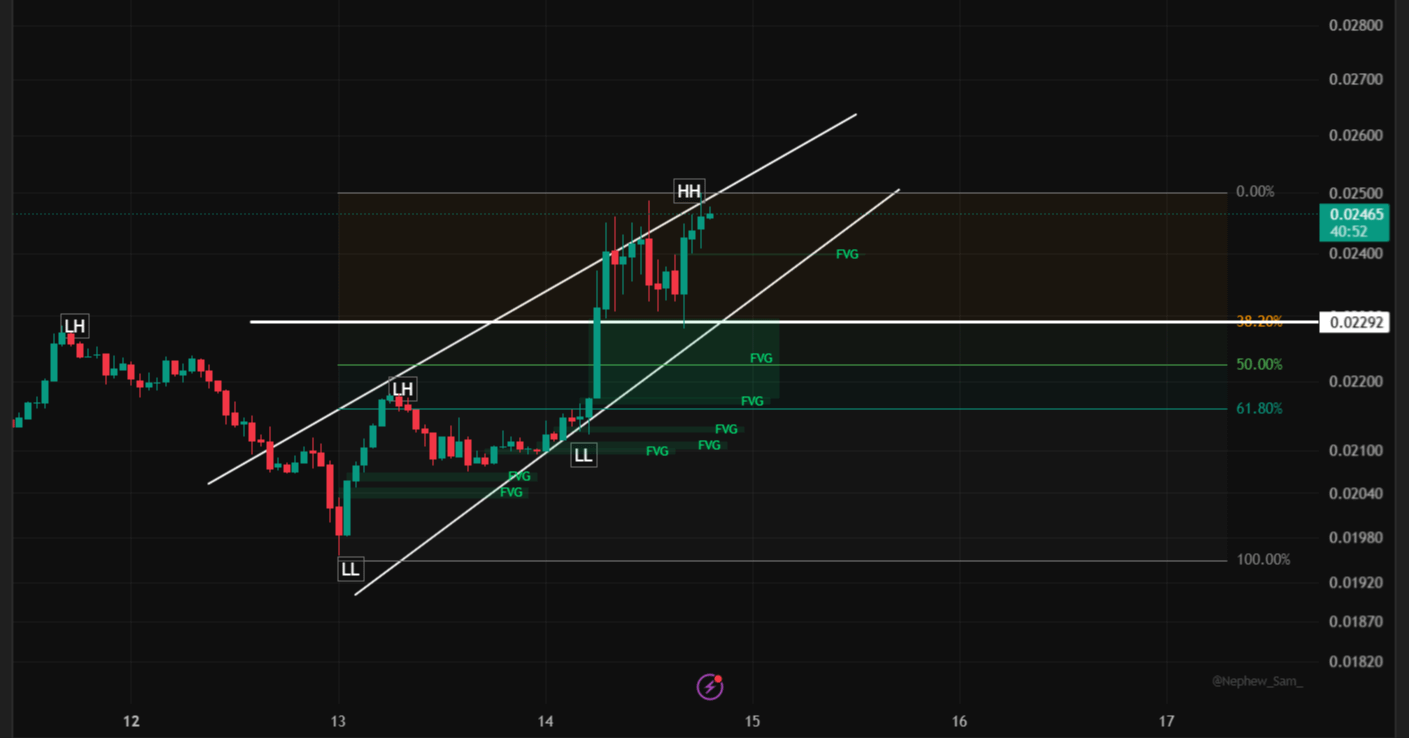
DEEP/USDT is trading around 0.02470, having just printed a fresh higher high (HH) near 0.02500 after an explosive multi-day rally. The pair bottomed out at a lower low (LL) near 0.0198 on Oct 13, then reversed sharply, clearing a sequence of lower highs (LH) on the way up and breaking into a steep ascending channel. The structure has flipped firmly bullish, and price is now consolidating just under the recent high after the impulsive move.
Beneath current price, the chart shows several Fair Value Gaps (FVGs) — unfilled imbalance zones left behind during the rally — stacked between roughly 0.0204 and 0.0240. These gaps are the first places price is likely to react to if it pulls back, since they often get revisited before a trend continues.
Key Observations From the Chart
1. Clear trend reversal. The move from the LL at 0.0198 through a series of LH breaks and into a new HH at 0.0250 confirms buyers have taken control. The rising channel (the two white trendlines) has held cleanly throughout the move.
2. Resistance at 0.02500. This is the most recent swing high and the 0% Fibonacci anchor. A clean break and hold above this level would signal continuation rather than exhaustion.
3. Fair Value Gaps as support. The chart marks multiple FVG zones beneath price, roughly between 0.0204 and 0.0240. The nearest and most relevant one sits just below the breakout candle, around 0.0225–0.0240 — this is the first real support test on any pullback.
4. Fibonacci retracement zone. Measured from the recent impulsive swing, the key levels are:
38.2% near 0.02292
50% near the low 0.0220s
61.8% near the 0.0218 area
These levels overlap closely with the FVG zones, reinforcing them as a confluence support area.
5. Momentum is strong but extended. The rally has been fast and nearly vertical in places. After such a move, a period of consolidation or a retracement into support is common before the next leg, rather than an immediate continuation.
Trade Scenarios
Scenario A: Buy the Retracement Into the FVG Zone (Preferred)
Let price pull back into the unfilled gap and Fibonacci confluence zone before buying, rather than chasing the current high.
Entry zone: 0.02400 to 0.02290
Stop-loss: 0.02180 (below the 61.8% level and the FVG cluster)
Take-profit 1: 0.02470 (recent consolidation area)
Take-profit 2: 0.02500 (swing high)
Take-profit 3: 0.02650
Scale into the zone across a few entries, and move your stop to breakeven once TP1 is reached.
Scenario B: Breakout Long
If price clears the recent high without a pullback, wait for a confirmed close rather than buying into resistance.
Trigger: A 1H candle close above 0.02520
Entry: On the close, or on a retest of 0.02500 as new support
Stop-loss: 0.02400
Take-profit 1: 0.02650
Take-profit 2: 0.02800
Take-profit 3: 0.03000
Scenario C: Bearish Invalidation
If price breaks back below the FVG support cluster, the rally is likely losing steam and a deeper correction becomes the priority.
Trigger: 1H close below 0.02150
Short entry: On a retest of 0.02150–0.02180 from below
Stop-loss: 0.02280
Take-profit 1: 0.02040
Take-profit 2: 0.01980 (the LL)
Take-profit 3: 0.01930
Risk Management Tips
Risk only 1% to 2% of your account per trade.
DEEP has shown very fast, impulsive candles — keep leverage conservative (3x to 5x at most).
Avoid chasing green candles into resistance; let price come back to your planned entry zone.
Always set your stop-loss the moment you open a position.
Watch Bitcoin and overall market sentiment — fast-moving altcoins like this one can reverse quickly if the broader market turns risk-off.
Conclusion
DEEP/USDT has staged a powerful reversal off its recent low and is now testing fresh highs near 0.0250. A healthy pullback into the 0.0229–0.0240 Fair Value Gap and Fibonacci zone would offer the best risk-adjusted entry for trend continuation, while a confirmed close above 0.0252 would open the door toward 0.0280 and beyond. A break back below 0.0215 would be the clearest sign the move is losing momentum.
Disclaimer: This article is for educational and informational purposes only and is not financial advice. Cryptocurrency and derivatives trading carry a high risk of loss, and you can lose more than you expect, especially with leverage. Entry, stop-loss and target levels are based on chart analysis and are not guaranteed. Always do your own research and only trade with money you can afford to lose.
@Binance Square Official #CPIWatch #EthereumDropsBelow$2500 #StriveBuys3311BTCFor$280M #BINANCE #ChartSniper