
━━━━━━━━━━━━━━━━━━━━
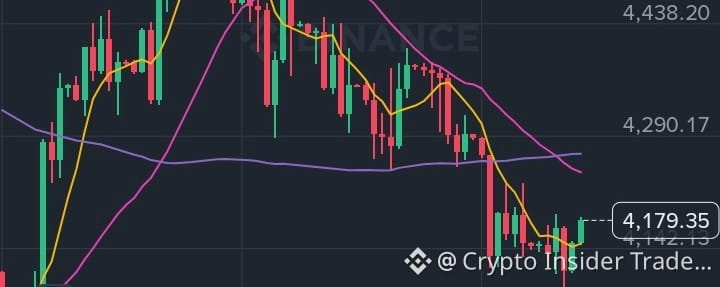
Gold hit a record near $5,589 in January. Today it trades around $4,178. That is a drop of roughly 25% in under nine months.
So is this a bargain zone, or just a pause before more pain? Let's break it down with data, not hype.
━━━━━━━━━━━━━━━━━━━━
◆ ① WHERE PRICE STANDS NOW
✔︎ Price: about $4,178 (+1.09% today)
✔︎ Day range: $4,110 – $4,184
✔︎ Spot gold closed near $4,110 on Oct 7, its lowest level since early August
✔︎ Peak on the daily chart: about $4,700
Today's green candle is a bounce after a rough week. One candle is not a trend change.
━━━━━━━━━━━━━━━━━━━━
◆ ② WHAT THE DAILY CHART SAYS
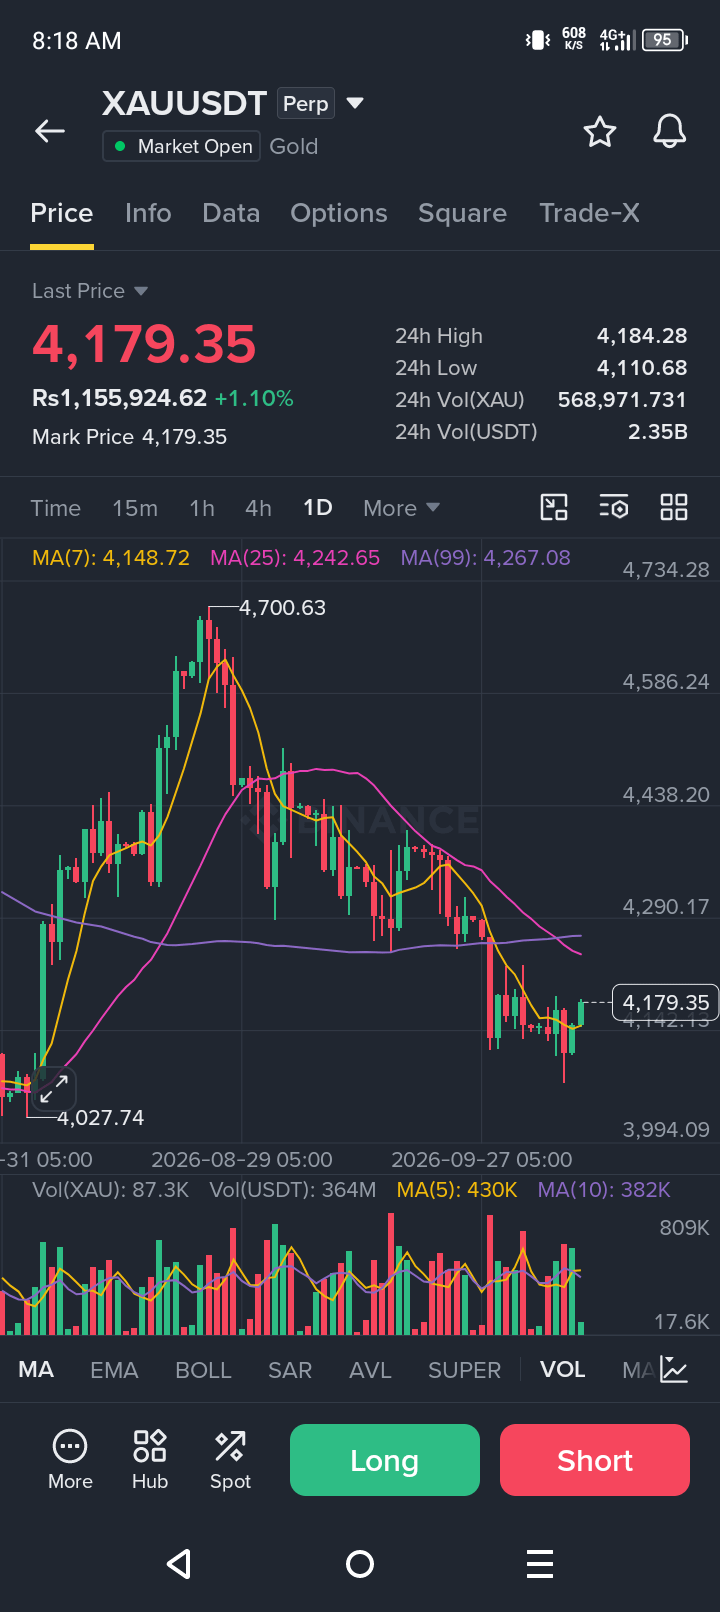
➤ MA5: about 4,142
➤ MA10: about 4,147
➤ MA20: about 4,212
Price has climbed back above the short-term MAs. But the 20-day average sits overhead and is still sloping down.
The chart shows lower highs and lower lows since the peak. Buyers are testing the waters, but the larger structure is still under pressure.
━━━━━━━━━━━━━━━━━━━━
◆ ③ WHY GOLD IS UNDER PRESSURE
① Higher yields
The US 10-year yield recently hit its highest level since 2002. Gold pays no interest, so high yields make bonds more attractive.
② Strong dollar
The dollar index is holding above 102. A stronger dollar makes gold more expensive for buyers abroad.
③ A hawkish Fed
The Fed raised rates by 25 bps in September. Markets lean toward a hold on Oct 27-28, but December hike odds remain high.
④ Fading war premium
Gold has lost more than 20% since the Middle East conflict began in late February. Higher inflation from the conflict has kept rates elevated, and that has outweighed safe-haven demand.
✔︎ One supportive factor: China's central bank has now bought gold for 23 straight months.
━━━━━━━━━━━━━━━━━━━━
◆ ④ KEY LEVELS TO WATCH
🔴 RESISTANCE
➜ 4,212 (MA20 zone)
➜ 4,300 (psychological level)
➜ 4,400 (previous support turned resistance)
🟢 SUPPORT
➜ 4,110 (today's low)
➜ 4,066 (recent intraday low)
➜ 4,020 – 4,030 (major chart floor)
━━━━━━━━━━━━━━━━━━━━
◆ ⑤ THREE SCENARIOS (EDUCATIONAL)
Recovery: A sustained daily close above the 20-day MA would suggest sellers are losing control.
Breakdown: A daily close below the 4,020-4,030 floor would signal that the downtrend is extending.
Range: If the Fed stays on hold and yields cool off, gold may simply chop between 4,100 and 4,300.
Watch Treasury yields, the dollar index and Fed commentary. They are moving gold more than any single candle.
━━━━━━━━━━━━━━━━━━━━
◆ ⑥ THE TRADER'S TAKEAWAY
✔︎ Trade what the chart shows, not what you hope will happen.
✔︎ Wait for confirmation instead of guessing tops and bottoms.
✔︎ Keep position sizes small when volatility is high.
✔︎ Risk management beats prediction every time.
Gold has humbled many traders this year. The ones who survive are the ones who plan for being wrong.
━━━━━━━━━━━━━━━━━━━━
◆ CONCLUSION
Gold is bouncing, but it is still below key resistance. The next moves will likely depend on yields, the dollar and the Fed. Stay patient and let the market show its hand.
What is your view on gold from here? Drop your thoughts in the comments!
Share this with a friend who trades gold.
Like and follow for more market breakdowns.
━━━━━━━━━━━━━━━━━━━━
#BitcoinDipsBelow$81K #xau #XAUUSD #GOLD $XAUT