




Bitcoin is approaching a crucial support area after another rejection near the upper boundary of its recent trading range. Buyers still have an opportunity to defend the structure, but short-term momentum is weakening.
Will support attract fresh demand—or become the starting point for another leg lower?
BTC analysis | October 7, 2026
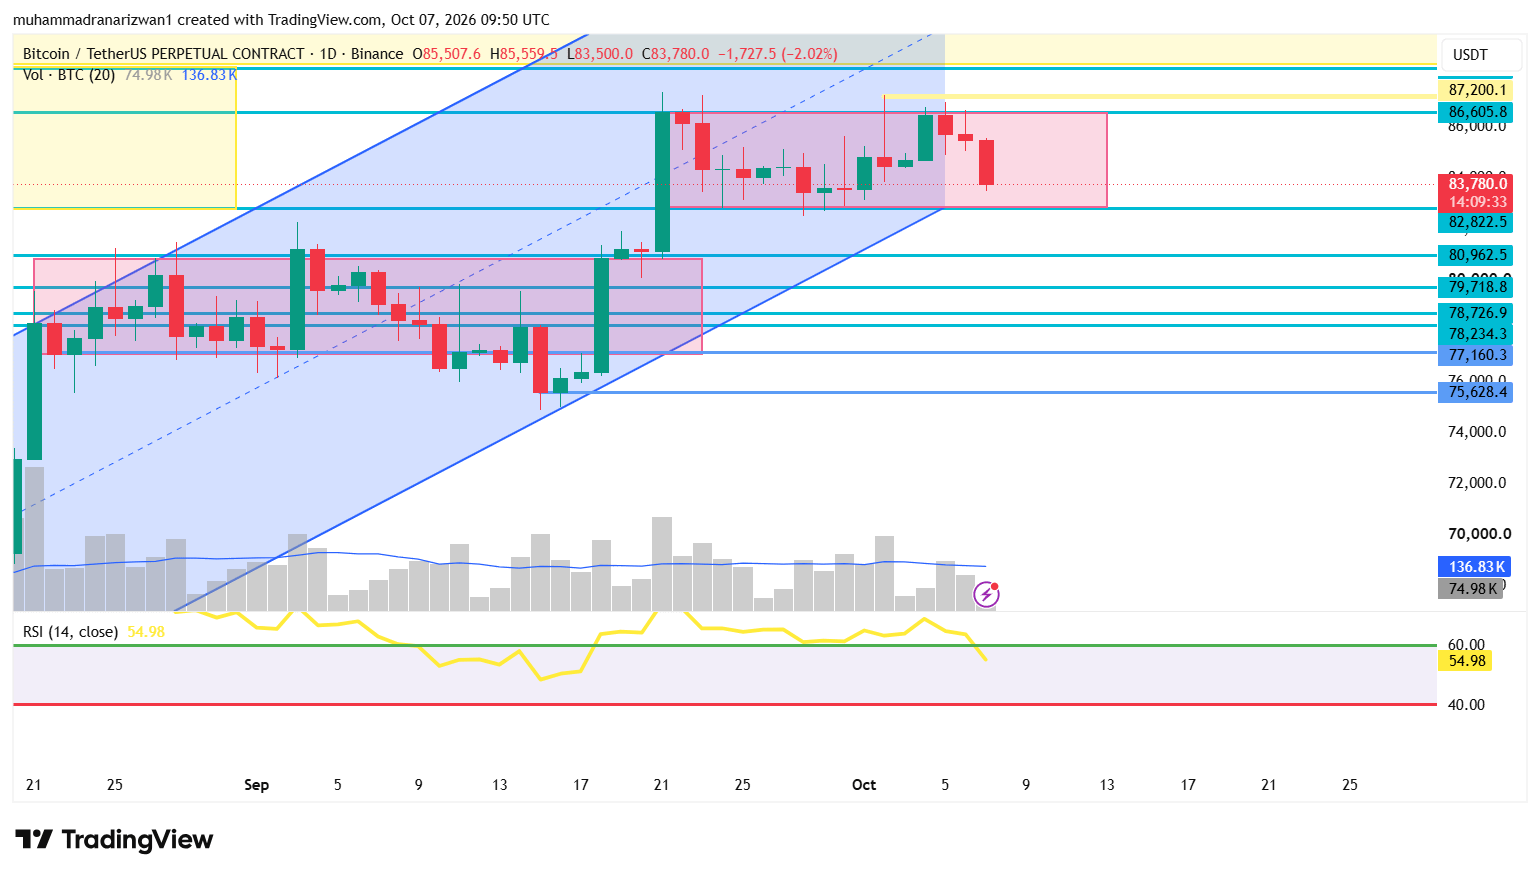
Based on the Binance BTCUSDT perpetual chart captured at 2:50 PM Pakistan time. Reference price: approximately $83,780. These are snapshot-based scenarios, not a live entry alert.
What is the chart telling us?
BTC is trading inside a broader consolidation between approximately $82,822 and $86,606, following September’s strong advance.
The latest attempt to push through the upper boundary failed to produce a sustained breakout. Price has since moved back toward the bottom of the range, with the current daily candle down approximately 2.02% at the screenshot time.
The earlier ascending channel is also under pressure. Price appears to be slipping below its projected lower boundary, suggesting that the pace of the previous advance is weakening.
However, the horizontal support at $82,822 has not yet broken decisively. Until that happens, a bearish continuation remains a scenario requiring confirmation.
Momentum: weak intraday, more balanced on the daily chart
The chart shows daily RSI near 54.98, while the supplied monitoring dashboard records:
4-hour RSI: approximately 36.25.
1-hour RSI: approximately 28.62.
This combination suggests short-term selling pressure within a daily structure that has not yet turned fully bearish.
An oversold hourly RSI can produce a relief bounce, but it does not confirm a bottom. During a sustained decline, RSI can remain oversold while price continues falling.
The daily candle is still open, so its closing price and final volume will matter more than the unfinished readings.
The levels that matter
BTC levelWhy it matters$86,606–$87,200Major resistance and breakout confirmation zone$87,399Upper liquidation reference in the supplied dashboard$84,800Near-term recovery checkpoint and dashboard liquidity reference$83,025–$82,971Nearby downside liquidation references$82,822Key horizontal range support$80,963Next major chart support after a confirmed breakdown$79,719Further downside support if selling accelerates
Liquidation estimates can change quickly. They identify areas to monitor; they do not guarantee that price will reach them.
Broader conditions call for patience
Today’s reporting describes pressure from a stronger dollar and rising Treasury yields, with traders also watching the Federal Reserve’s meeting minutes. These factors could increase volatility around technical levels.
The supplied dashboard also records positive BTC ETF flows. That is supportive context, but its flow reporting period is not clearly established, and positive flows alone do not confirm an intraday reversal.
Conditional trade signal 1: Breakdown and retest short
This setup becomes relevant only if BTC loses its range support.
Trigger: A 1-hour candle closes below $82,822, followed by a failed attempt to reclaim that level.
Potential entry zone: $82,750–$82,850, after rejection confirms.
Stop-loss: $83,350.
Take-profit 1: $81,800.
Take-profit 2: $80,963.
Take-profit 3: $79,719.
Using an illustrative entry of $82,800, the stop distance is $550 per BTC. Target two offers approximately 3.3:1 reward-to-risk before fees and slippage.
If BTC breaks support but immediately reclaims it and holds, the short setup loses validity. Avoid chasing a breakdown that has already moved far beyond the entry area.
Conditional trade signal 2: Recovery and retest long
A recovery trade requires buyers to regain control above the first meaningful checkpoint.
Trigger: A 1-hour close above $84,800, followed by a successful retest as support.
Potential entry zone: $84,800–$84,950.
Stop-loss: $84,200.
Take-profit 1: $85,800.
Take-profit 2: $86,606.
Take-profit 3: $87,200.
👆
At an illustrative $84,850 entry, target two offers approximately 2.7:1 reward-to-risk before costs.
An extension toward $87,399 becomes relevant only if buyers can establish acceptance above $87,200.
My outlook
The immediate bias is cautious and bearish while BTC remains below $84,800. A test of the $83,025–$82,822 area is a reasonable scenario, but the reaction there matters more than the first touch.
A sweep below support followed by a quick reclaim could trap late sellers. A sustained breakdown with a failed retest would strengthen the case for $80,963.
These setups are conditional alternatives—not simultaneous orders. Keep risk small, size positions around the stop distance, and reassess if price has already reached the targets before entry.
Educational market analysis, not personalized financial advice. Trading involves risk; no setup guarantees a profit.
#Bitcoin #BTC #BTCanalysis #cryptotrading #muhammadranarizwan