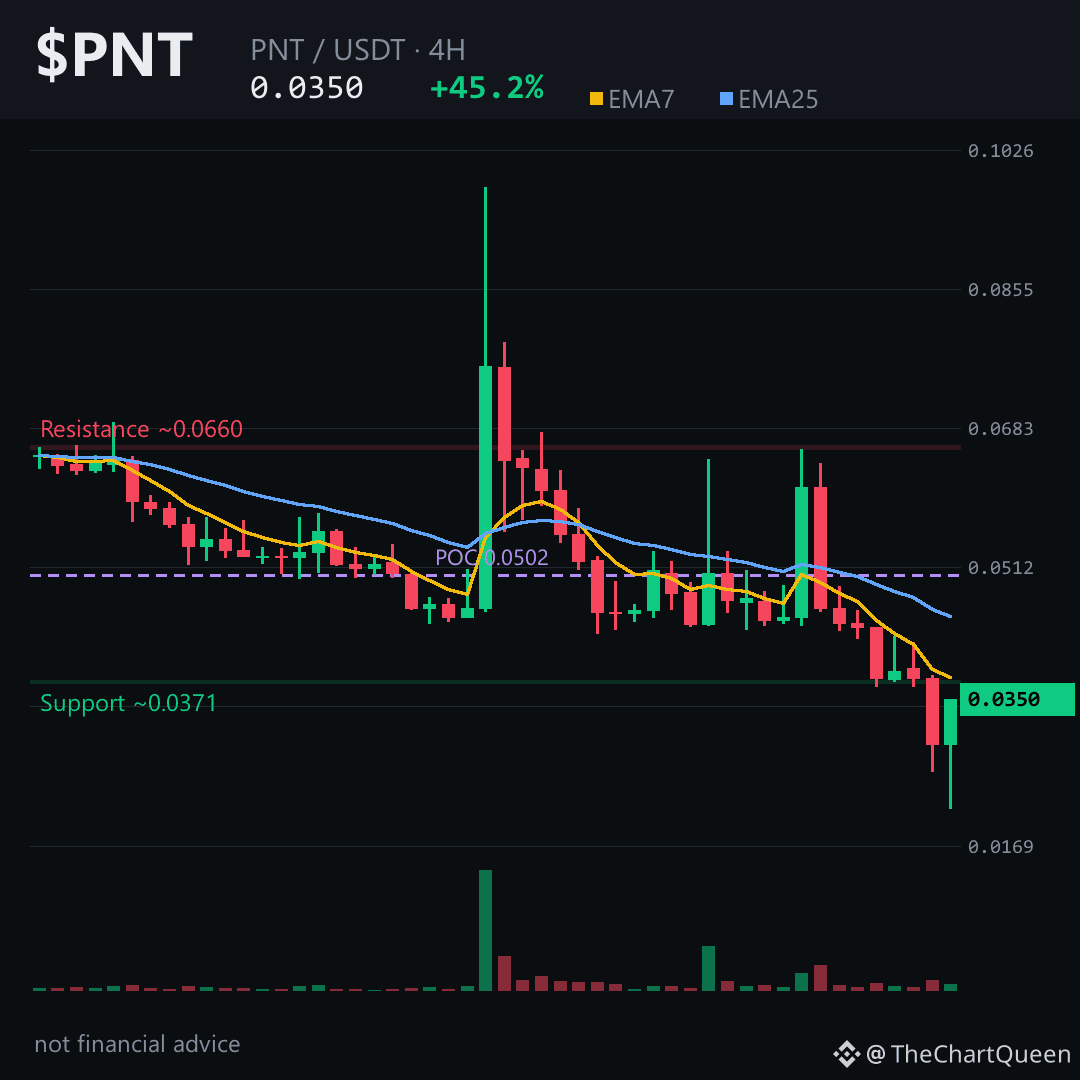
Why is a coin up 45% in a day, yet every timeframe I look at is screaming lower?
That’s the question I kept asking when I pulled up $PNT.
**The Read:**
This isn’t a pump with legs. It’s a violent bounce inside a bigger downtrend.
The 4-hour chart shows price still trading below both key moving averages — the short-term trend line and the longer one. That’s a classic bearish structure.
RSI is trying to recover from oversold, but it remains weak. No real futures volume behind this move either. Open interest is practically zero. This is spot-driven, thin, and fragile.
**The Levels That Matter:**
On the 4-hour picture, the area around 0.037 is the line in the sand.
If $PNT can’t reclaim that zone, the path of least resistance stays lower.
The next natural magnet sits near the 0.032 area — a prior consolidation pocket.
Lose that and the macro chart points toward the 0.022 region, which was the launchpad before this spike.
A close back above 0.037 flips the short-term read and puts 0.040–0.042 in focus.
**My read:**
This is a high-risk bounce, not a trend reversal. Until buyers prove they can hold above 0.037, I trust the downtrend more than the green candle.
I’ll revisit $PNT if that 0.037 area gets tested from below — follow along so the update finds you.
What’s the one level you’re watching on PNT?
⚠️ Not financial advice. DYOR.
#PNT #Penta #Crypto #BinanceSquare
That’s the question I kept asking when I pulled up $PNT.
**The Read:**
This isn’t a pump with legs. It’s a violent bounce inside a bigger downtrend.
The 4-hour chart shows price still trading below both key moving averages — the short-term trend line and the longer one. That’s a classic bearish structure.
RSI is trying to recover from oversold, but it remains weak. No real futures volume behind this move either. Open interest is practically zero. This is spot-driven, thin, and fragile.
**The Levels That Matter:**
On the 4-hour picture, the area around 0.037 is the line in the sand.
If $PNT can’t reclaim that zone, the path of least resistance stays lower.
The next natural magnet sits near the 0.032 area — a prior consolidation pocket.
Lose that and the macro chart points toward the 0.022 region, which was the launchpad before this spike.
A close back above 0.037 flips the short-term read and puts 0.040–0.042 in focus.
**My read:**
This is a high-risk bounce, not a trend reversal. Until buyers prove they can hold above 0.037, I trust the downtrend more than the green candle.
I’ll revisit $PNT if that 0.037 area gets tested from below — follow along so the update finds you.
What’s the one level you’re watching on PNT?
⚠️ Not financial advice. DYOR.
#PNT #Penta #Crypto #BinanceSquare