



SES AI stock surged 36% on Thursday, October 1, closing at $0.82. The rally pushed the price above short-term moving averages but left it below the 200-session EMA at $1.07. The clash between an explosive breakout and a deeper corrective phase now defines the setup.
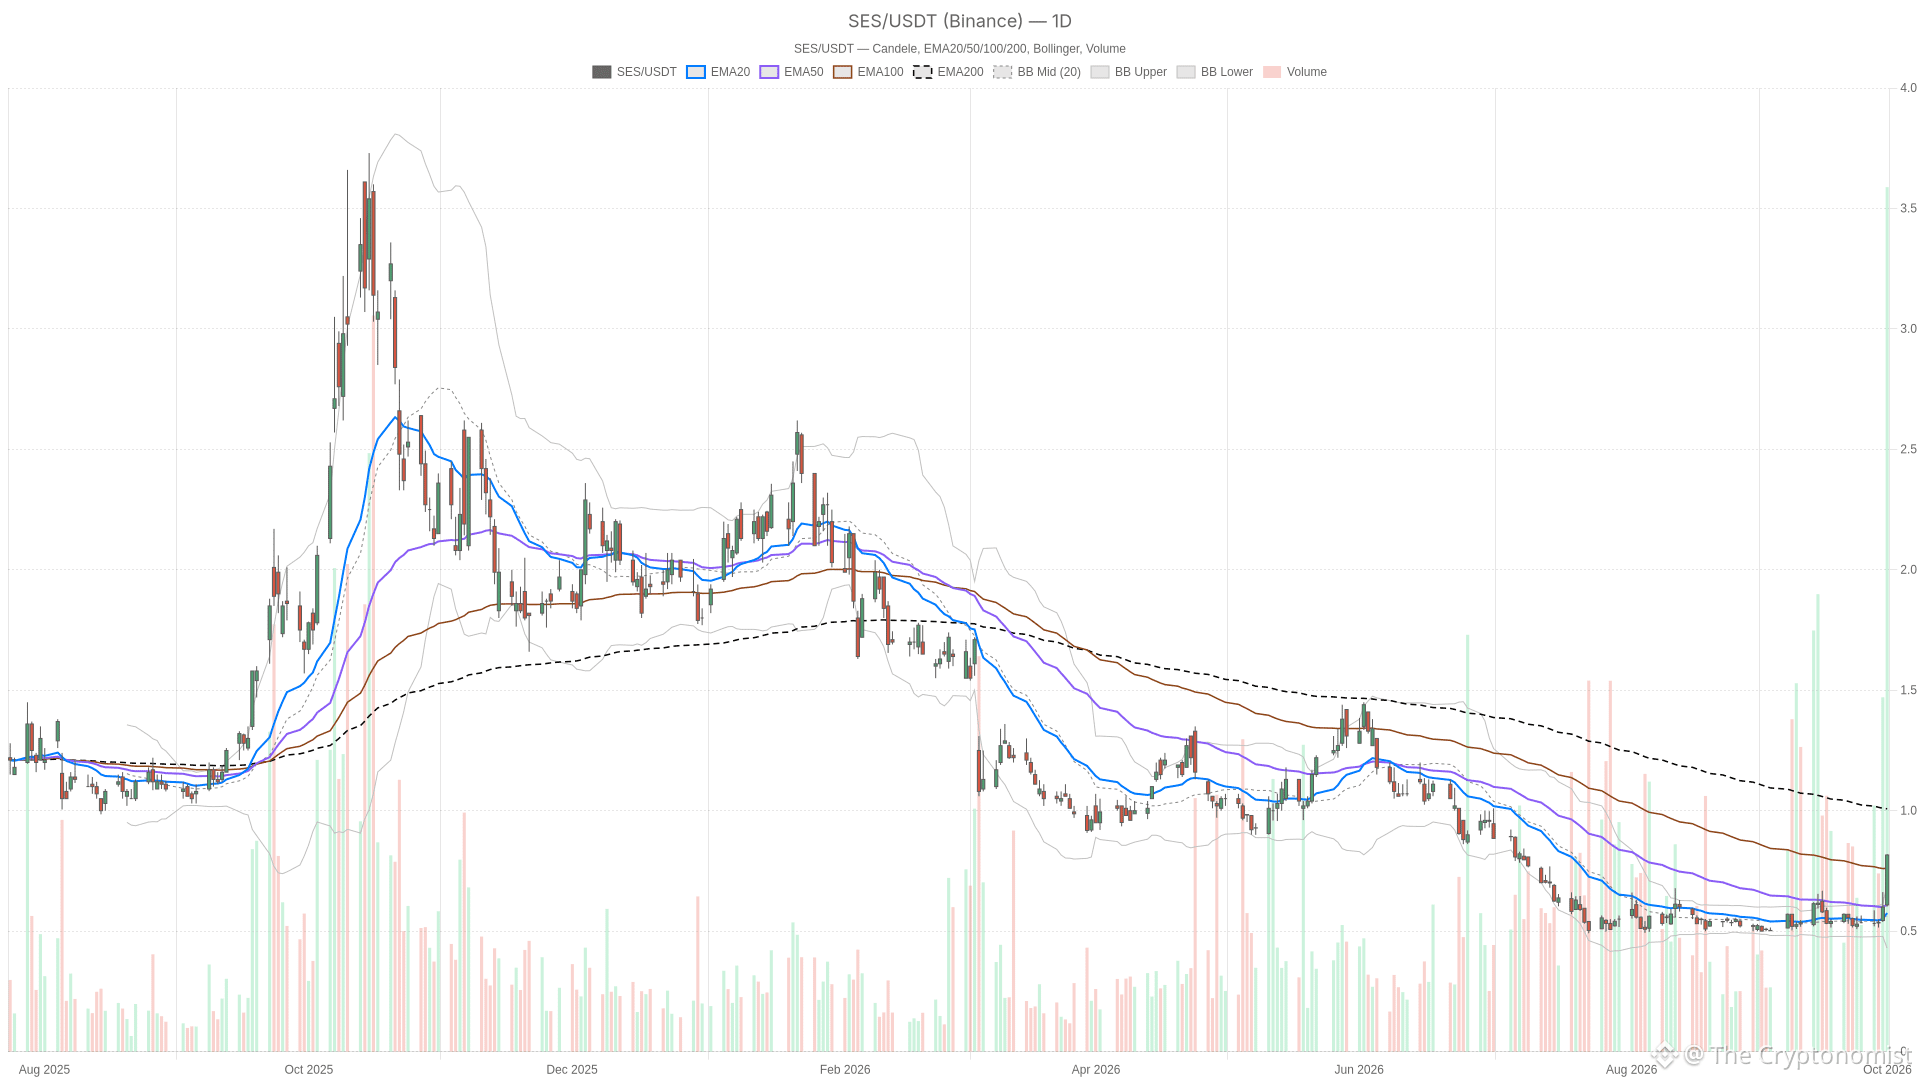 SES — daily chart with candlesticks, EMA20/EMA50 and volume.
Key takeaways
SES AI stock closed at $0.82 on Thursday, up 36% from the previous close of $0.60 on September 30.
The close sits above the 20-session EMA ($0.58) and 50-session EMA ($0.61) but remains below the 200-session EMA ($1.07).
The daily RSI reads 74.95, deep in overbought territory; the hourly RSI is even more stretched at 85.63.
Volume reached 80,740,900 shares during the session.
The daily pivot for the next session sits at $0.75, with first resistance at $0.89 and first support at $0.67.
SES AI Stock: A 36% Breakout Clashing With a Longer Downtrend
The daily candle itself tells a dramatic story. SES opened at $0.61, traded as high as $0.82, and closed right at the session high of $0.82. Volume came in at 80,740,900 shares. From open to close, the session added about 34%. Most of Thursday’s gain built up intraday rather than at the open.
Yet the position relative to its moving averages complicates a simple bullish read. The close at $0.82 sits above both the 20-session EMA at $0.58 and the 50-session EMA at $0.61. It remains below the 200-session EMA at $1.07. That combination points more to a sharp reversal inside a broader downtrend than to a freshly established uptrend.
Daily Chart: Overbought But Still Under the 200-Session EMA
Momentum readings on the daily chart back up the idea of a stretched move. The 14-day RSI reads 74.95, deep into overbought territory. The MACD line sits at 0.02, above its signal at 0.00. The positive histogram of 0.02 is a bullish signal. However, it is a modest one given the size of the rally. More tellingly, the close at $0.82 sits above the upper Bollinger band at $0.70. That is a level this stock does not often clear. The 14-day ATR of $0.07 reflects how much volatility has built into this single session.
Hourly and 15-Minute Charts: Bullish Alignment, Stretched Momentum
Hourly Chart: Bullish Alignment, Extreme RSI
The hourly chart confirms the short-term bullish push more cleanly than the daily one. Price sits above the 20-hour EMA at $0.67. That average sits above the 50-hour EMA at $0.61, which in turn sits above the 200-hour EMA at $0.57. The result is a bullish alignment, fully stacked.
However, the hourly RSI at 85.63 is even more stretched than the daily reading. The close also sits just under the upper Bollinger band at $0.83. The hourly MACD line at 0.06 remains above its signal at 0.04, keeping the near-term bias bullish. Yet the narrow gap to the band ceiling leaves little room for further upside before a pause becomes likely.
15-Minute Chart and Pivot Levels
The 15-minute chart, used here only for execution context, shows the same alignment. Price sits above the 20-period EMA at $0.75, the 50-period EMA at $0.69, and the 200-period EMA at $0.60.
At the same time, the 15-minute RSI sits at 80, still firmly overbought. The MACD line at 0.03 has slipped just under its signal at 0.04. The histogram has flattened to zero. That is an early sign of fading short-term momentum.
In practice, the short-term chart is flashing the first hints of exhaustion. These signals appear right where the daily and hourly charts are already overbought. Meanwhile, price still trades above the upper Bollinger band at $0.81.
For the next session, the daily pivot sits at $0.75. First resistance stands at $0.89 and first support at $0.67. On the hourly chart, the pivot sits at $0.80, flanked by resistance at $0.84 and support at $0.79. The 15-minute pivot is tighter still, at $0.81, with resistance at $0.83 and support at $0.80. Together, these levels frame a narrow battleground.
Bullish Scenario
A bullish continuation for SES AI stock would need buyers to hold price above the daily pivot at $0.75. They would also need to push through the first resistance at $0.89.
Notably, several factors would support that case: follow-through volume, an expanding daily MACD histogram, and a hold above the EMA20/EMA50 cluster near $0.58 to $0.61. Clearing the 200-session EMA at $1.07 would be the clearer signal. It would suggest this move has turned into something more than a one-day reversal.
Bearish Scenario
The bearish case centers on the scale of the overbought readings across all three timeframes. This includes a daily RSI near 74.95, an hourly RSI above 85.63, and a close above the upper Bollinger band on the daily and 15-minute charts, though just under it on the hourly chart. These are not easy conditions to sustain for long.
A failure to hold the daily pivot at $0.75, or the hourly pivot at $0.80, would invalidate the bullish continuation. That would likely send price back toward the EMA20/EMA50 zone around $0.58 to $0.61. It could even reach the daily Bollinger mid at $0.56.
A break below the daily first support at $0.67 would be the clearer signal that the rally has failed to hold.
News Context
On the news side, the only company-specific item in recent days was a report from Investing.com. It was published on Monday, September 28, noting that an SES AI facility in South Korea achieved ISO 9001 certification. That report predates Thursday’s session by three days. It reads as a routine operational update rather than anything tied to the size of this move.
Closing Take: Positioning and Volatility
Overall, SES AI stock enters the next session caught between two competing realities. The daily chart shows an attempt to break out of a longer corrective phase. Yet it remains capped by the 200-session EMA well above current price.
Meanwhile, the hourly and 15-minute charts confirm strong near-term momentum. However, they are flashing some of the most overbought readings available on the tape. Positioning here carries real two-way risk.
In this environment, volatility, as reflected in the ATR readings across every timeframe, has expanded sharply. With RSI stretched on daily, hourly and 15-minute charts alike, a sharp pullback would not be surprising. That risk holds even if the broader attempt to reclaim higher ground continues.
The next session’s reaction to the daily pivot at $0.75 looks like the key level to watch.
FAQ
What are the key support and resistance levels for SES AI stock in the next session?
The daily pivot sits at $0.75, with first resistance at $0.89 and first support at $0.67. On the hourly chart, the pivot is at $0.80, flanked by resistance at $0.84 and support at $0.79. The 15-minute pivot sits at $0.81, with resistance at $0.83 and support at $0.80.
Is SES AI stock overbought after the 36% rally?
Yes. The daily RSI reads 74.95, deep in overbought territory. The hourly RSI is even more stretched at 85.63, and the 15-minute RSI sits at 80. Price also closed above the upper Bollinger band on the daily and 15-minute charts, though it stayed just under the hourly band, reinforcing the overbought signal.
Where does SES AI stock stand relative to its moving averages?
The close at $0.82 sits above the 20-session EMA at $0.58 and the 50-session EMA at $0.61. However, it remains below the 200-session EMA at $1.07. This signals a sharp reversal inside a broader downtrend rather than a new uptrend.
What was SES AI’s trading volume on Thursday?
Volume reached 80,740,900 shares during the session, reflecting the scale of the 36% single-session rally.
Disclaimer: This article is for informational purposes only and does not constitute financial advice, an investment recommendation, or a solicitation to buy or sell any financial instrument or cryptocurrency. The analysis provided is not indicative of future results. Investing in crypto assets and financial markets carries a high risk of capital loss. Always do your own research (DYOR) and consult a qualified financial advisor before making any decision.
Article produced with the assistance of artificial intelligence and reviewed by the editorial team.