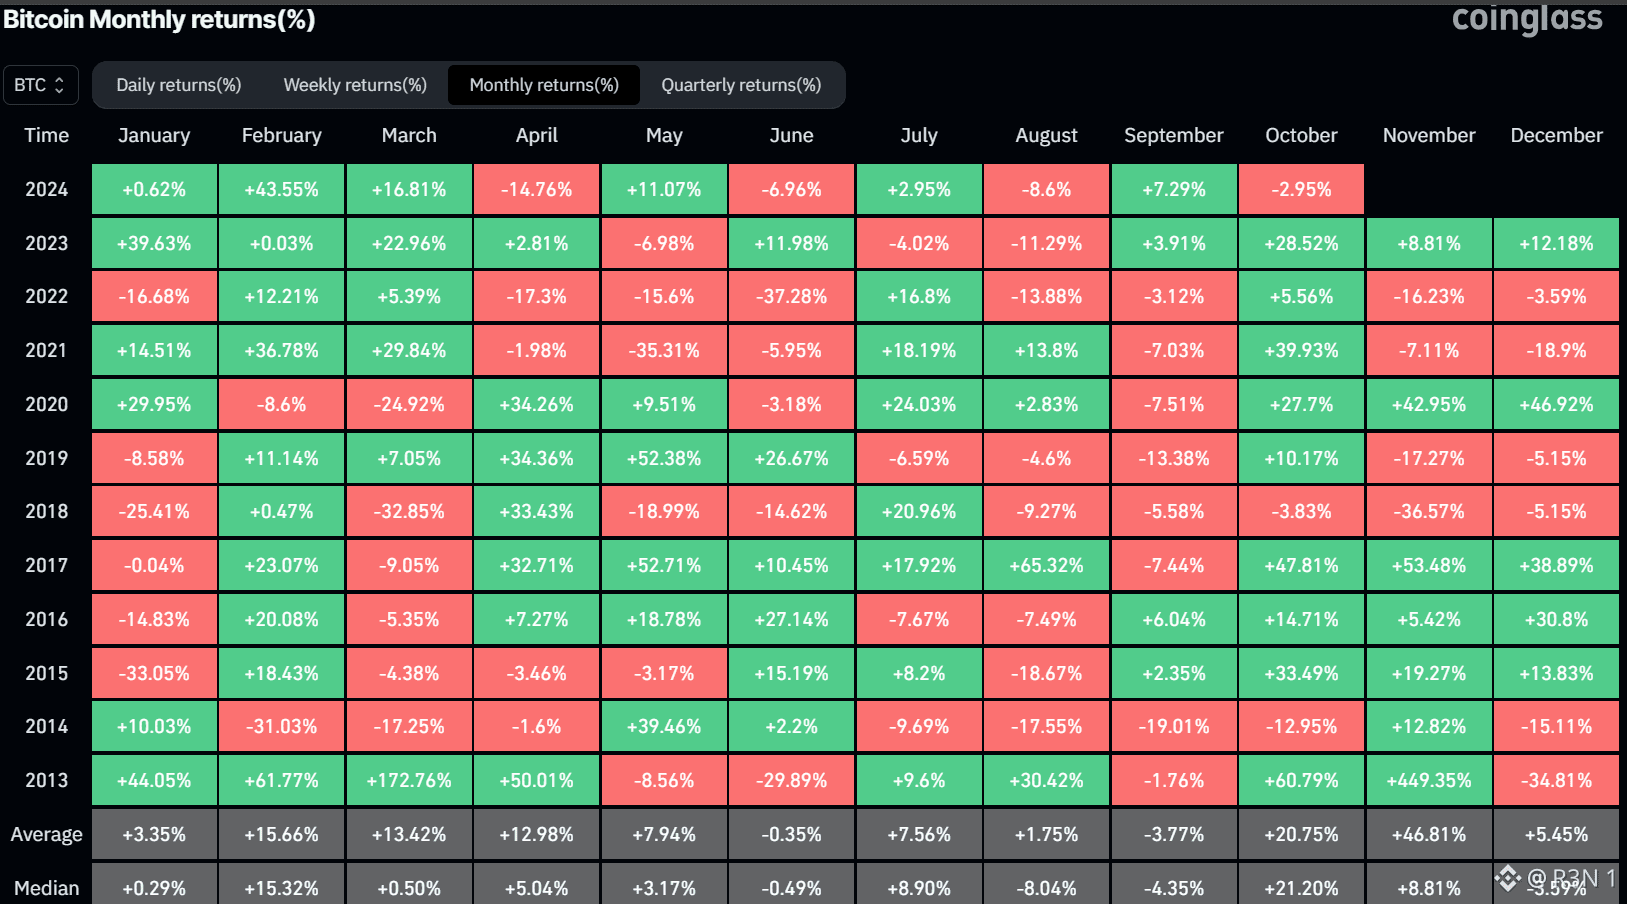
Ten green Octobers out of thirteen since 2013, averaging roughly 19% gains. That's the stat getting repeated everywhere right now, and it's accurate, but the one year that broke the pattern is actually more instructive than the nine that confirmed it. October 2025 started with $BTC near $119,000, hit a record above $126,000 early in the month, looked like Uptober playing out exactly as scripted, then finished down nearly 4%, the first red October since 2018. A US China trade dispute flare up and record liquidations did that, not a failure of the seasonal pattern itself, an external macro shock overriding historical tendency. That's the actual lesson, seasonality is a probability, not a guarantee, and it's broken before specifically when something unrelated to the calendar intervened. This year's setup into October is genuinely different from last year's though. BTC just posted three green months in a row for the first time since 2012, up roughly 25% in August and another 9% in September, reaching an eight month high above $87,000. Large entities reportedly accumulated around 30,269 BTC, worth about $2.57 billion, over a recent 96 hour stretch, and spot ETFs pulled in close to $3 billion over ten days. When September itself closed positive, the five prior instances still saw October gains four times, averaging just under 17%, a smaller sample worth noting, not treating as separately conclusive. My honest read: the base rate is real and well documented, not cherry picked, but 2025 proved strong seasonal odds don't override a genuine macro shock. This year's momentum looks more constructive than last year's setup, but that's a different claim than the pattern being more reliable this time. What I'm watching: whether any comparable macro catalyst, trade policy, Fed surprises, shows up this October the way it did last year, since that's historically been the actual variable that's broken this pattern, not anything about the calendar itself.